| Param | Original file | Final file |
|---|---|---|
| Filename | modeM0/AS1A10_057T05_9000004060_28104cztM0_level2.evt | modeM0/AS1A10_057T05_9000004060_28104cztM0_level2_quad_clean.evt |
| Size (bytes) | 1,214,953,920 | 237,997,440 |
| Size | 1.1 GB | 227.0 MB |
| Events in quadrant A | 8,100,243 | 1,562,527 |
| Events in quadrant B | 8,179,806 | 1,533,230 |
| Events in quadrant C | 8,517,200 | 1,463,376 |
| Events in quadrant D | 10,829,115 | 1,458,477 |
| Mode M0 | |||
|---|---|---|---|
| Quadrant | BADHDUFLAG | Total packets | Discarded packets |
| A | 0 | 35324 | 0 |
| B | 0 | 35594 | 0 |
| C | 0 | 36436 | 0 |
| D | 0 | 43872 | 0 |
| Mode M9 | |||
|---|---|---|---|
| Quadrant | BADHDUFLAG | Total packets | Discarded packets |
| A | 0 | 21 | 1 |
| B | 0 | 21 | 3 |
| C | 0 | 21 | 3 |
| D | 0 | 21 | 1 |
| Quadrant | Total seconds | Saturated seconds | Saturation percentage |
|---|---|---|---|
| A | 17214 | 109 | 0.633206% |
| B | 17231 | 161 | 0.934362% |
| C | 17211 | 276 | 1.603626% |
| D | 17014 | 482 | 2.832961% |
Noise dominated data is calculated using 1-second bins in cleaned event files. If a bin has >2000 counts, and if more than 50% of those come from <1% of pixels, then it is considered to be noise-dominated and hence unusable.
| Quadrant | # 1 sec bins | Bins with >0 counts | Bins with >2000 counts | High rate bins dominated by noise | Noise dominated (total time) | Noise dominated (detector-on time) | Marked lightcurve |
|---|---|---|---|---|---|---|---|
| A | 20963 | 17634 | 4 | 4 | 0.02% | 0.02% | 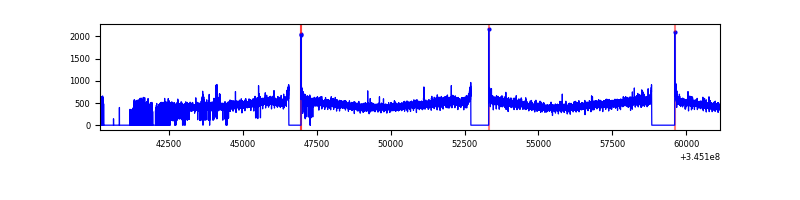 |
| B | 20956 | 17635 | 2 | 2 | 0.01% | 0.01% | 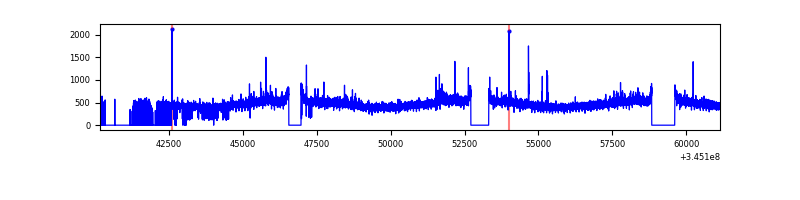 |
| C | 20960 | 17631 | 39 | 39 | 0.19% | 0.22% | 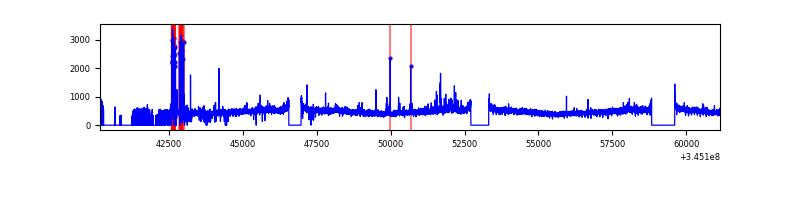 |
| D | 20963 | 17409 | 281 | 281 | 1.34% | 1.61% | 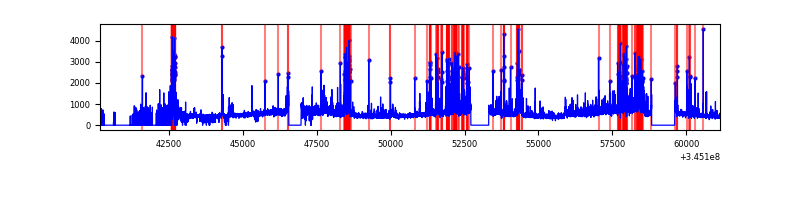 |
Top three noisy pixels from each quadrant. If the there are fewer than three noisy pixels in the level2.evt file, extra rows are filled as -1
| Pixel properties | Quadrant properties | ||||||
|---|---|---|---|---|---|---|---|
| Quadrant | DetID | PixID | Counts | Sigma | Mean | Median | Sigma |
| A | 13 | 254 | 29230 | 64.93 | 2087 | 2046 | 418.7 |
| A | 5 | 98 | 27486 | 60.76 | 2087 | 2046 | 418.7 |
| A | 8 | 192 | 20843 | 44.9 | 2087 | 2046 | 418.7 |
| B | 0 | 230 | 57166 | 141.17 | 2054 | 2003 | 390.8 |
| B | 12 | 111 | 49416 | 121.33 | 2054 | 2003 | 390.8 |
| B | 11 | 111 | 45070 | 110.21 | 2054 | 2003 | 390.8 |
| C | 14 | 238 | 313425 | 671.49 | 1977 | 1994 | 463.8 |
| C | 15 | 208 | 215416 | 460.17 | 1977 | 1994 | 463.8 |
| C | 3 | 233 | 197202 | 420.9 | 1977 | 1994 | 463.8 |
| D | 8 | 195 | 1399981 | 2942.3 | 1974 | 1917 | 475.2 |
| D | 2 | 250 | 955190 | 2006.22 | 1974 | 1917 | 475.2 |
| D | 1 | 52 | 501599 | 1051.61 | 1974 | 1917 | 475.2 |
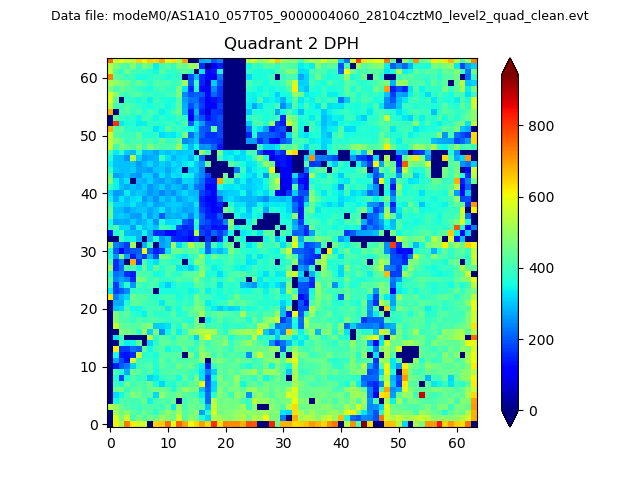
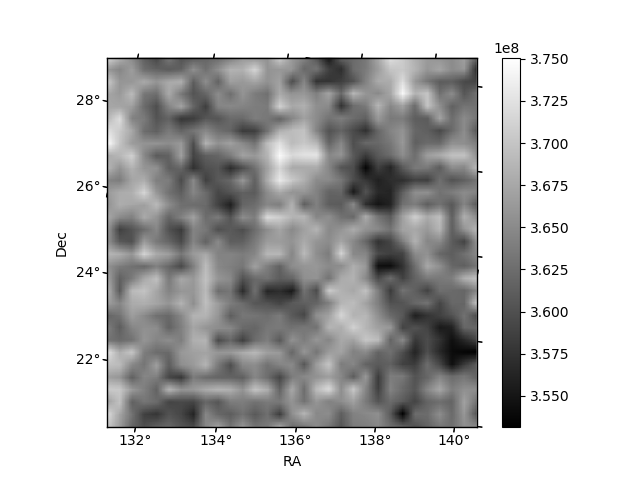
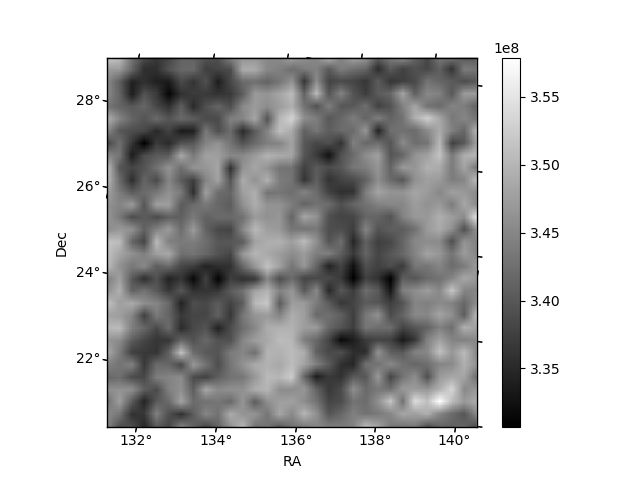
Histogram calculated using DETX and DETY for each event in the final _common_clean file
| Quadrant A | 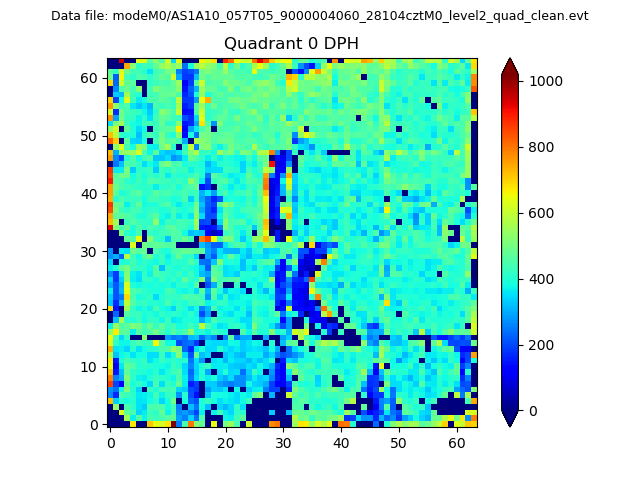 |
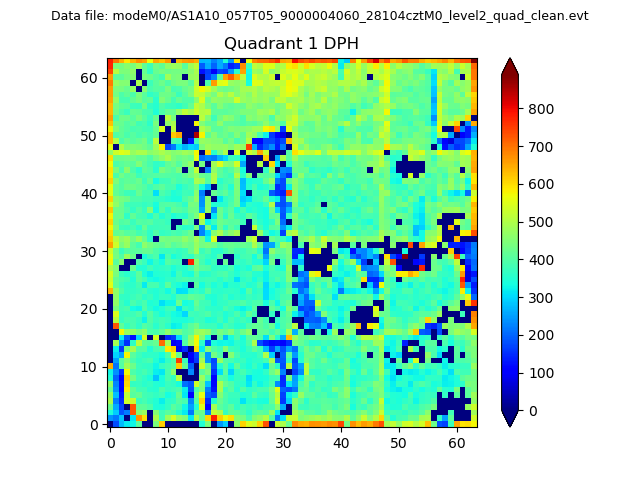 |
Quadrant B |
|---|---|---|---|
| Quadrant D | 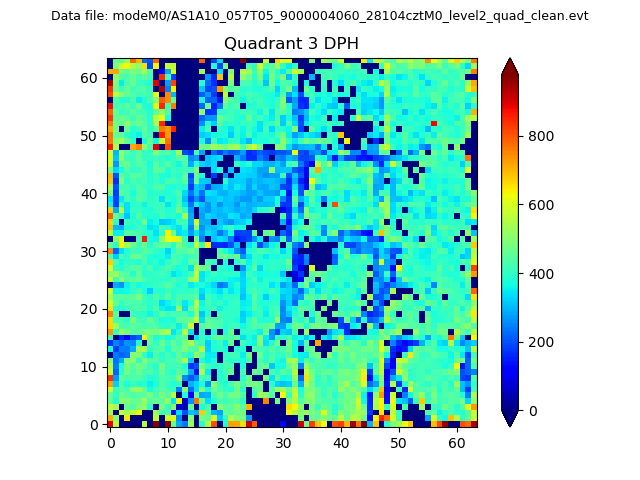 |
 |
Quadrant C |
| Plot type | Count rate plots | Images |
|---|---|---|
| Comparison with Poisson distribution Blue bars denote a histogram of data divided into 1 sec bins. Red curve is a Poisson curve with rate = median count rate of data. |
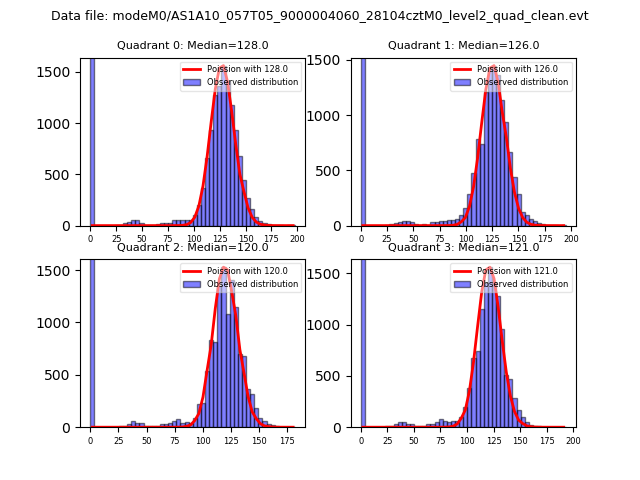 |
 |
| Quadrant-wise count rates Data is divided into 100 sec bins |
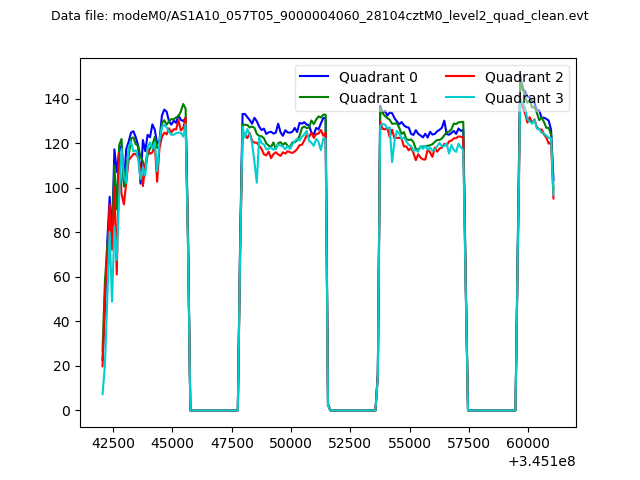 |
|
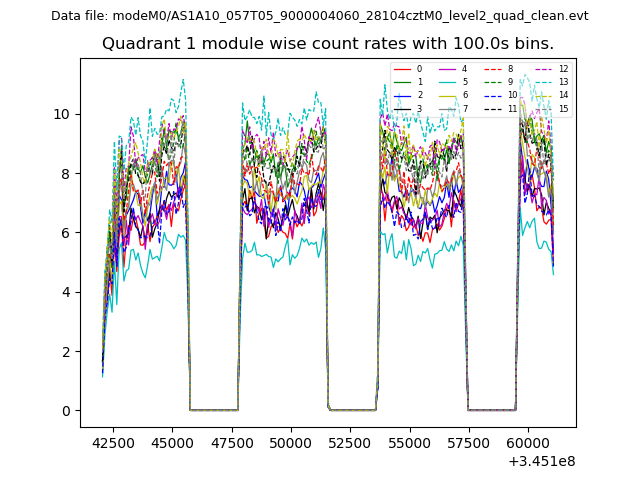
| Module-wise count rates for Quadrant A Data is divided into 100 sec bins |
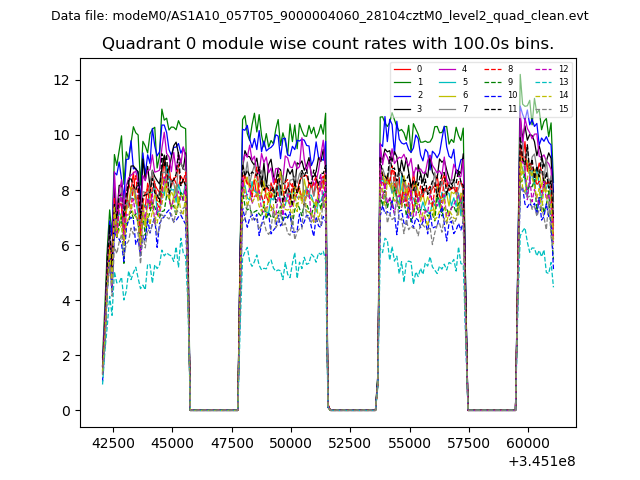 |
 |
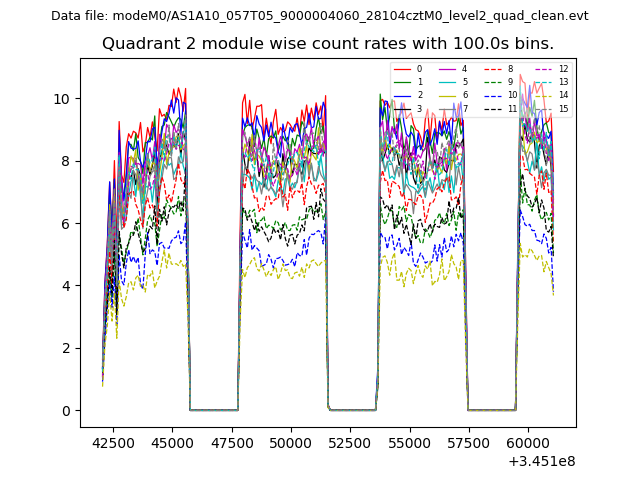
| Module-wise count rates for Quadrant B Data is divided into 100 sec bins |
 |
 |
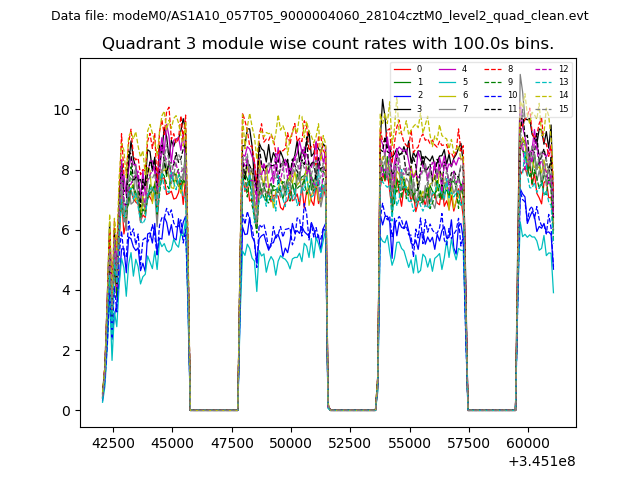
| Module-wise count rates for Quadrant C Data is divided into 100 sec bins |
 |
 |
| Module-wise count rates for Quadrant D Data is divided into 100 sec bins |
 |
 |
| Parameter | Plot |
|---|---|
| CZT HV Monitor | 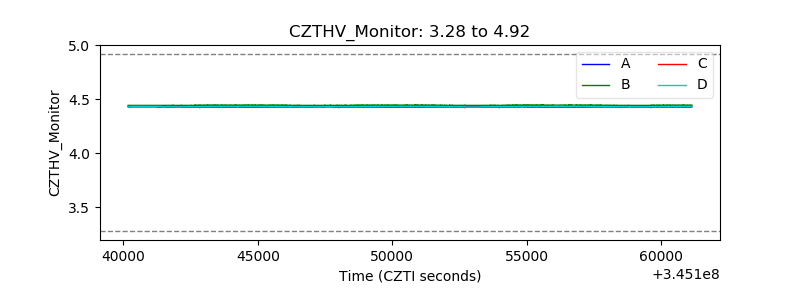 |
| D_VDD | 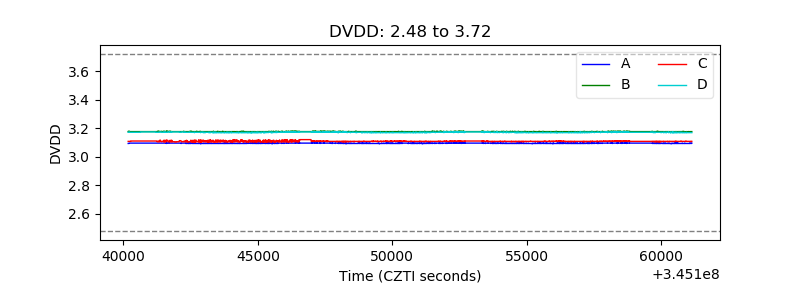 |
| Temperature 1 | 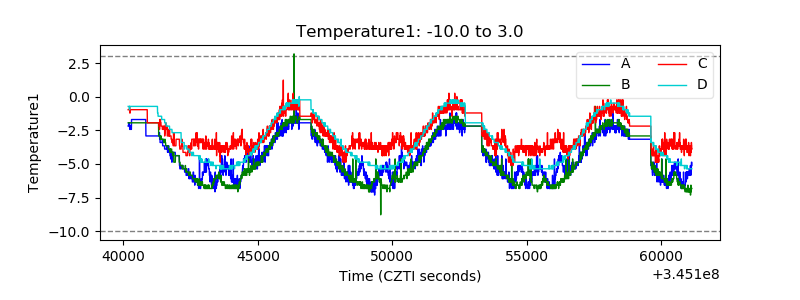 |
| Veto HV Monitor |  |
| Veto LLD | 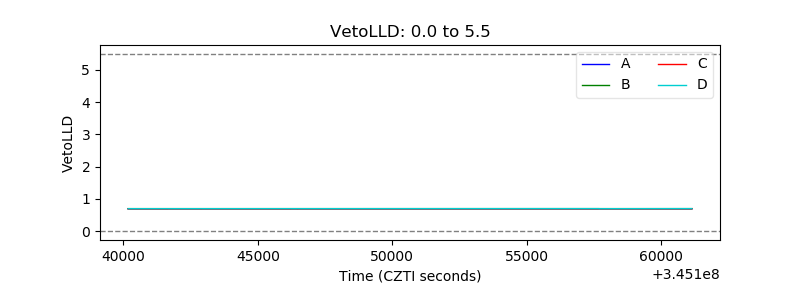 |
| Alpha Counter | 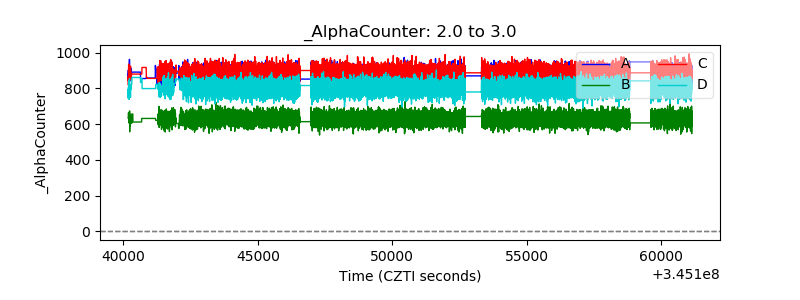 |
| _CPM_Rate | 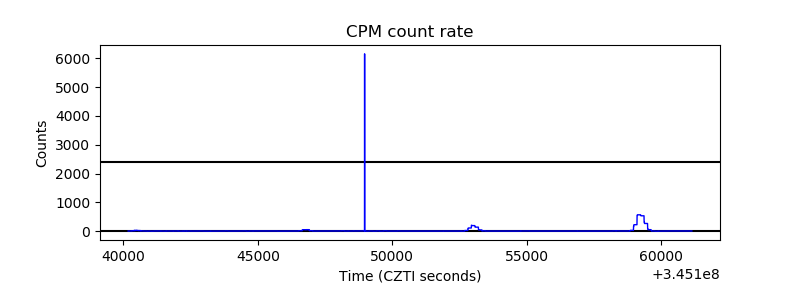 |
| CZT Counter | 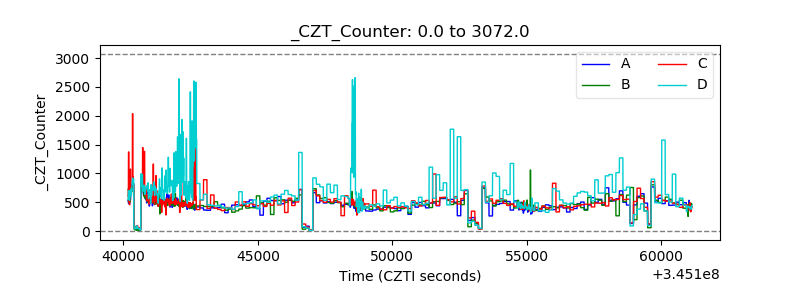 |
| +2.5 Volts monitor |  |
| +5 Volts monitor | 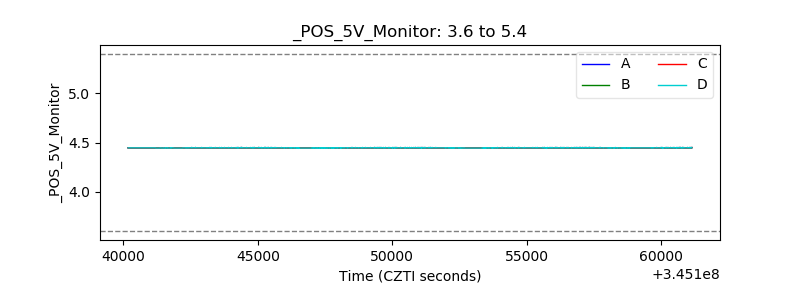 |
| _ROLL_ROT | 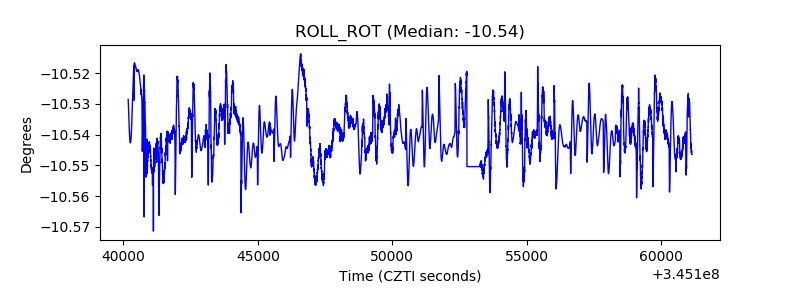 |
| _Roll_DEC | 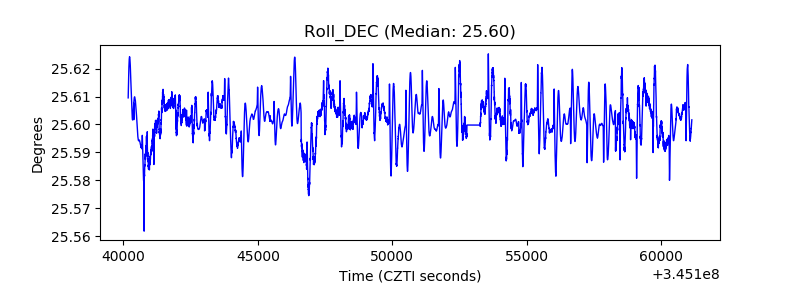 |
| _Roll_RA |  |
| Veto Counter | 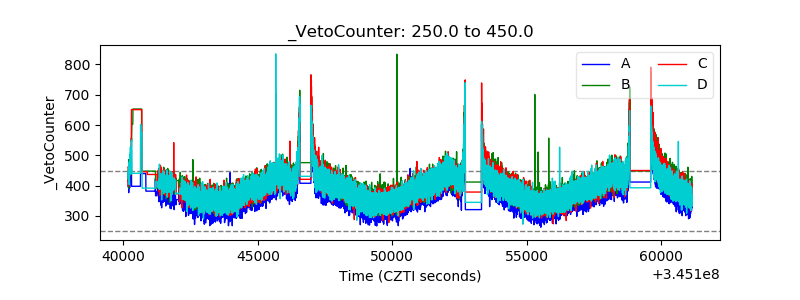 |