| Param | Original file | Final file |
|---|---|---|
| Filename | modeM0/AS1A10_057T05_9000004060_28107cztM0_level2.evt | modeM0/AS1A10_057T05_9000004060_28107cztM0_level2_quad_clean.evt |
| Size (bytes) | 1,491,157,440 | 310,115,520 |
| Size | 1.4 GB | 295.7 MB |
| Events in quadrant A | 10,035,139 | 2,049,374 |
| Events in quadrant B | 10,138,996 | 2,018,351 |
| Events in quadrant C | 10,614,062 | 1,923,761 |
| Events in quadrant D | 12,926,837 | 1,929,775 |
| Mode M0 | |||
|---|---|---|---|
| Quadrant | BADHDUFLAG | Total packets | Discarded packets |
| A | 0 | 43882 | 0 |
| B | 0 | 44277 | 0 |
| C | 0 | 45435 | 0 |
| D | 0 | 53205 | 0 |
| Mode M9 | |||
|---|---|---|---|
| Quadrant | BADHDUFLAG | Total packets | Discarded packets |
| A | 0 | 24 | 0 |
| B | 0 | 24 | 0 |
| C | 0 | 24 | 0 |
| D | 0 | 24 | 0 |
| Quadrant | Total seconds | Saturated seconds | Saturation percentage |
|---|---|---|---|
| A | 21382 | 127 | 0.593958% |
| B | 21382 | 176 | 0.823122% |
| C | 21382 | 323 | 1.510616% |
| D | 21382 | 444 | 2.076513% |
Noise dominated data is calculated using 1-second bins in cleaned event files. If a bin has >2000 counts, and if more than 50% of those come from <1% of pixels, then it is considered to be noise-dominated and hence unusable.
| Quadrant | # 1 sec bins | Bins with >0 counts | Bins with >2000 counts | High rate bins dominated by noise | Noise dominated (total time) | Noise dominated (detector-on time) | Marked lightcurve |
|---|---|---|---|---|---|---|---|
| A | 32160 | 21386 | 3 | 3 | 0.01% | 0.01% | 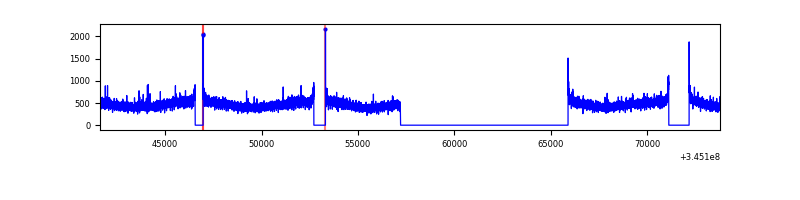 |
| B | 32161 | 21384 | 4 | 4 | 0.01% | 0.02% | 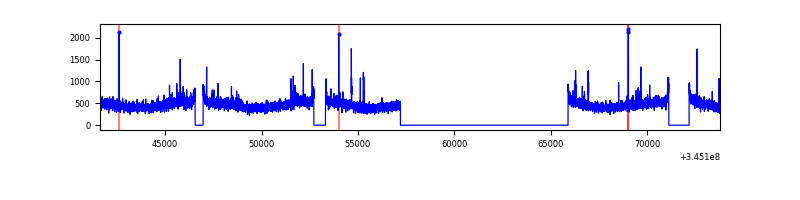 |
| C | 32161 | 21384 | 60 | 60 | 0.19% | 0.28% | 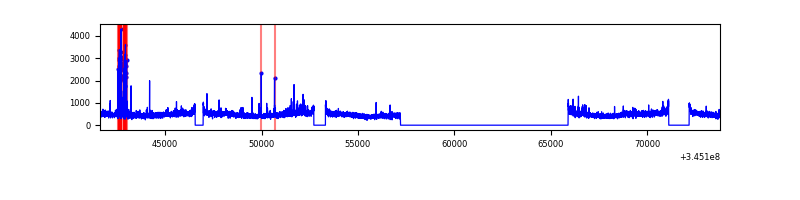 |
| D | 32161 | 21386 | 262 | 262 | 0.81% | 1.23% | 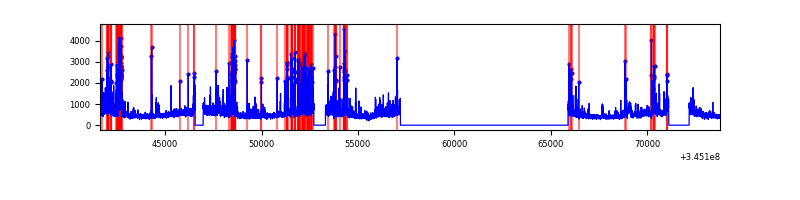 |
Top three noisy pixels from each quadrant. If the there are fewer than three noisy pixels in the level2.evt file, extra rows are filled as -1
| Pixel properties | Quadrant properties | ||||||
|---|---|---|---|---|---|---|---|
| Quadrant | DetID | PixID | Counts | Sigma | Mean | Median | Sigma |
| A | 13 | 254 | 35489 | 64.12 | 2582 | 2530 | 514.0 |
| A | 5 | 98 | 35161 | 63.48 | 2582 | 2530 | 514.0 |
| A | 3 | 137 | 25209 | 44.12 | 2582 | 2530 | 514.0 |
| B | 0 | 230 | 84375 | 170.19 | 2544 | 2484 | 481.2 |
| B | 12 | 111 | 60364 | 120.29 | 2544 | 2484 | 481.2 |
| B | 11 | 111 | 54780 | 108.68 | 2544 | 2484 | 481.2 |
| C | 14 | 238 | 392293 | 682.73 | 2447 | 2468 | 571.0 |
| C | 3 | 233 | 316542 | 550.06 | 2447 | 2468 | 571.0 |
| C | 15 | 208 | 287220 | 498.71 | 2447 | 2468 | 571.0 |
| D | 8 | 195 | 1243565 | 2103.04 | 2474 | 2407 | 590.2 |
| D | 2 | 250 | 940436 | 1589.42 | 2474 | 2407 | 590.2 |
| D | 1 | 52 | 675239 | 1140.06 | 2474 | 2407 | 590.2 |
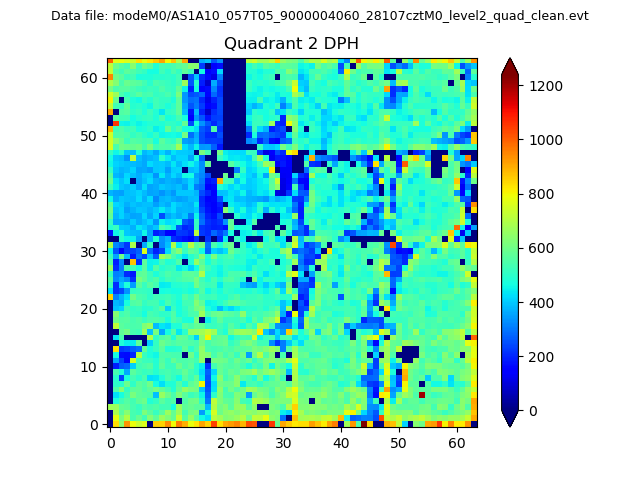
Histogram calculated using DETX and DETY for each event in the final _common_clean file
| Quadrant A | 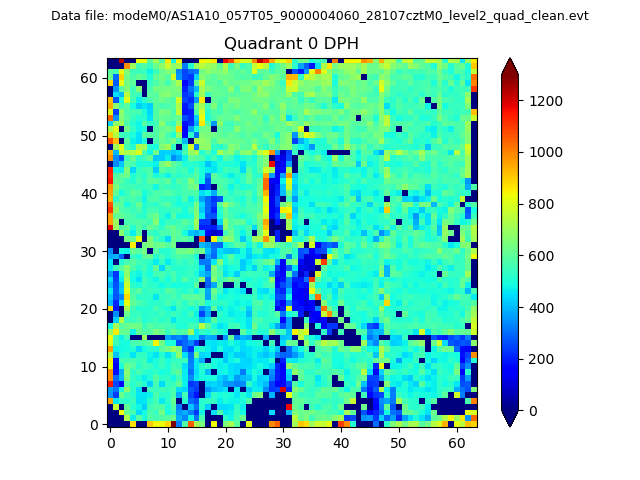 |
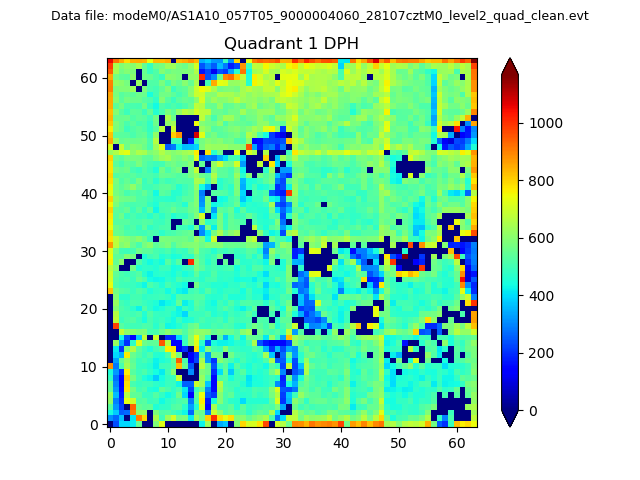 |
Quadrant B |
|---|---|---|---|
| Quadrant D | 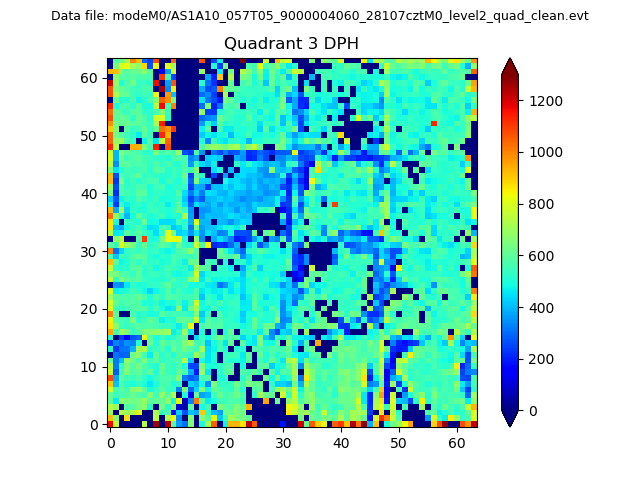 |
 |
Quadrant C |
| Plot type | Count rate plots | Images |
|---|---|---|
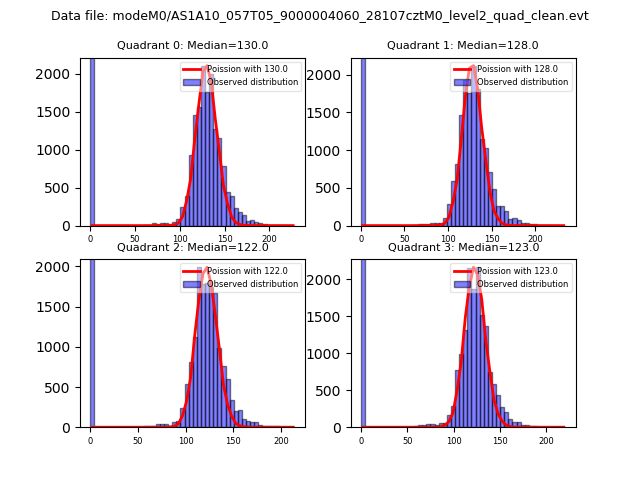
| Comparison with Poisson distribution Blue bars denote a histogram of data divided into 1 sec bins. Red curve is a Poisson curve with rate = median count rate of data. |
 |
 |
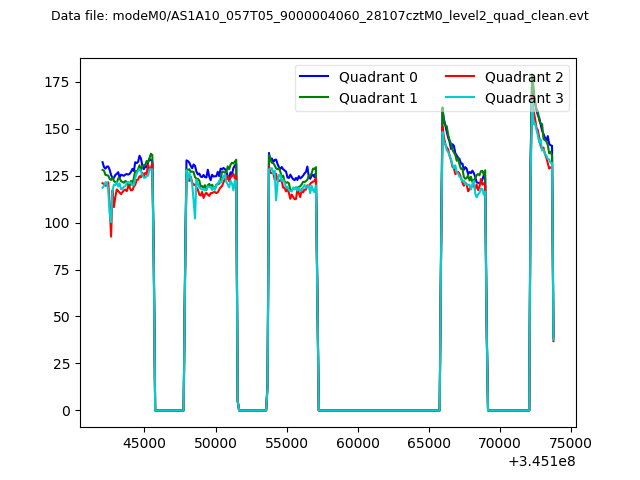
| Quadrant-wise count rates Data is divided into 100 sec bins |
 |
|
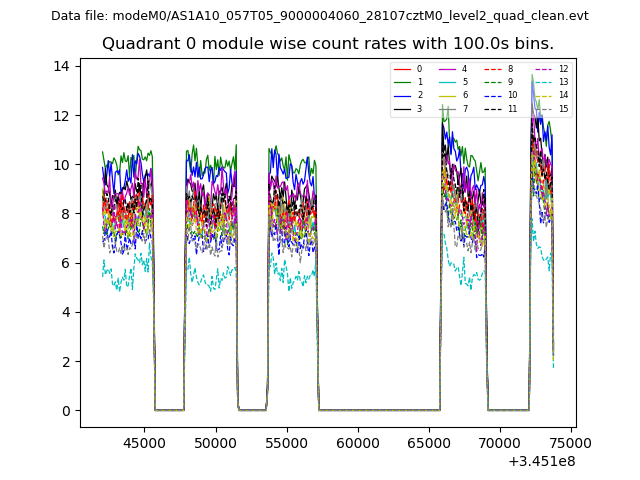
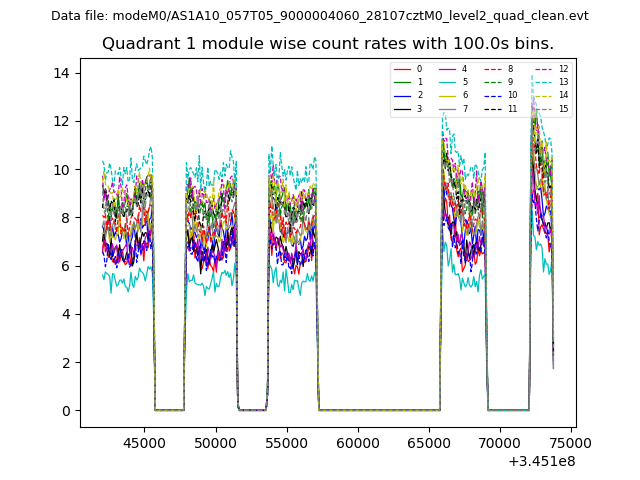
| Module-wise count rates for Quadrant A Data is divided into 100 sec bins |
 |
 |
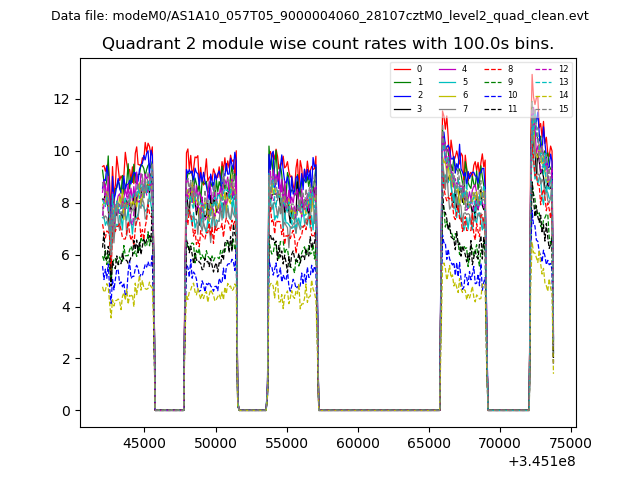
| Module-wise count rates for Quadrant B Data is divided into 100 sec bins |
 |
 |
| Module-wise count rates for Quadrant C Data is divided into 100 sec bins |
 |
 |
| Module-wise count rates for Quadrant D Data is divided into 100 sec bins |
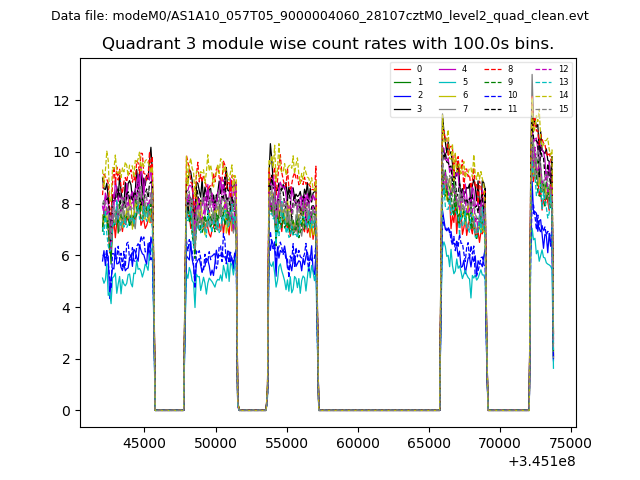 |
 |
| Parameter | Plot |
|---|---|
| CZT HV Monitor | 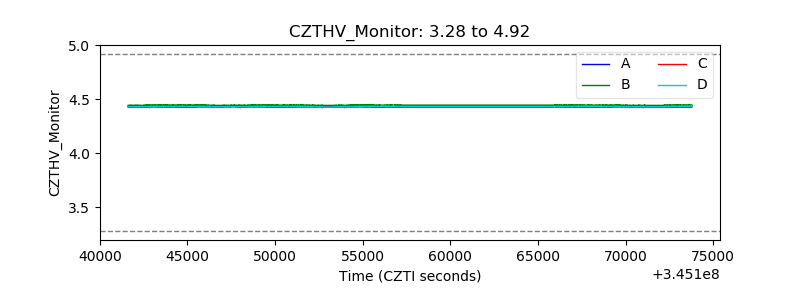 |
| D_VDD | 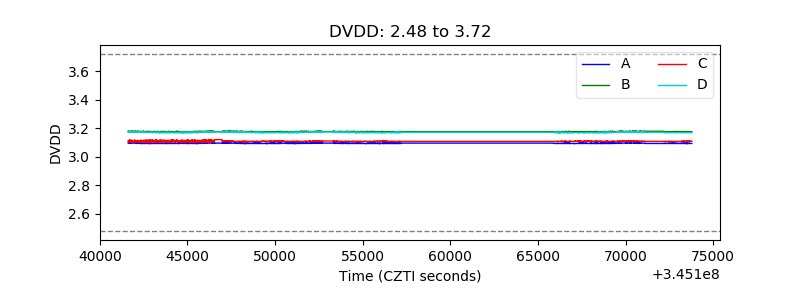 |
| Temperature 1 | 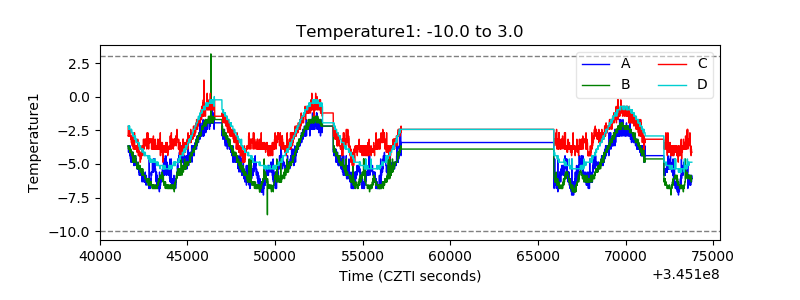 |
| Veto HV Monitor | 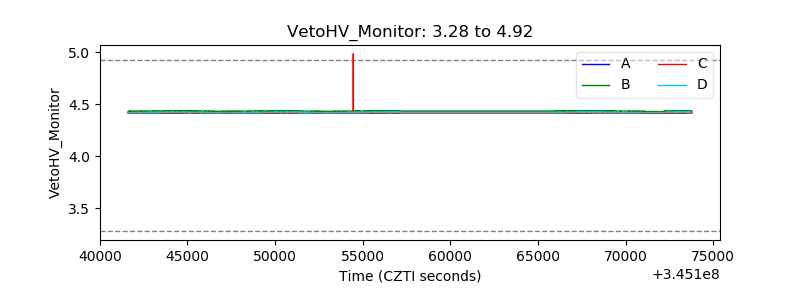 |
| Veto LLD | 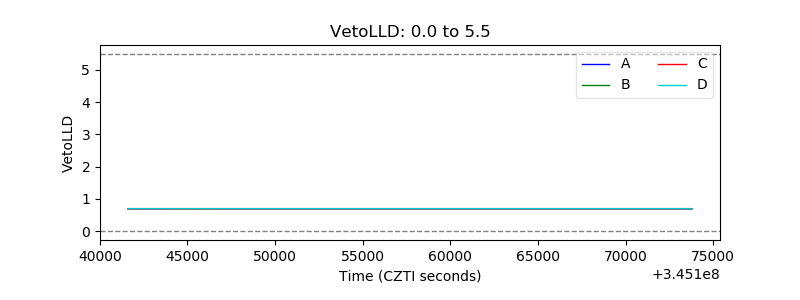 |
| Alpha Counter | 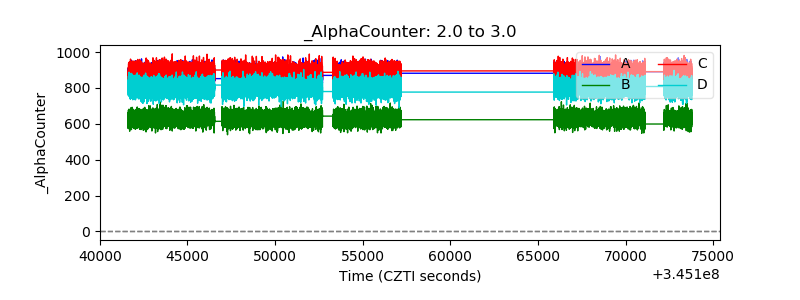 |
| _CPM_Rate | 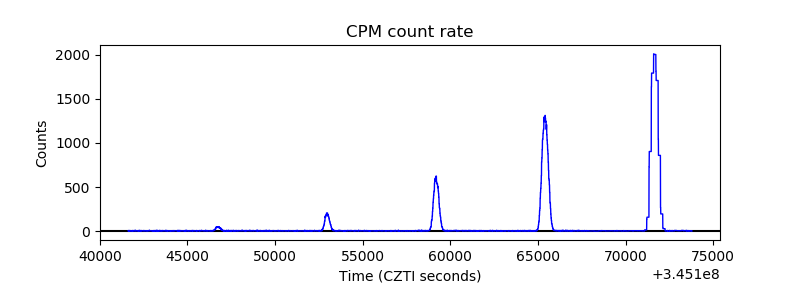 |
| CZT Counter | 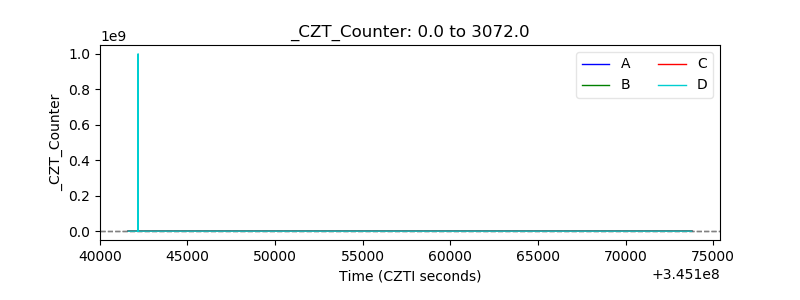 |
| +2.5 Volts monitor |  |
| +5 Volts monitor |  |
| _ROLL_ROT | 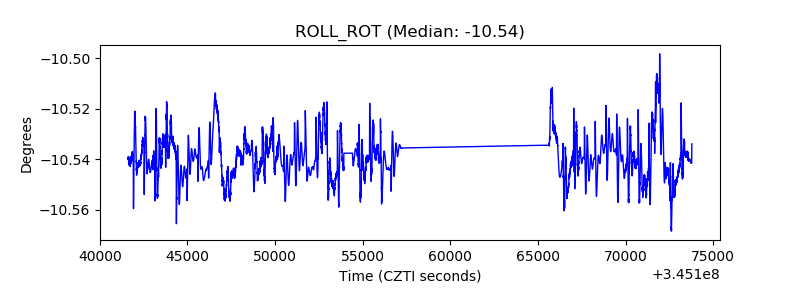 |
| _Roll_DEC | 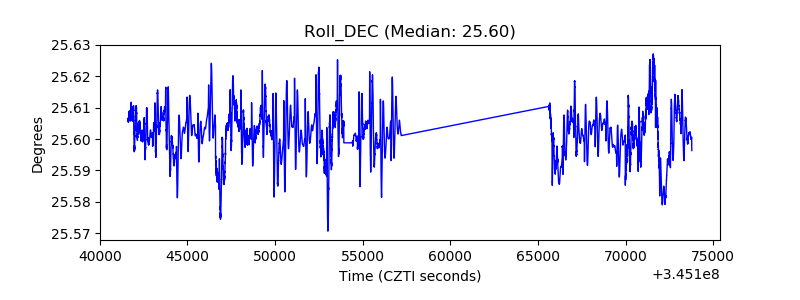 |
| _Roll_RA | 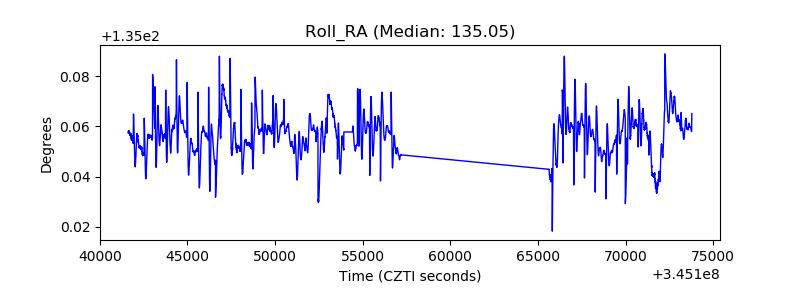 |
| Veto Counter | 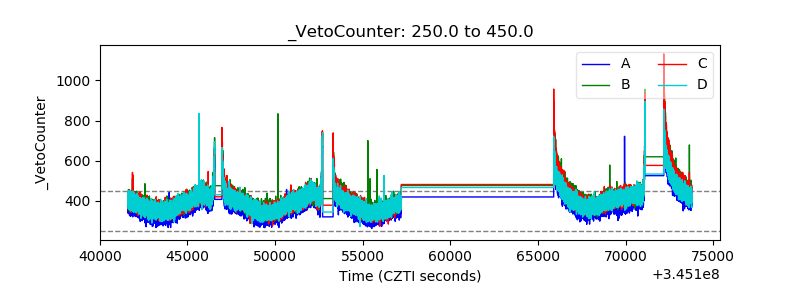 |