| Param | Original file | Final file |
|---|---|---|
| Filename | modeM0/AS1A10_057T05_9000004060_28108cztM0_level2.evt | modeM0/AS1A10_057T05_9000004060_28108cztM0_level2_quad_clean.evt |
| Size (bytes) | 1,618,194,240 | 316,108,800 |
| Size | 1.5 GB | 301.5 MB |
| Events in quadrant A | 10,994,458 | 2,065,218 |
| Events in quadrant B | 11,144,862 | 2,047,531 |
| Events in quadrant C | 11,345,793 | 1,949,610 |
| Events in quadrant D | 13,975,483 | 1,936,454 |
| Mode M0 | |||
|---|---|---|---|
| Quadrant | BADHDUFLAG | Total packets | Discarded packets |
| A | 0 | 47276 | 0 |
| B | 0 | 47779 | 0 |
| C | 0 | 48352 | 0 |
| D | 0 | 57684 | 0 |
| Mode M9 | |||
|---|---|---|---|
| Quadrant | BADHDUFLAG | Total packets | Discarded packets |
| A | 0 | 40 | 0 |
| B | 0 | 41 | 0 |
| C | 0 | 41 | 0 |
| D | 0 | 41 | 0 |
| Quadrant | Total seconds | Saturated seconds | Saturation percentage |
|---|---|---|---|
| A | 22908 | 130 | 0.567487% |
| B | 22908 | 170 | 0.742099% |
| C | 22907 | 276 | 1.204872% |
| D | 22906 | 370 | 1.615297% |
Noise dominated data is calculated using 1-second bins in cleaned event files. If a bin has >2000 counts, and if more than 50% of those come from <1% of pixels, then it is considered to be noise-dominated and hence unusable.
| Quadrant | # 1 sec bins | Bins with >0 counts | Bins with >2000 counts | High rate bins dominated by noise | Noise dominated (total time) | Noise dominated (detector-on time) | Marked lightcurve |
|---|---|---|---|---|---|---|---|
| A | 26848 | 22912 | 2 | 2 | 0.01% | 0.01% | 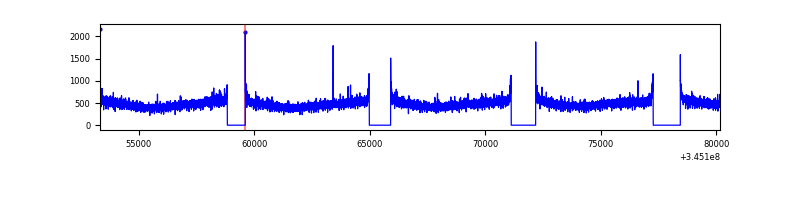 |
| B | 26848 | 22910 | 4 | 4 | 0.01% | 0.02% | 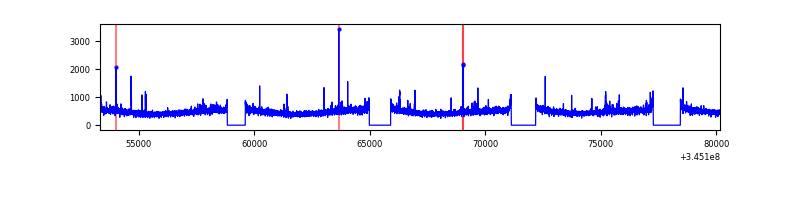 |
| C | 26847 | 22910 | 1 | 1 | 0.00% | 0.00% | 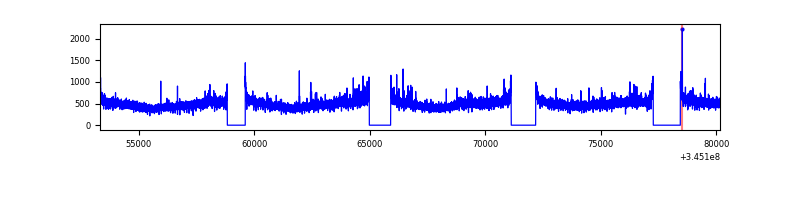 |
| D | 26847 | 22910 | 238 | 238 | 0.89% | 1.04% | 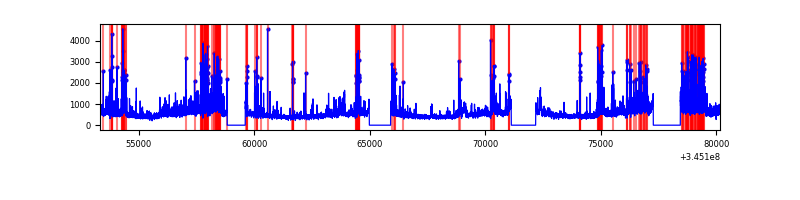 |
Top three noisy pixels from each quadrant. If the there are fewer than three noisy pixels in the level2.evt file, extra rows are filled as -1
| Pixel properties | Quadrant properties | ||||||
|---|---|---|---|---|---|---|---|
| Quadrant | DetID | PixID | Counts | Sigma | Mean | Median | Sigma |
| A | 13 | 254 | 38078 | 63.0 | 2833 | 2782 | 560.2 |
| A | 5 | 98 | 33162 | 54.23 | 2833 | 2782 | 560.2 |
| A | 3 | 137 | 27396 | 43.93 | 2833 | 2782 | 560.2 |
| B | 0 | 230 | 83790 | 154.05 | 2792 | 2721 | 526.3 |
| B | 12 | 111 | 65980 | 120.21 | 2792 | 2721 | 526.3 |
| B | 11 | 111 | 59875 | 108.61 | 2792 | 2721 | 526.3 |
| C | 3 | 233 | 437901 | 697.02 | 2685 | 2707 | 624.4 |
| C | 14 | 238 | 433240 | 689.56 | 2685 | 2707 | 624.4 |
| C | 13 | 61 | 18579 | 25.42 | 2685 | 2707 | 624.4 |
| D | 8 | 195 | 1216870 | 1885.52 | 2714 | 2641 | 644.0 |
| D | 1 | 52 | 862365 | 1335.03 | 2714 | 2641 | 644.0 |
| D | 2 | 250 | 806977 | 1249.02 | 2714 | 2641 | 644.0 |
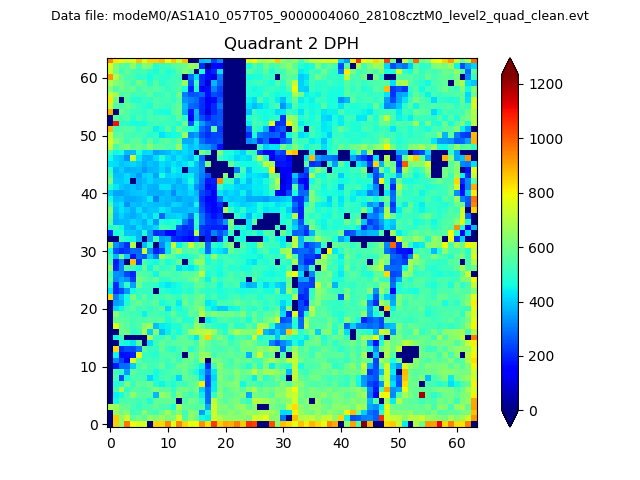
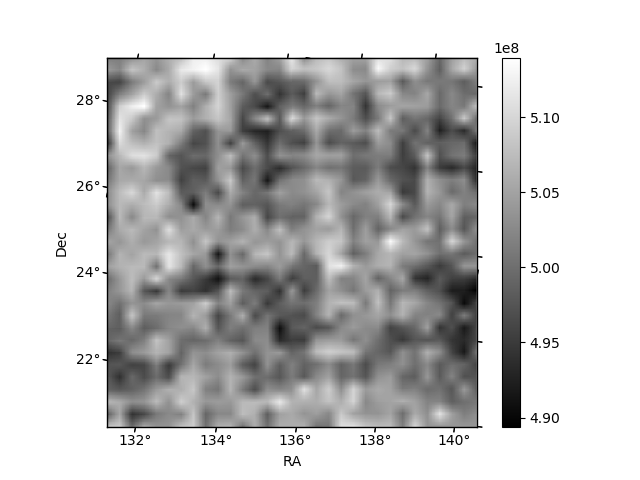
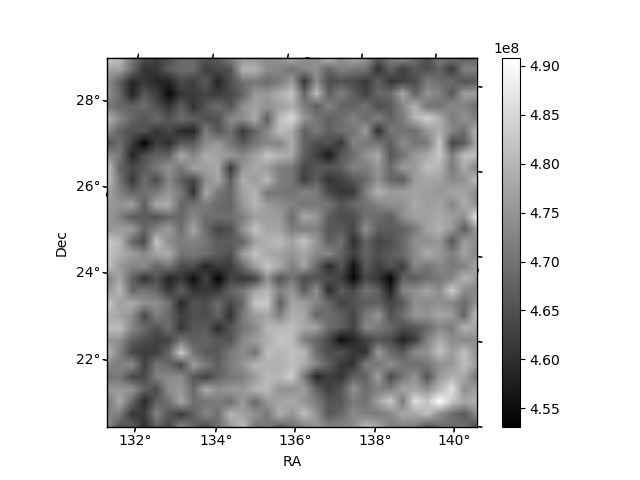
Histogram calculated using DETX and DETY for each event in the final _common_clean file
| Quadrant A |  |
 |
Quadrant B |
|---|---|---|---|
| Quadrant D | 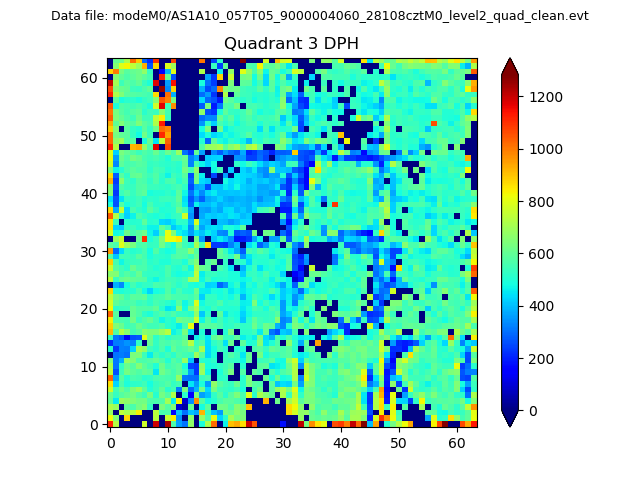 |
 |
Quadrant C |
| Plot type | Count rate plots | Images |
|---|---|---|
| Comparison with Poisson distribution Blue bars denote a histogram of data divided into 1 sec bins. Red curve is a Poisson curve with rate = median count rate of data. |
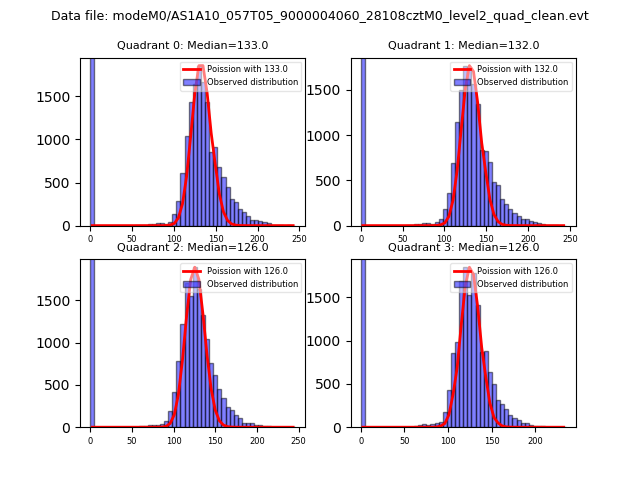 |
 |
| Quadrant-wise count rates Data is divided into 100 sec bins |
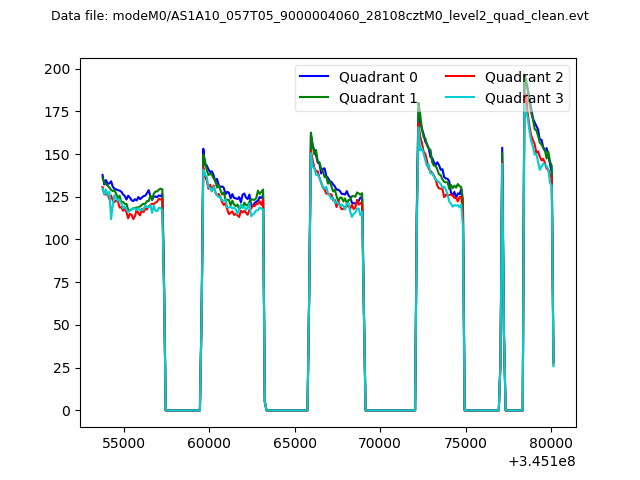 |
|
| Module-wise count rates for Quadrant A Data is divided into 100 sec bins |
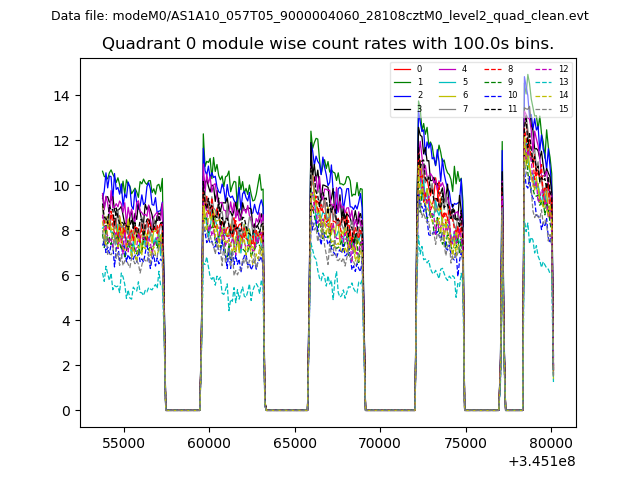 |
 |
| Module-wise count rates for Quadrant B Data is divided into 100 sec bins |
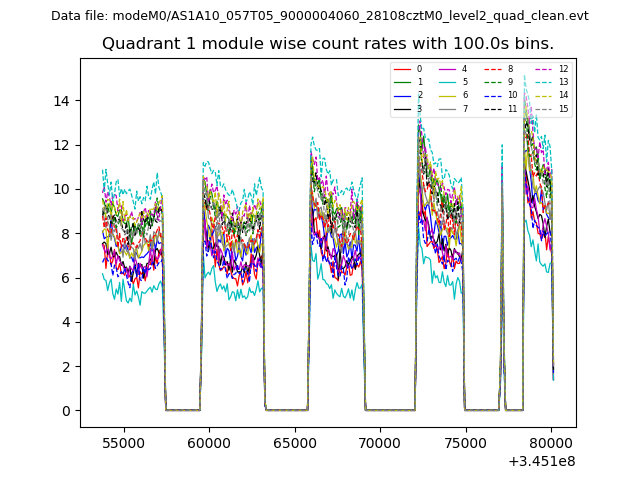 |
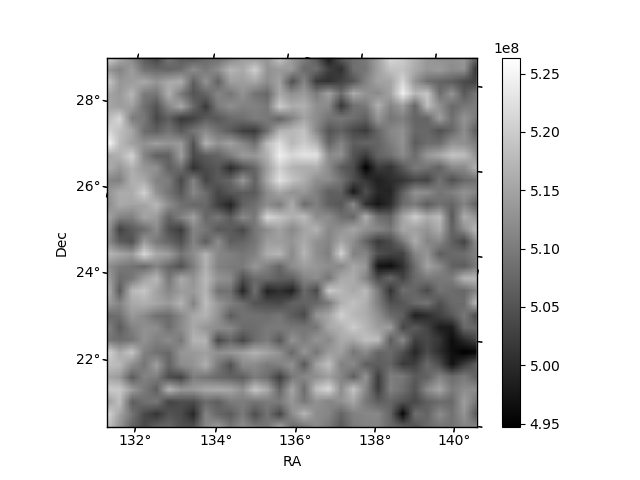 |
| Module-wise count rates for Quadrant C Data is divided into 100 sec bins |
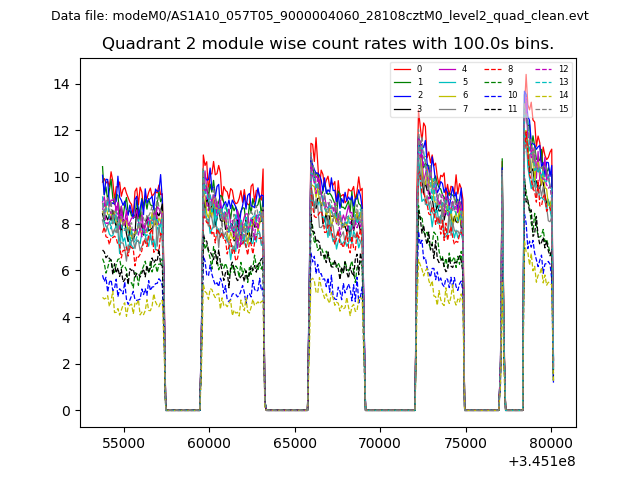 |
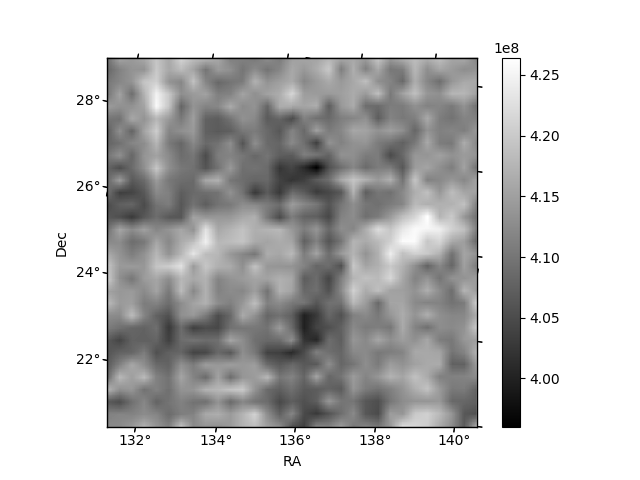 |
| Module-wise count rates for Quadrant D Data is divided into 100 sec bins |
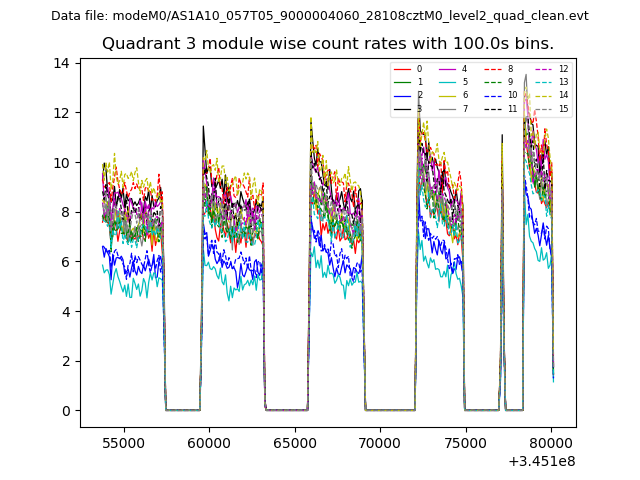 |
 |
| Parameter | Plot |
|---|---|
| CZT HV Monitor | 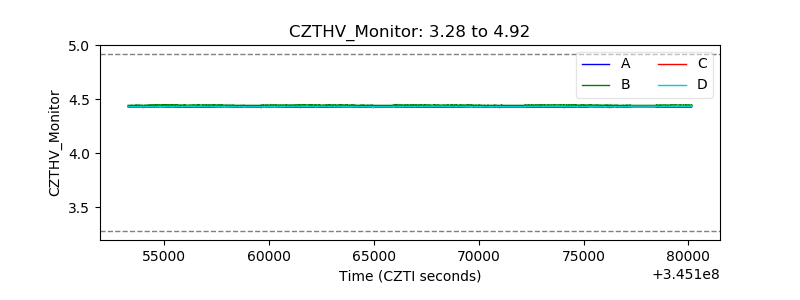 |
| D_VDD | 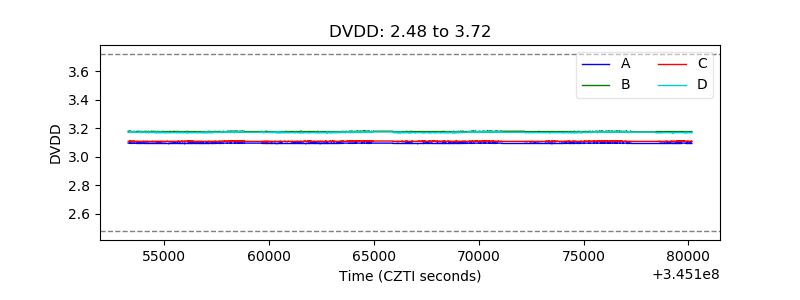 |
| Temperature 1 | 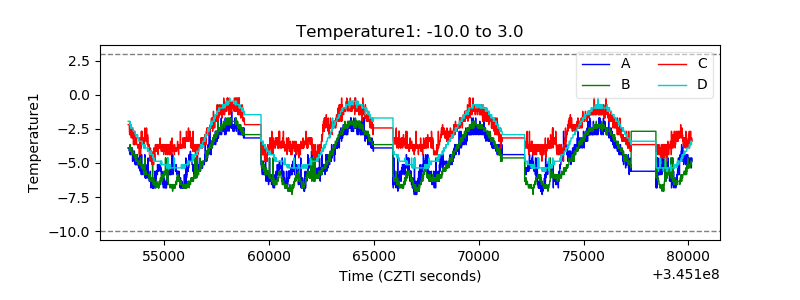 |
| Veto HV Monitor | 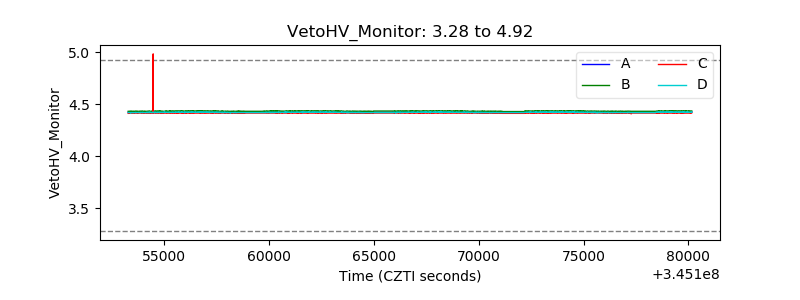 |
| Veto LLD | 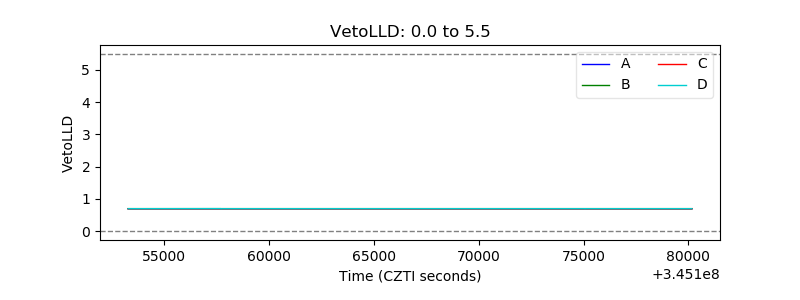 |
| Alpha Counter | 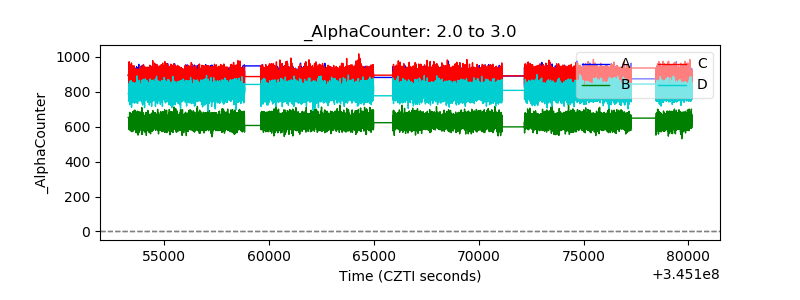 |
| _CPM_Rate | 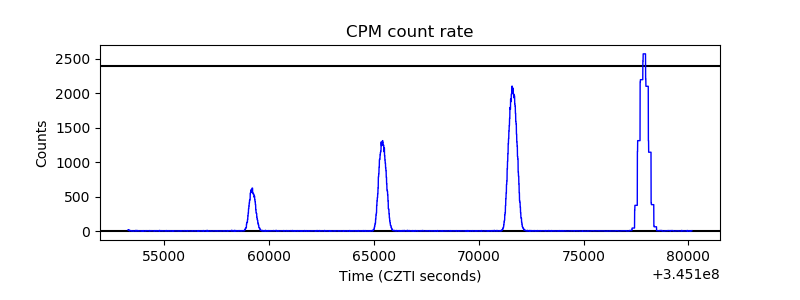 |
| CZT Counter | 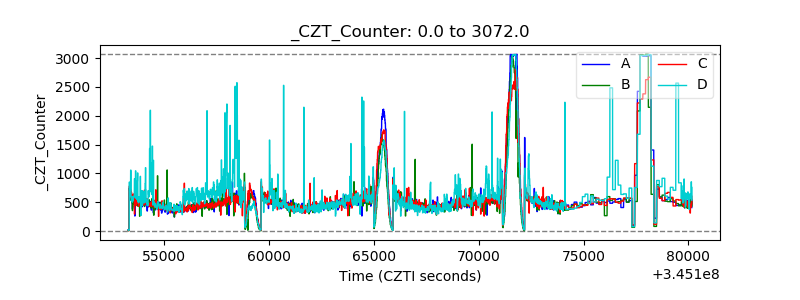 |
| +2.5 Volts monitor |  |
| +5 Volts monitor |  |
| _ROLL_ROT | 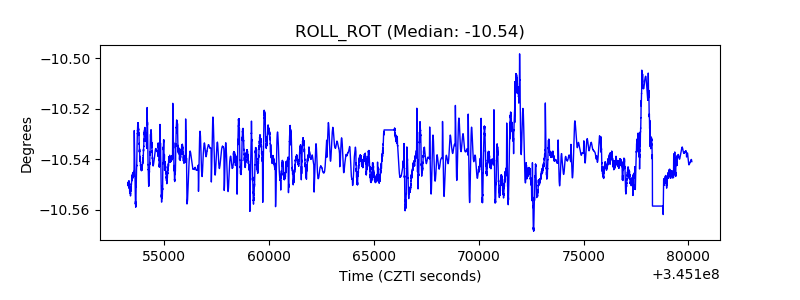 |
| _Roll_DEC | 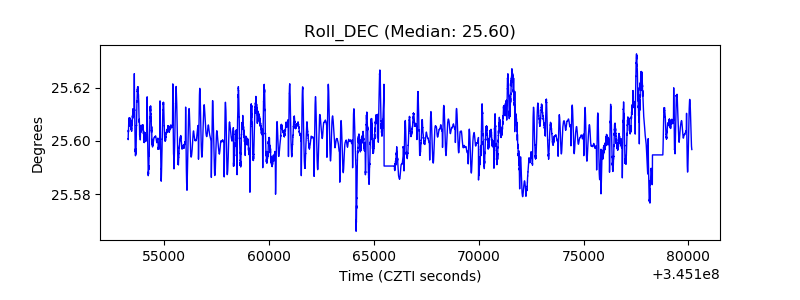 |
| _Roll_RA |  |
| Veto Counter | 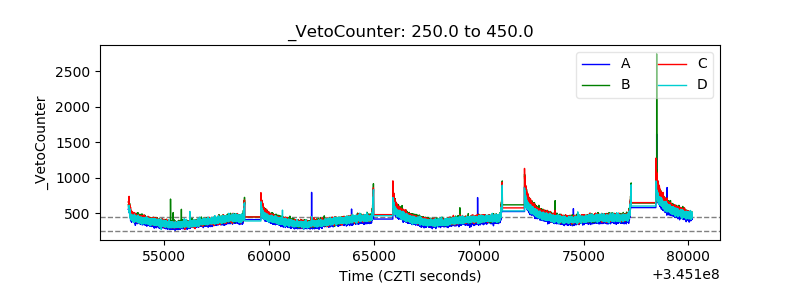 |