| Param | Original file | Final file |
|---|---|---|
| Filename | modeM0/AS1A10_057T05_9000004060_28109cztM0_level2.evt | modeM0/AS1A10_057T05_9000004060_28109cztM0_level2_quad_clean.evt |
| Size (bytes) | 550,350,720 | 103,947,840 |
| Size | 524.9 MB | 99.1 MB |
| Events in quadrant A | 3,369,589 | 700,213 |
| Events in quadrant B | 3,497,590 | 697,439 |
| Events in quadrant C | 3,478,393 | 657,034 |
| Events in quadrant D | 5,884,037 | 642,599 |
| Mode M0 | |||
|---|---|---|---|
| Quadrant | BADHDUFLAG | Total packets | Discarded packets |
| A | 0 | 13676 | 0 |
| B | 0 | 14243 | 0 |
| C | 0 | 14064 | 0 |
| D | 0 | 22210 | 0 |
| Mode M9 | |||
|---|---|---|---|
| Quadrant | BADHDUFLAG | Total packets | Discarded packets |
| A | 0 | 15 | 0 |
| B | 0 | 16 | 0 |
| C | 0 | 16 | 0 |
| D | 0 | 16 | 0 |
| Quadrant | Total seconds | Saturated seconds | Saturation percentage |
|---|---|---|---|
| A | 6460 | 32 | 0.495356% |
| B | 6460 | 55 | 0.851393% |
| C | 6460 | 77 | 1.191950% |
| D | 6459 | 539 | 8.344945% |
Noise dominated data is calculated using 1-second bins in cleaned event files. If a bin has >2000 counts, and if more than 50% of those come from <1% of pixels, then it is considered to be noise-dominated and hence unusable.
| Quadrant | # 1 sec bins | Bins with >0 counts | Bins with >2000 counts | High rate bins dominated by noise | Noise dominated (total time) | Noise dominated (detector-on time) | Marked lightcurve |
|---|---|---|---|---|---|---|---|
| A | 7730 | 6461 | 0 | 0 | 0.00% | 0.00% | 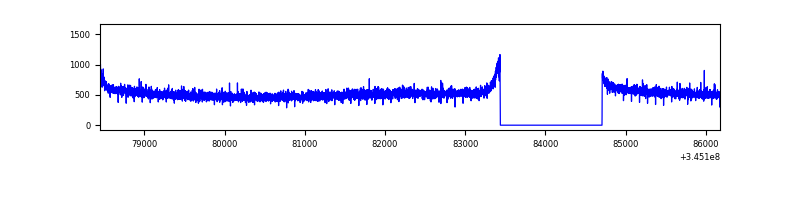 |
| B | 7730 | 6461 | 2 | 2 | 0.03% | 0.03% | 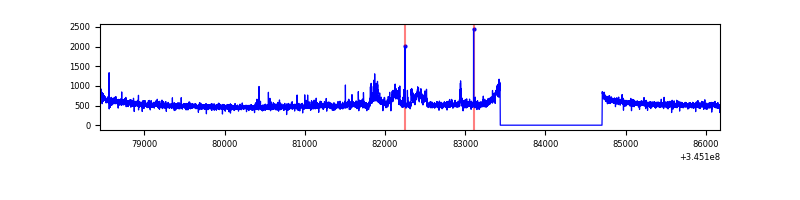 |
| C | 7730 | 6461 | 5 | 5 | 0.06% | 0.08% | 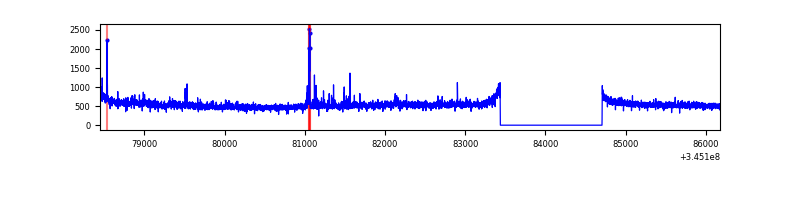 |
| D | 7729 | 6460 | 338 | 338 | 4.37% | 5.23% | 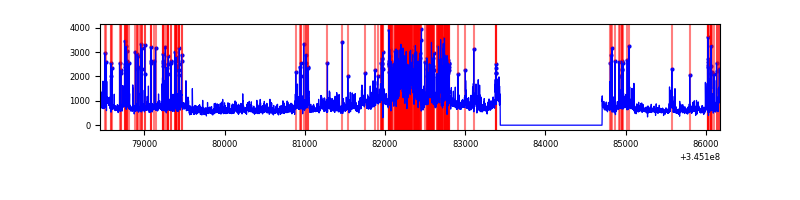 |
Top three noisy pixels from each quadrant. If the there are fewer than three noisy pixels in the level2.evt file, extra rows are filled as -1
| Pixel properties | Quadrant properties | ||||||
|---|---|---|---|---|---|---|---|
| Quadrant | DetID | PixID | Counts | Sigma | Mean | Median | Sigma |
| A | 13 | 254 | 11184 | 59.85 | 872 | 856 | 172.6 |
| A | 0 | 226 | 7612 | 39.15 | 872 | 856 | 172.6 |
| A | 3 | 137 | 7555 | 38.82 | 872 | 856 | 172.6 |
| B | 15 | 32 | 126083 | 792.47 | 853 | 835 | 158.0 |
| B | 12 | 111 | 19034 | 115.15 | 853 | 835 | 158.0 |
| B | 11 | 111 | 17430 | 105.0 | 853 | 835 | 158.0 |
| C | 3 | 233 | 142294 | 750.27 | 818 | 826 | 188.6 |
| C | 14 | 238 | 135113 | 712.19 | 818 | 826 | 188.6 |
| C | 2 | 16 | 9546 | 46.25 | 818 | 826 | 188.6 |
| D | 7 | 223 | 1386578 | 7395.84 | 803 | 784 | 187.4 |
| D | 1 | 52 | 861528 | 4593.7 | 803 | 784 | 187.4 |
| D | 8 | 195 | 425033 | 2264.17 | 803 | 784 | 187.4 |
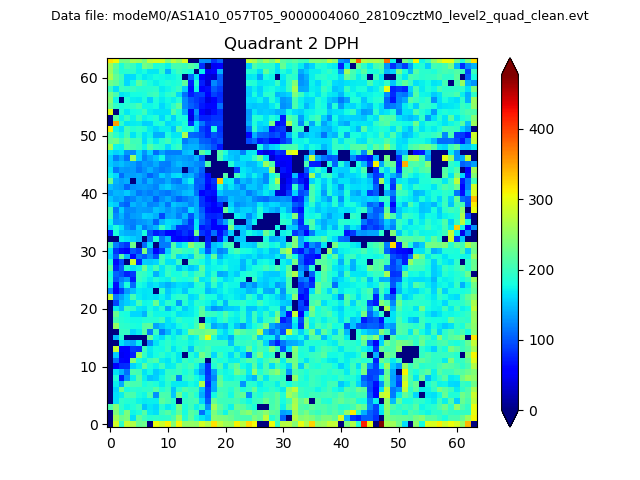
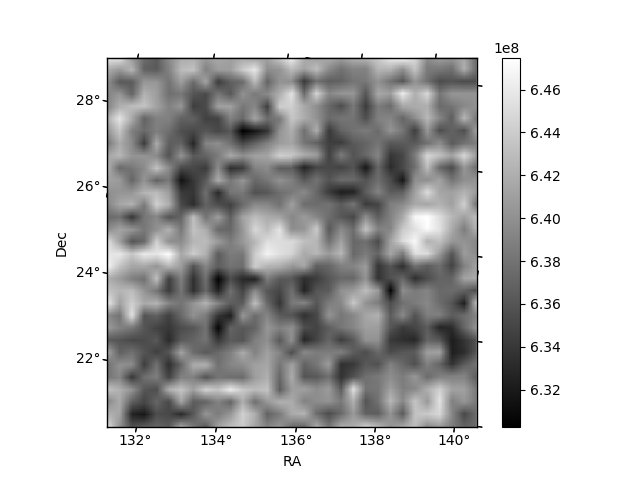
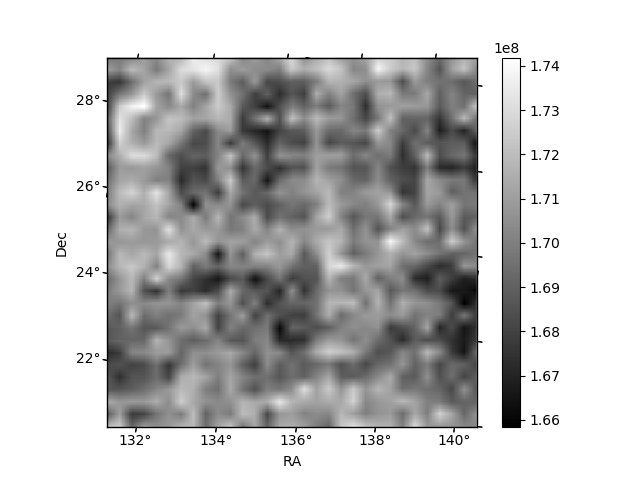
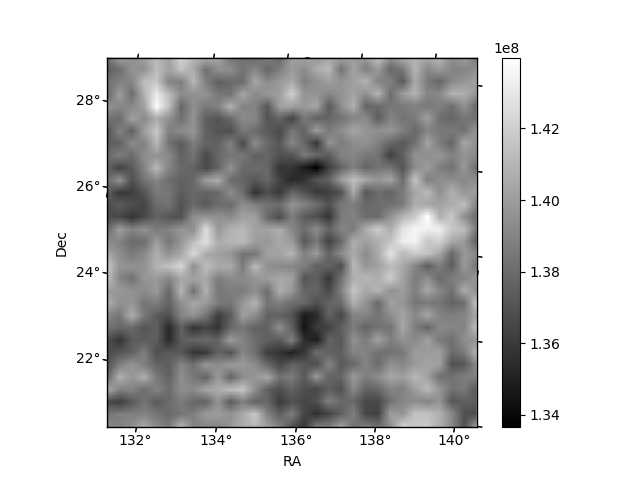
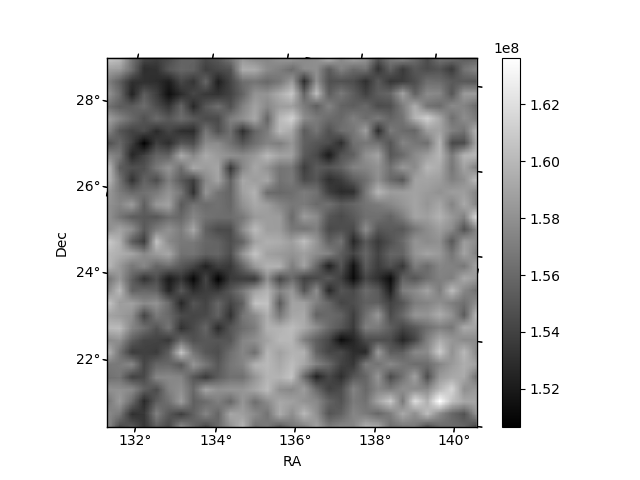
Histogram calculated using DETX and DETY for each event in the final _common_clean file
| Quadrant A | 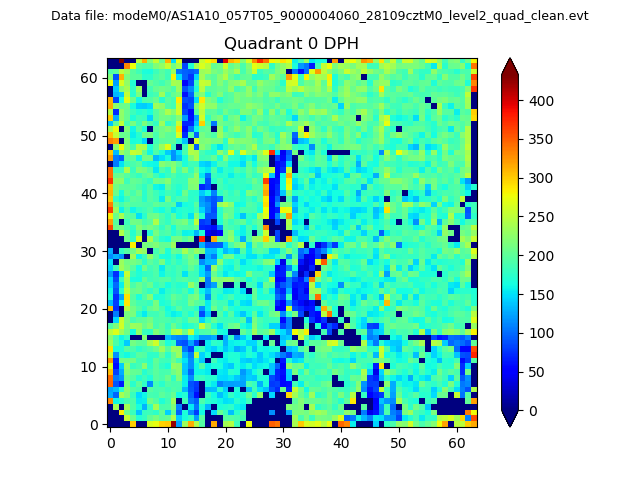 |
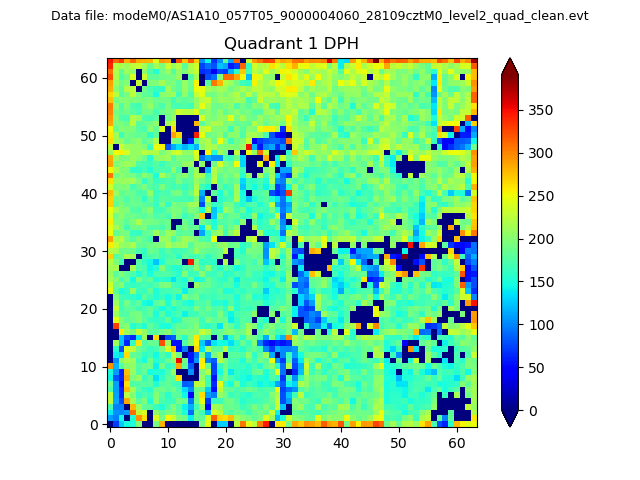 |
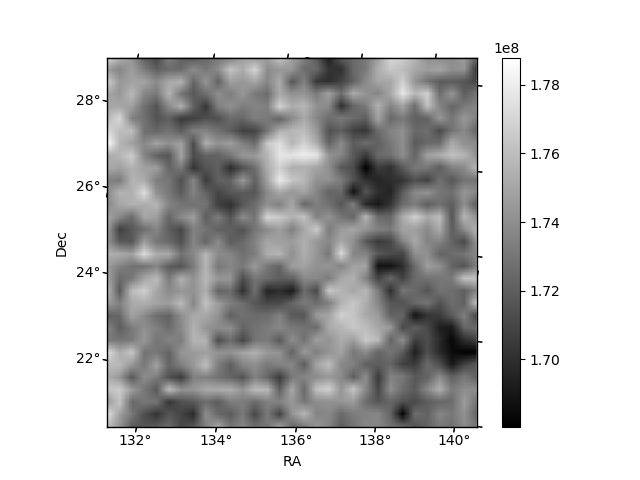
Quadrant B |
|---|---|---|---|
| Quadrant D | 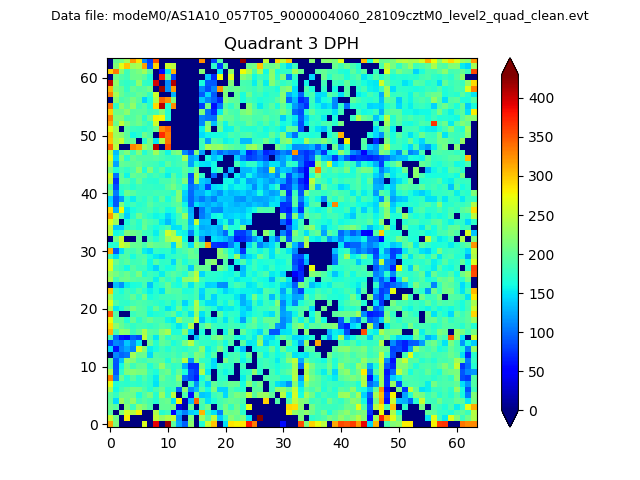 |
 |
Quadrant C |
| Plot type | Count rate plots | Images |
|---|---|---|
| Comparison with Poisson distribution Blue bars denote a histogram of data divided into 1 sec bins. Red curve is a Poisson curve with rate = median count rate of data. |
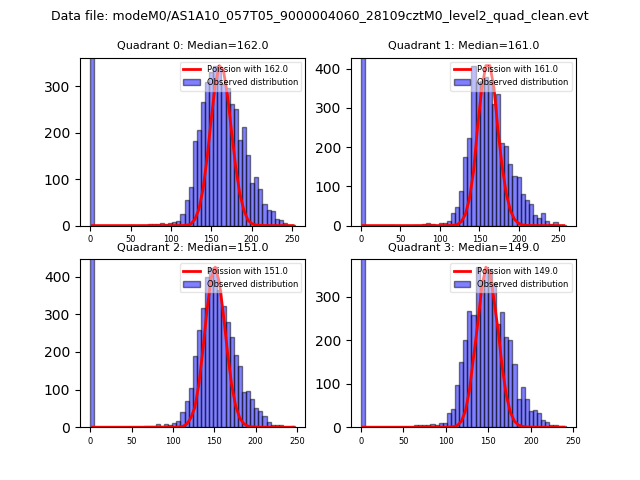 |
 |
| Quadrant-wise count rates Data is divided into 100 sec bins |
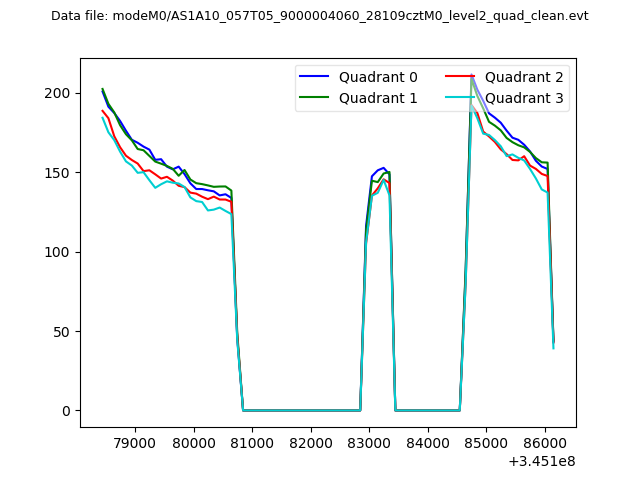 |
|
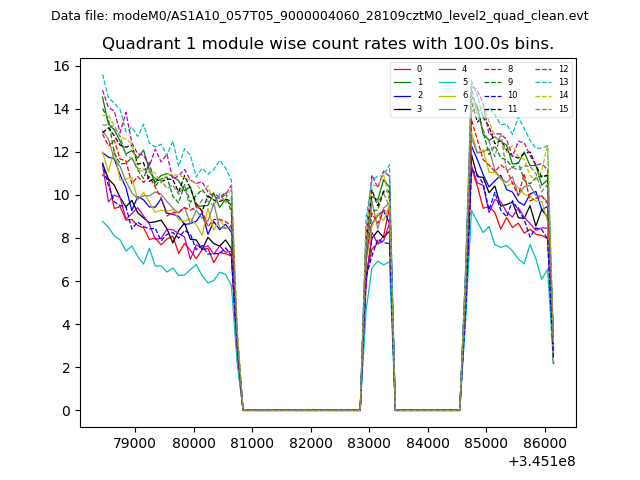
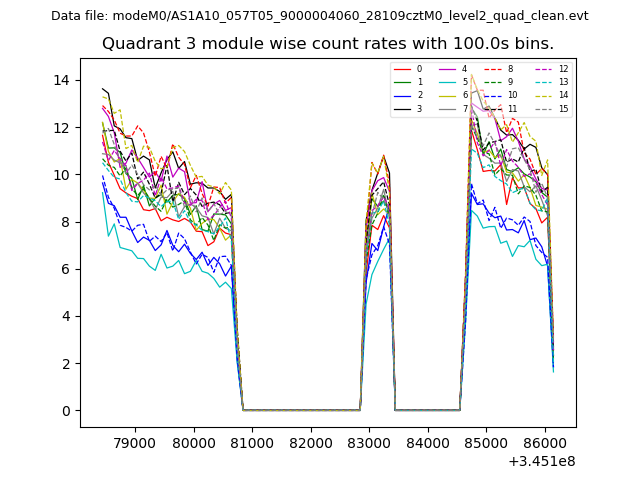
| Module-wise count rates for Quadrant A Data is divided into 100 sec bins |
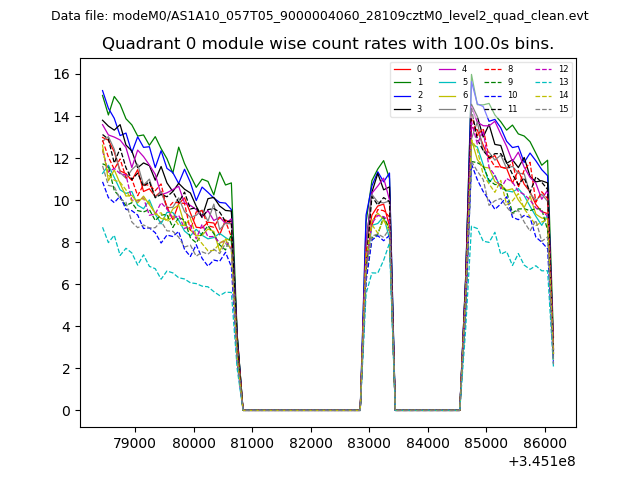 |
 |
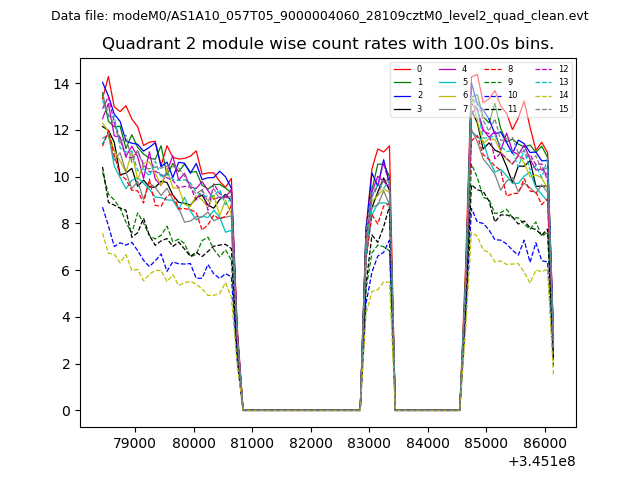
| Module-wise count rates for Quadrant B Data is divided into 100 sec bins |
 |
 |
| Module-wise count rates for Quadrant C Data is divided into 100 sec bins |
 |
 |
| Module-wise count rates for Quadrant D Data is divided into 100 sec bins |
 |
 |
| Parameter | Plot |
|---|---|
| CZT HV Monitor | 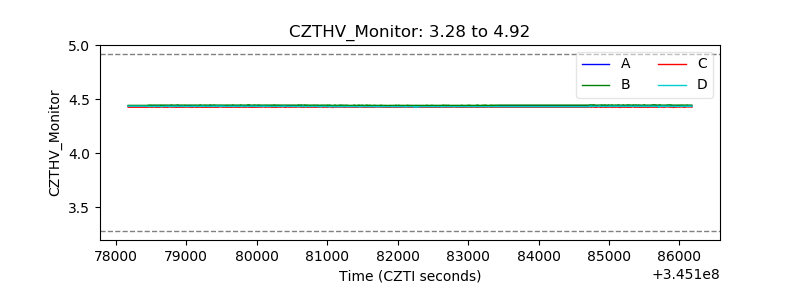 |
| D_VDD | 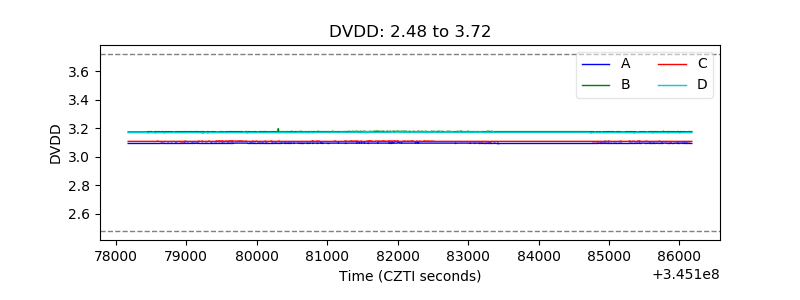 |
| Temperature 1 | 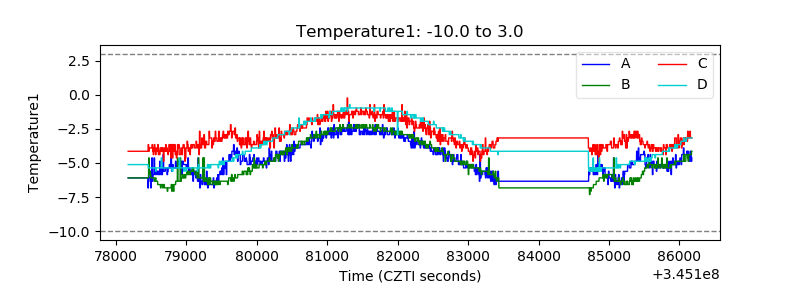 |
| Veto HV Monitor | 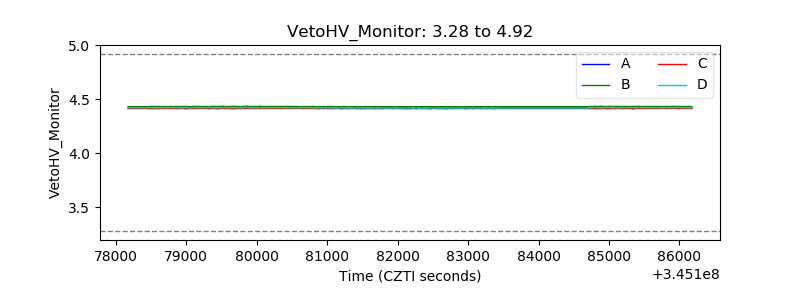 |
| Veto LLD | 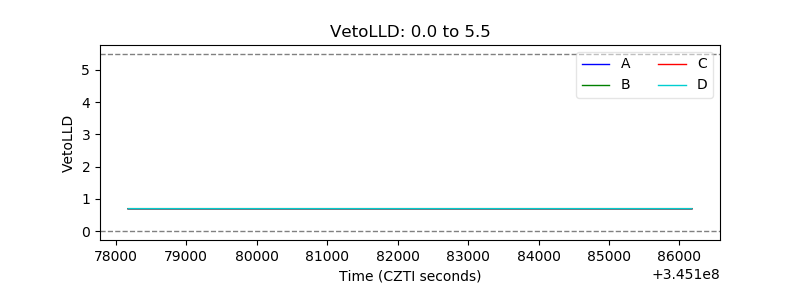 |
| Alpha Counter | 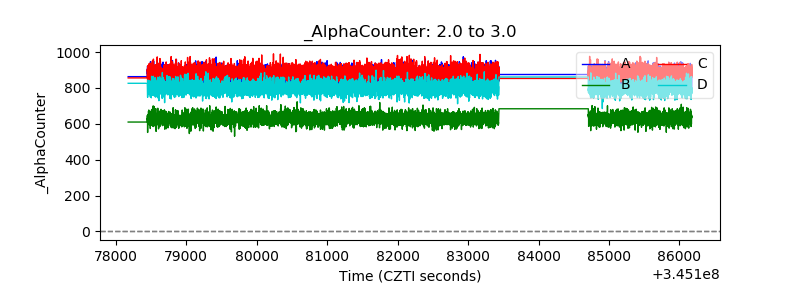 |
| _CPM_Rate | 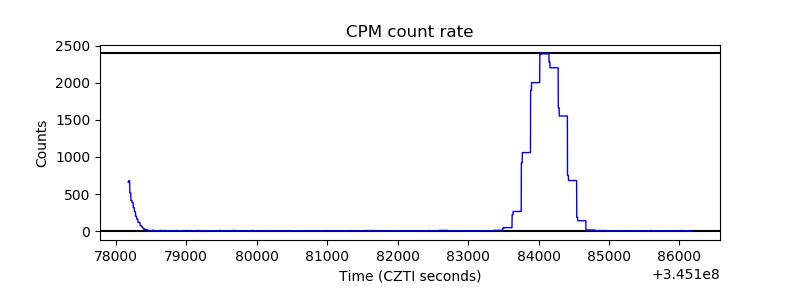 |
| CZT Counter | 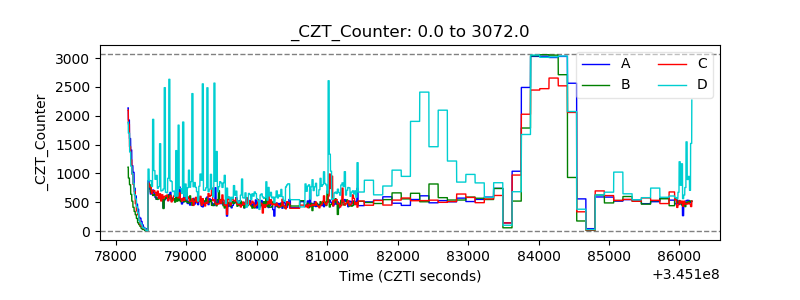 |
| +2.5 Volts monitor |  |
| +5 Volts monitor |  |
| _ROLL_ROT | 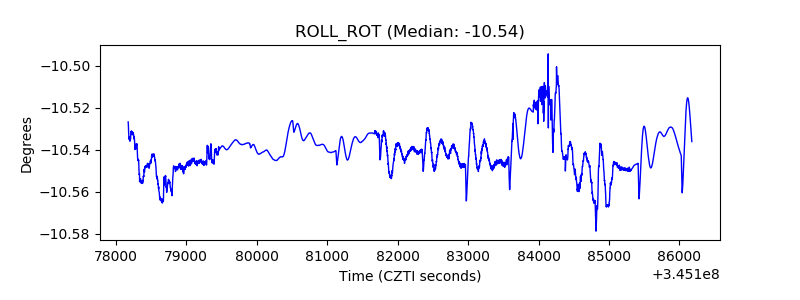 |
| _Roll_DEC | 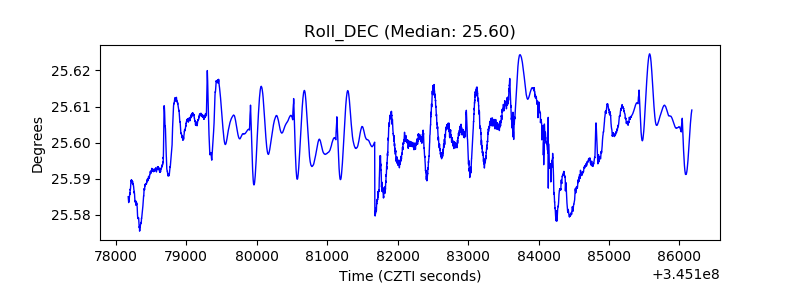 |
| _Roll_RA | 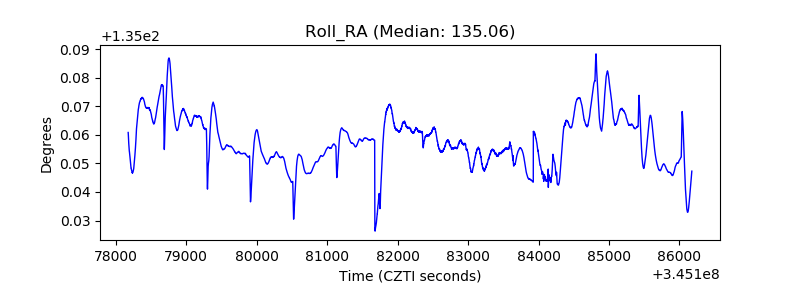 |
| Veto Counter | 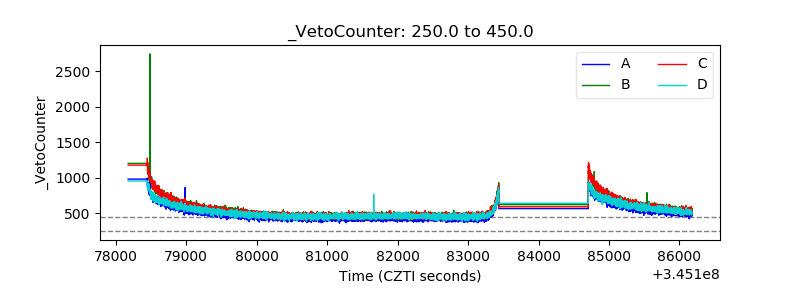 |