| Param | Original file | Final file |
|---|---|---|
| Filename | modeM0/AS1A10_057T05_9000004060_28110cztM0_level2.evt | modeM0/AS1A10_057T05_9000004060_28110cztM0_level2_quad_clean.evt |
| Size (bytes) | 545,693,760 | 102,162,240 |
| Size | 520.4 MB | 97.4 MB |
| Events in quadrant A | 3,367,706 | 692,095 |
| Events in quadrant B | 3,357,910 | 686,096 |
| Events in quadrant C | 3,484,431 | 648,756 |
| Events in quadrant D | 5,891,578 | 629,173 |
| Mode M0 | |||
|---|---|---|---|
| Quadrant | BADHDUFLAG | Total packets | Discarded packets |
| A | 0 | 13470 | 0 |
| B | 0 | 13467 | 0 |
| C | 0 | 13995 | 0 |
| D | 0 | 22114 | 0 |
| Mode M9 | |||
|---|---|---|---|
| Quadrant | BADHDUFLAG | Total packets | Discarded packets |
| A | 0 | 13 | 0 |
| B | 0 | 13 | 0 |
| C | 0 | 13 | 0 |
| D | 0 | 13 | 0 |
| Quadrant | Total seconds | Saturated seconds | Saturation percentage |
|---|---|---|---|
| A | 6271 | 48 | 0.765428% |
| B | 6271 | 72 | 1.148142% |
| C | 6272 | 83 | 1.323342% |
| D | 6272 | 338 | 5.389031% |
Noise dominated data is calculated using 1-second bins in cleaned event files. If a bin has >2000 counts, and if more than 50% of those come from <1% of pixels, then it is considered to be noise-dominated and hence unusable.
| Quadrant | # 1 sec bins | Bins with >0 counts | Bins with >2000 counts | High rate bins dominated by noise | Noise dominated (total time) | Noise dominated (detector-on time) | Marked lightcurve |
|---|---|---|---|---|---|---|---|
| A | 7571 | 6272 | 0 | 0 | 0.00% | 0.00% | 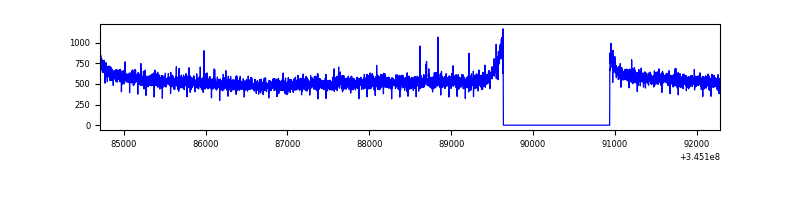 |
| B | 7571 | 6272 | 3 | 3 | 0.04% | 0.05% | 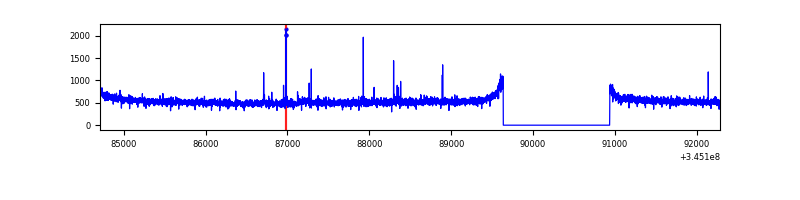 |
| C | 7572 | 6273 | 0 | 0 | 0.00% | 0.00% | 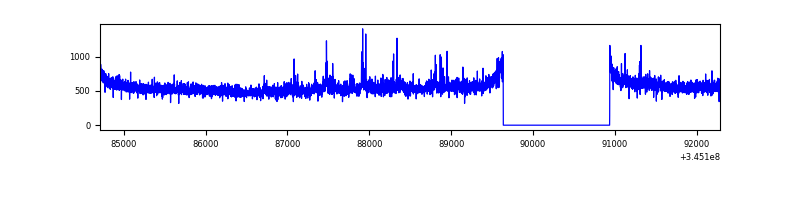 |
| D | 7572 | 6273 | 291 | 291 | 3.84% | 4.64% | 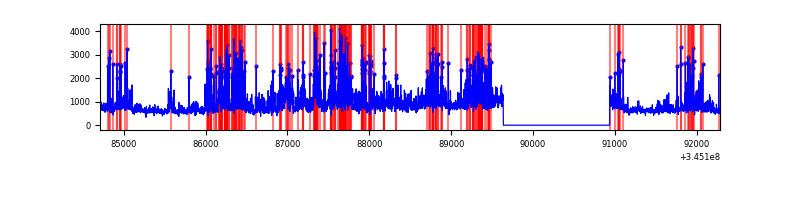 |
Top three noisy pixels from each quadrant. If the there are fewer than three noisy pixels in the level2.evt file, extra rows are filled as -1
| Pixel properties | Quadrant properties | ||||||
|---|---|---|---|---|---|---|---|
| Quadrant | DetID | PixID | Counts | Sigma | Mean | Median | Sigma |
| A | 13 | 254 | 10164 | 54.08 | 871 | 857 | 172.1 |
| A | 3 | 137 | 7546 | 38.87 | 871 | 857 | 172.1 |
| A | 0 | 226 | 7480 | 38.49 | 871 | 857 | 172.1 |
| B | 15 | 32 | 19850 | 120.03 | 845 | 826 | 158.5 |
| B | 12 | 111 | 18550 | 111.83 | 845 | 826 | 158.5 |
| B | 11 | 111 | 17089 | 102.61 | 845 | 826 | 158.5 |
| C | 3 | 233 | 159947 | 844.97 | 816 | 823 | 188.3 |
| C | 14 | 238 | 134519 | 709.94 | 816 | 823 | 188.3 |
| C | 15 | 208 | 6242 | 28.78 | 816 | 823 | 188.3 |
| D | 7 | 223 | 1209695 | 6272.97 | 820 | 802 | 192.7 |
| D | 1 | 52 | 1003452 | 5202.77 | 820 | 802 | 192.7 |
| D | 8 | 195 | 358708 | 1857.18 | 820 | 802 | 192.7 |
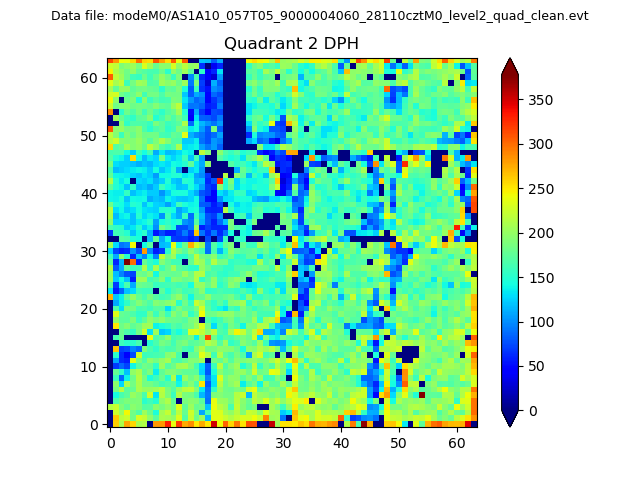
Histogram calculated using DETX and DETY for each event in the final _common_clean file
| Quadrant A | 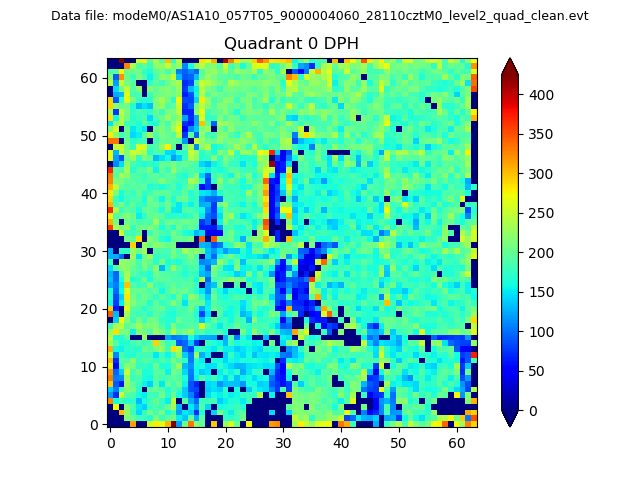 |
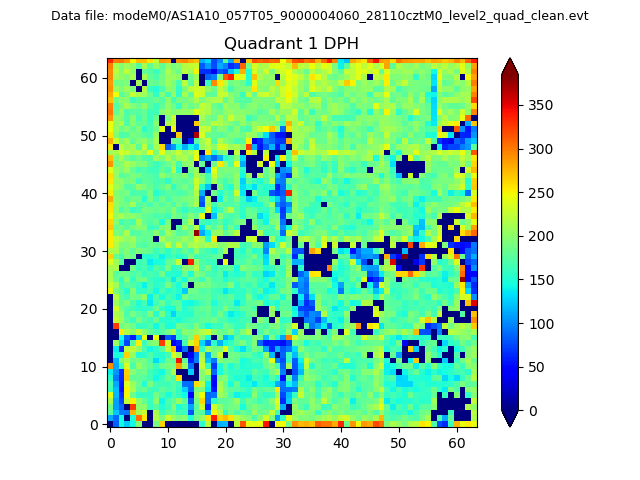 |
Quadrant B |
|---|---|---|---|
| Quadrant D | 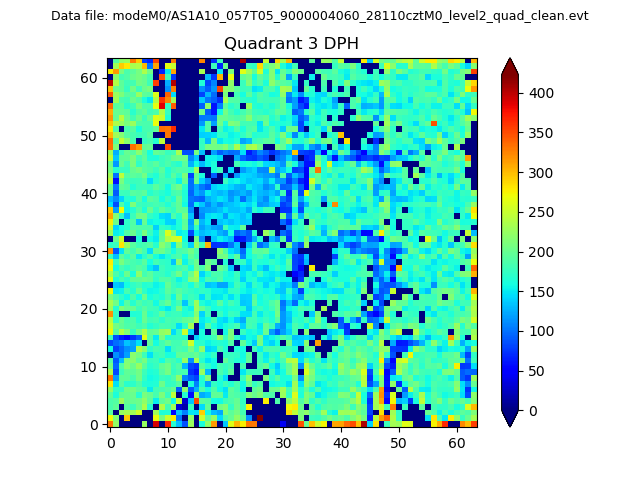 |
 |
Quadrant C |
| Plot type | Count rate plots | Images |
|---|---|---|
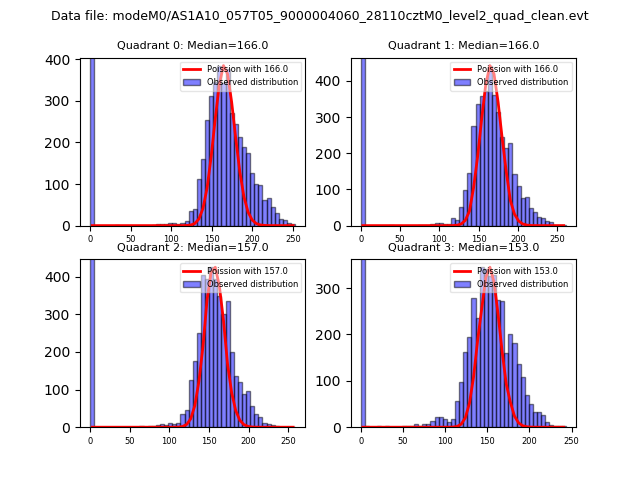
| Comparison with Poisson distribution Blue bars denote a histogram of data divided into 1 sec bins. Red curve is a Poisson curve with rate = median count rate of data. |
 |
 |
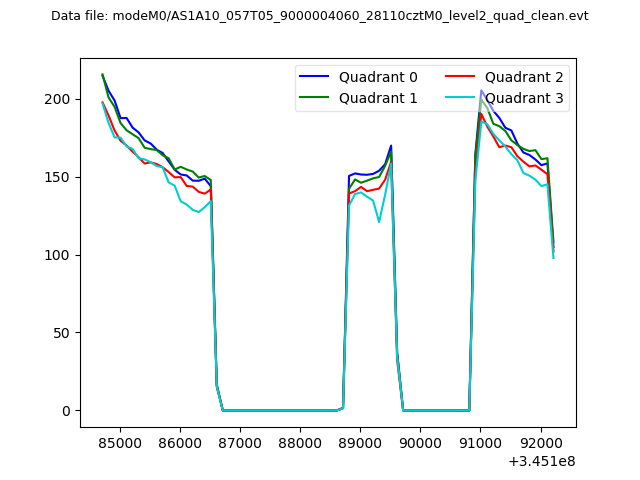
| Quadrant-wise count rates Data is divided into 100 sec bins |
 |
|
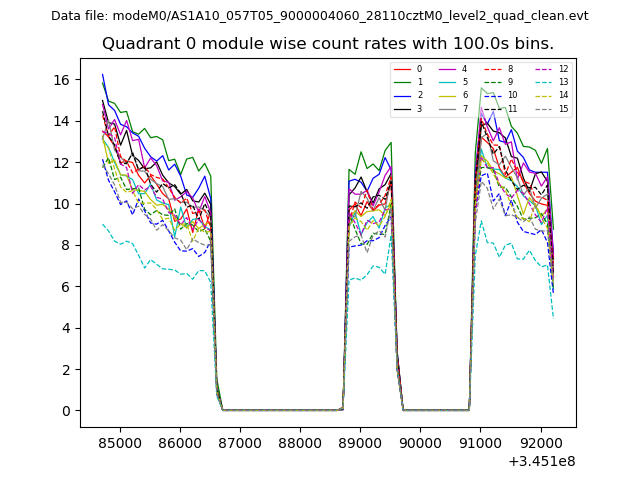
| Module-wise count rates for Quadrant A Data is divided into 100 sec bins |
 |
 |
| Module-wise count rates for Quadrant B Data is divided into 100 sec bins |
 |
 |
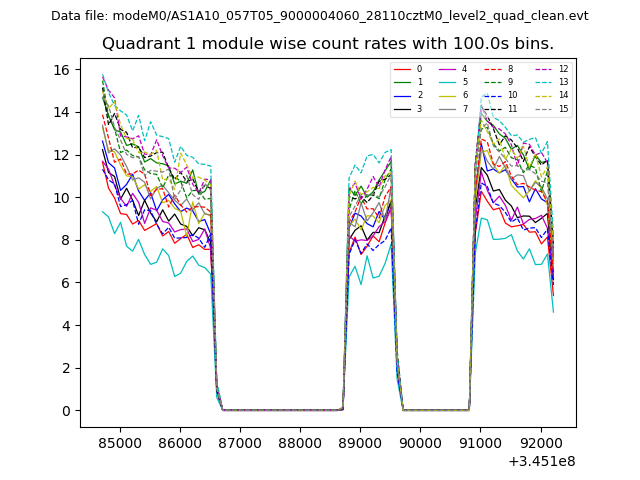
| Module-wise count rates for Quadrant C Data is divided into 100 sec bins |
 |
 |
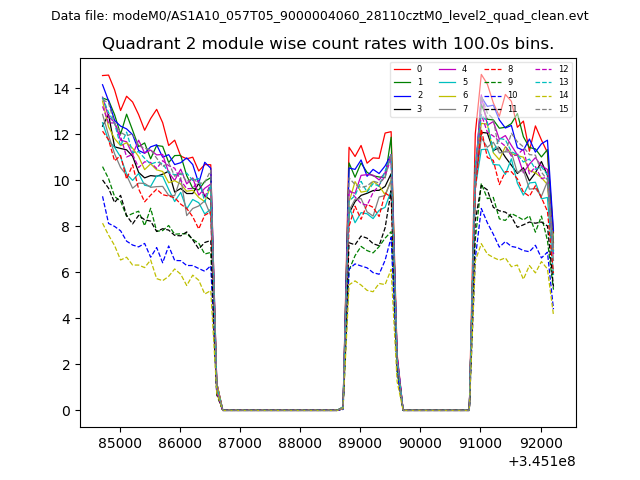
| Module-wise count rates for Quadrant D Data is divided into 100 sec bins |
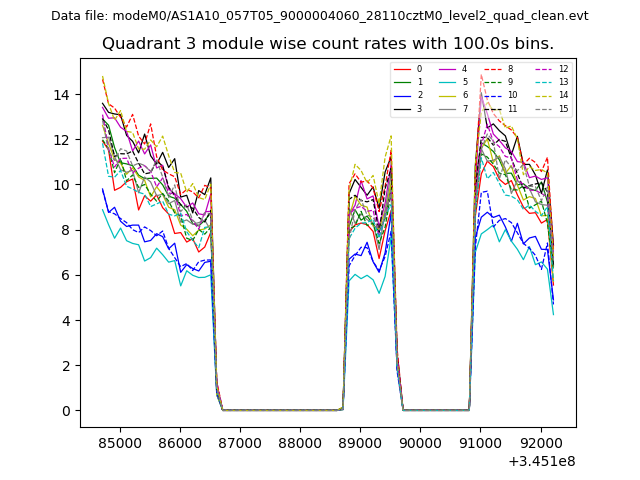 |
 |
| Parameter | Plot |
|---|---|
| CZT HV Monitor | 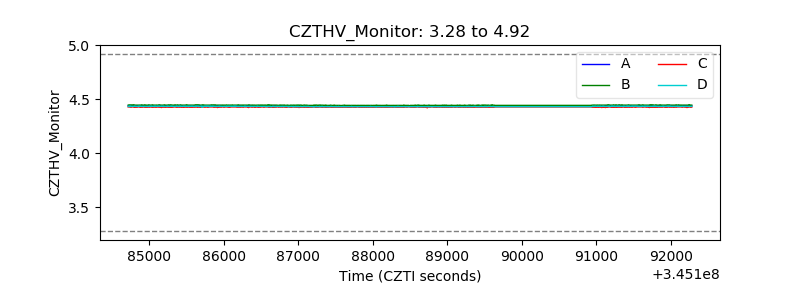 |
| D_VDD |  |
| Temperature 1 | 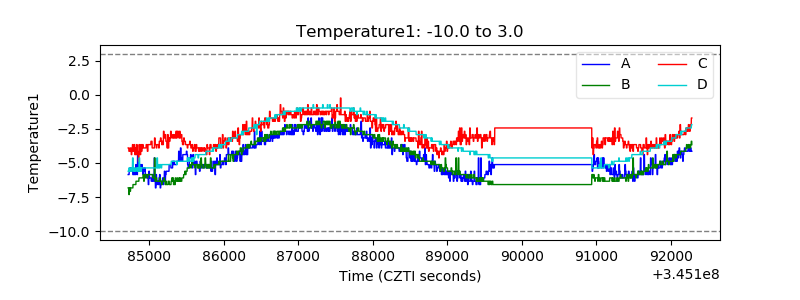 |
| Veto HV Monitor | 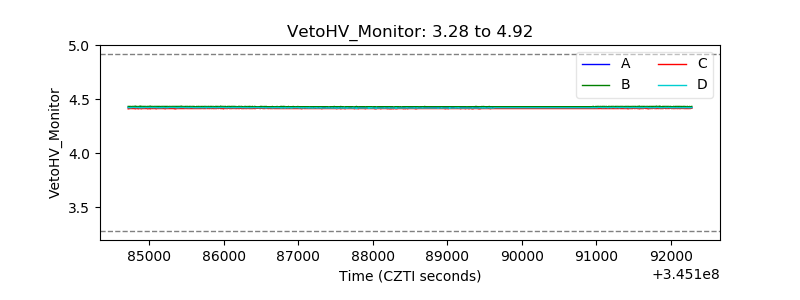 |
| Veto LLD | 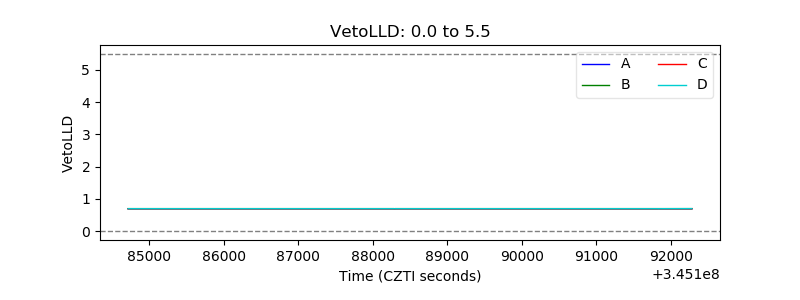 |
| Alpha Counter | 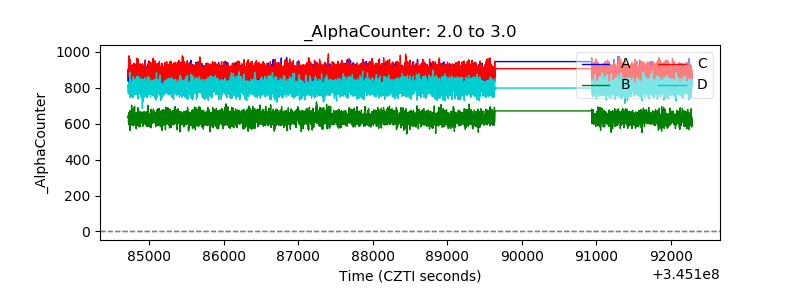 |
| _CPM_Rate | 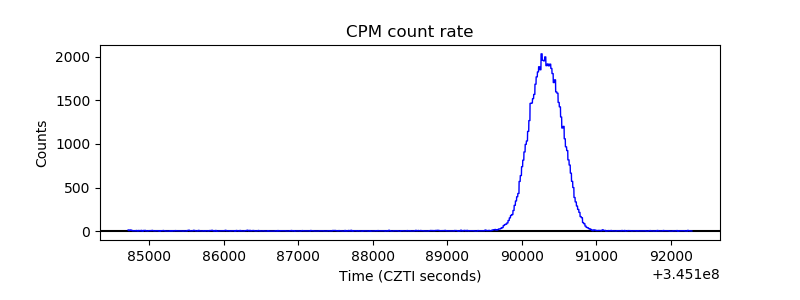 |
| CZT Counter | 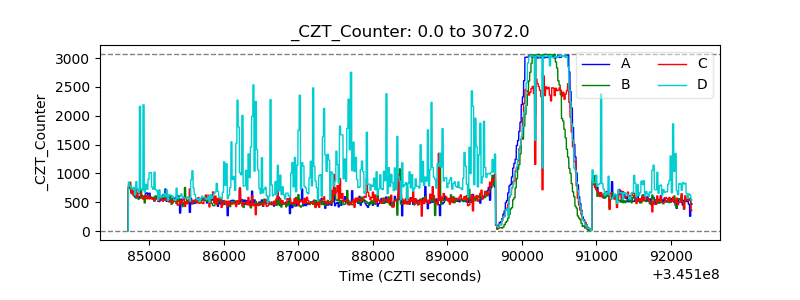 |
| +2.5 Volts monitor |  |
| +5 Volts monitor |  |
| _ROLL_ROT | 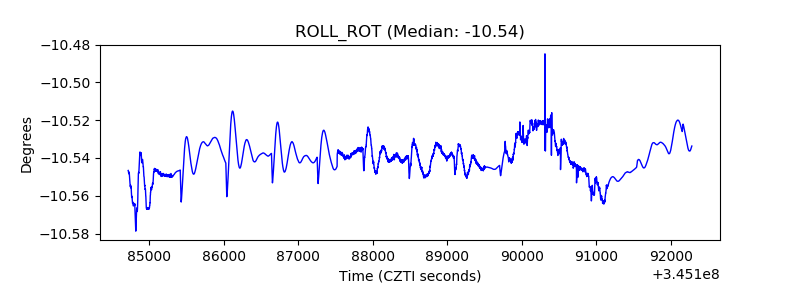 |
| _Roll_DEC | 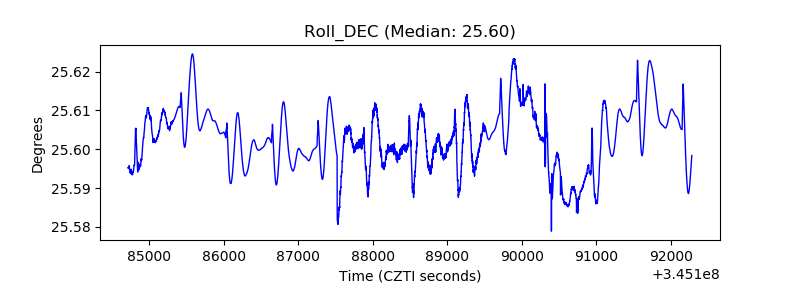 |
| _Roll_RA |  |
| Veto Counter | 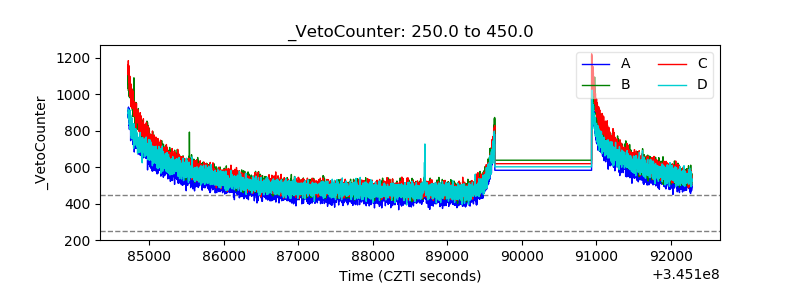 |