| Param | Original file | Final file |
|---|---|---|
| Filename | modeM0/AS1A10_057T05_9000004060_28111cztM0_level2.evt | modeM0/AS1A10_057T05_9000004060_28111cztM0_level2_quad_clean.evt |
| Size (bytes) | 524,142,720 | 85,662,720 |
| Size | 499.9 MB | 81.7 MB |
| Events in quadrant A | 3,116,364 | 565,126 |
| Events in quadrant B | 3,171,511 | 563,942 |
| Events in quadrant C | 3,283,111 | 535,217 |
| Events in quadrant D | 5,903,978 | 518,389 |
| Mode M0 | |||
|---|---|---|---|
| Quadrant | BADHDUFLAG | Total packets | Discarded packets |
| A | 0 | 12383 | 0 |
| B | 0 | 12614 | 0 |
| C | 0 | 13081 | 0 |
| D | 0 | 21808 | 0 |
| Mode M9 | |||
|---|---|---|---|
| Quadrant | BADHDUFLAG | Total packets | Discarded packets |
| A | 0 | 13 | 0 |
| B | 0 | 13 | 0 |
| C | 0 | 13 | 0 |
| D | 0 | 13 | 0 |
| Quadrant | Total seconds | Saturated seconds | Saturation percentage |
|---|---|---|---|
| A | 5887 | 77 | 1.307967% |
| B | 5888 | 89 | 1.511549% |
| C | 5888 | 101 | 1.715353% |
| D | 5887 | 416 | 7.066418% |
Noise dominated data is calculated using 1-second bins in cleaned event files. If a bin has >2000 counts, and if more than 50% of those come from <1% of pixels, then it is considered to be noise-dominated and hence unusable.
| Quadrant | # 1 sec bins | Bins with >0 counts | Bins with >2000 counts | High rate bins dominated by noise | Noise dominated (total time) | Noise dominated (detector-on time) | Marked lightcurve |
|---|---|---|---|---|---|---|---|
| A | 7162 | 5887 | 1 | 1 | 0.01% | 0.02% | 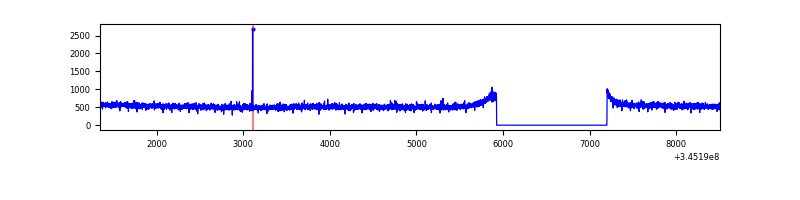 |
| B | 7163 | 5889 | 0 | 0 | 0.00% | 0.00% | 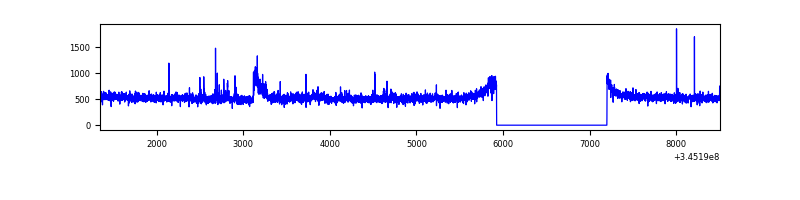 |
| C | 7163 | 5888 | 3 | 3 | 0.04% | 0.05% |  |
| D | 7162 | 5887 | 265 | 265 | 3.70% | 4.50% | 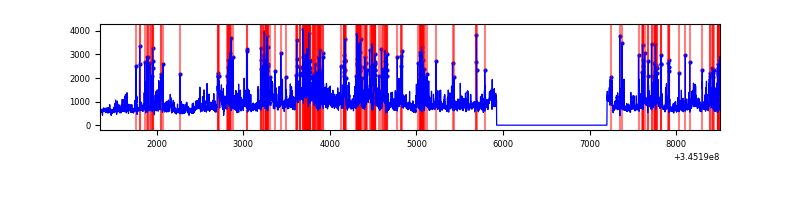 |
Top three noisy pixels from each quadrant. If the there are fewer than three noisy pixels in the level2.evt file, extra rows are filled as -1
| Pixel properties | Quadrant properties | ||||||
|---|---|---|---|---|---|---|---|
| Quadrant | DetID | PixID | Counts | Sigma | Mean | Median | Sigma |
| A | 13 | 254 | 9375 | 53.6 | 807 | 792 | 160.1 |
| A | 3 | 137 | 7274 | 40.48 | 807 | 792 | 160.1 |
| A | 0 | 226 | 6909 | 38.2 | 807 | 792 | 160.1 |
| B | 15 | 32 | 63342 | 426.19 | 784 | 766 | 146.8 |
| B | 12 | 111 | 17645 | 114.96 | 784 | 766 | 146.8 |
| B | 11 | 111 | 16021 | 103.9 | 784 | 766 | 146.8 |
| C | 3 | 233 | 193124 | 1105.48 | 759 | 767 | 174.0 |
| C | 14 | 238 | 125139 | 714.77 | 759 | 767 | 174.0 |
| C | 13 | 61 | 5143 | 25.15 | 759 | 767 | 174.0 |
| D | 7 | 223 | 1419247 | 7935.78 | 762 | 745 | 178.7 |
| D | 1 | 52 | 992934 | 5550.78 | 762 | 745 | 178.7 |
| D | 8 | 195 | 300208 | 1675.34 | 762 | 745 | 178.7 |
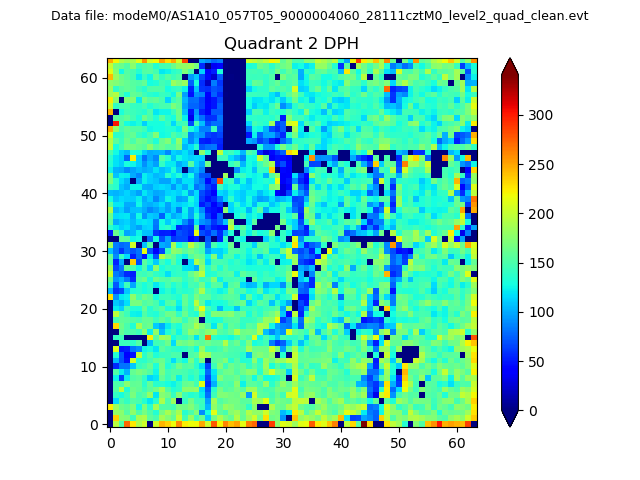
Histogram calculated using DETX and DETY for each event in the final _common_clean file
| Quadrant A | 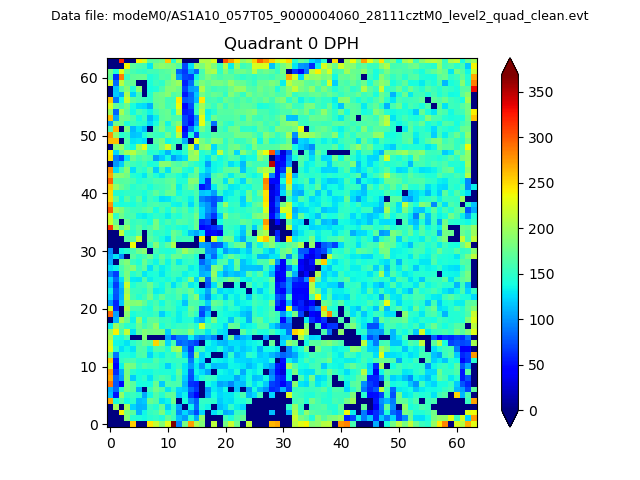 |
 |
Quadrant B |
|---|---|---|---|
| Quadrant D | 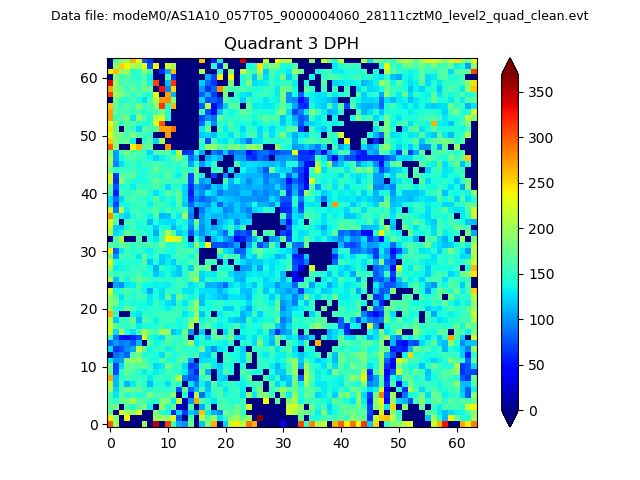 |
 |
Quadrant C |
| Plot type | Count rate plots | Images |
|---|---|---|
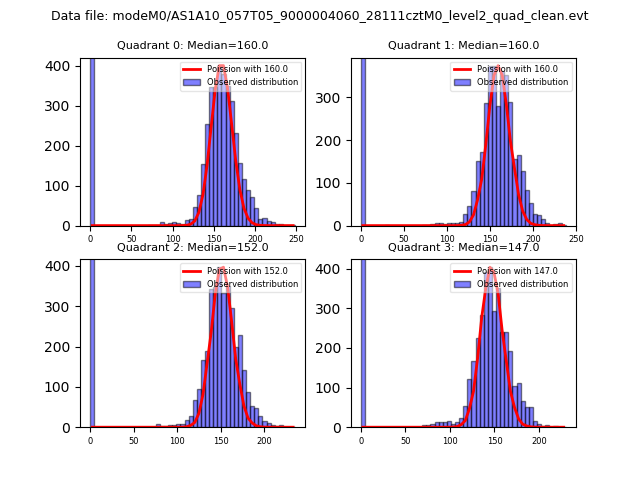
| Comparison with Poisson distribution Blue bars denote a histogram of data divided into 1 sec bins. Red curve is a Poisson curve with rate = median count rate of data. |
 |
 |
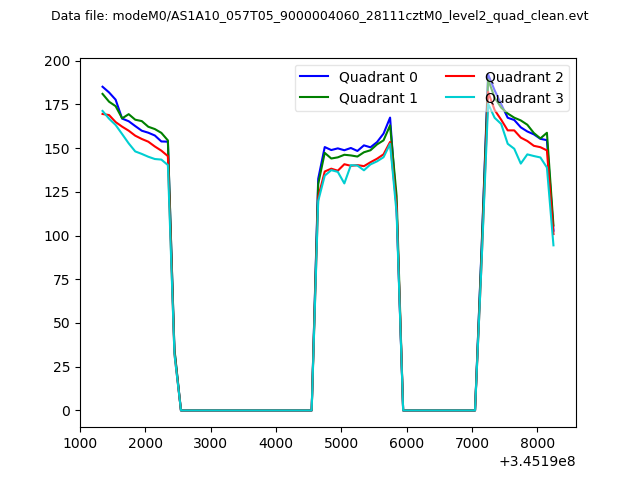
| Quadrant-wise count rates Data is divided into 100 sec bins |
 |
|
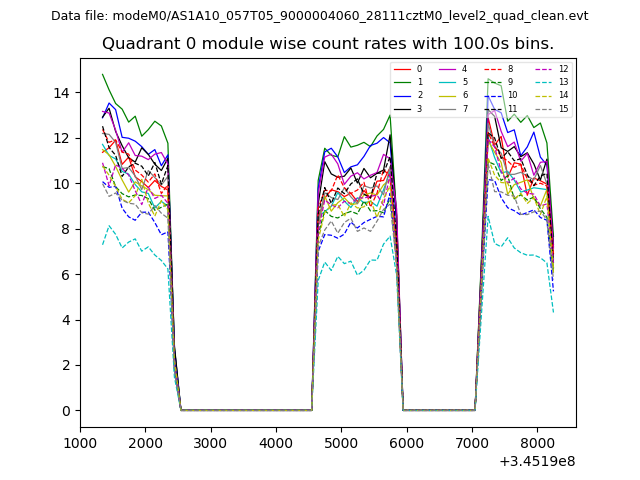
| Module-wise count rates for Quadrant A Data is divided into 100 sec bins |
 |
 |
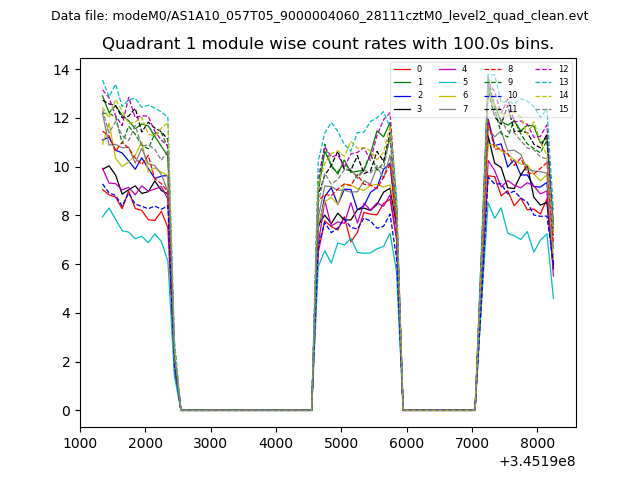
| Module-wise count rates for Quadrant B Data is divided into 100 sec bins |
 |
 |
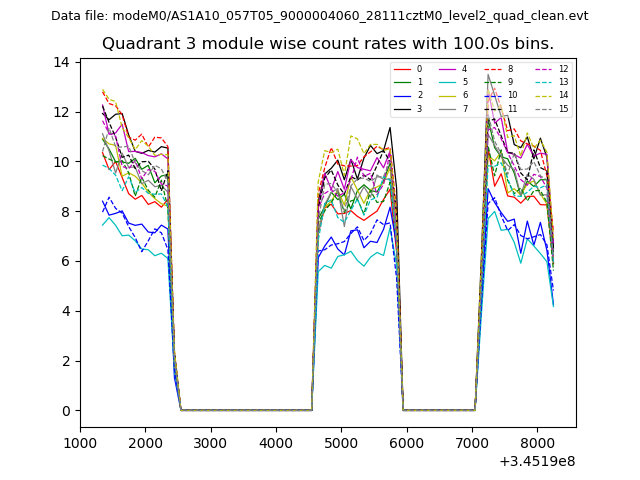
| Module-wise count rates for Quadrant C Data is divided into 100 sec bins |
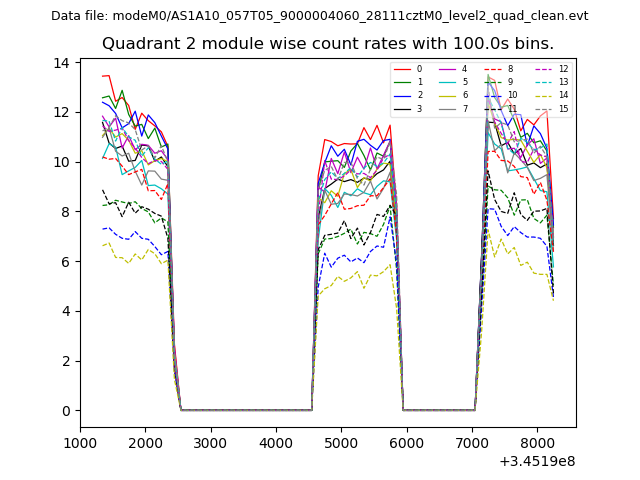 |
 |
| Module-wise count rates for Quadrant D Data is divided into 100 sec bins |
 |
 |
| Parameter | Plot |
|---|---|
| CZT HV Monitor | 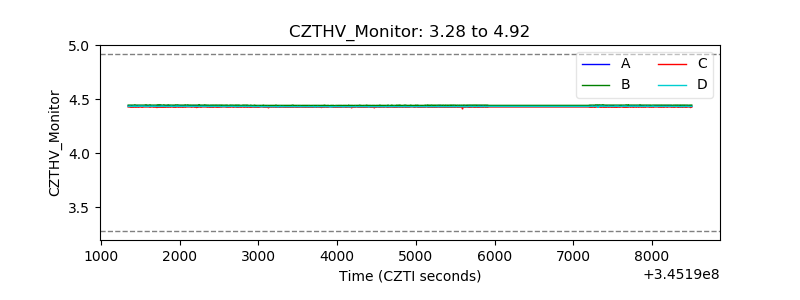 |
| D_VDD | 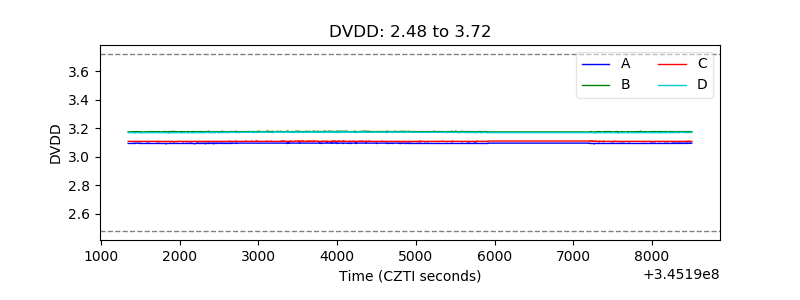 |
| Temperature 1 | 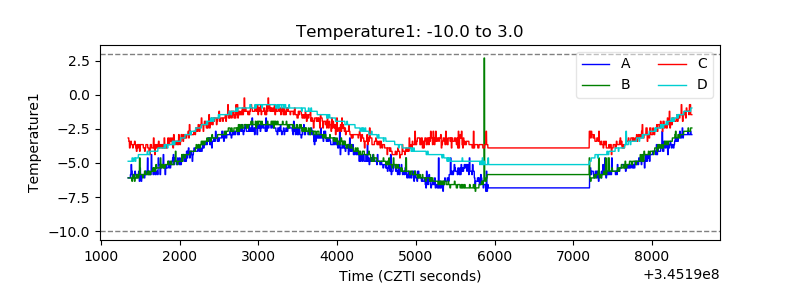 |
| Veto HV Monitor | 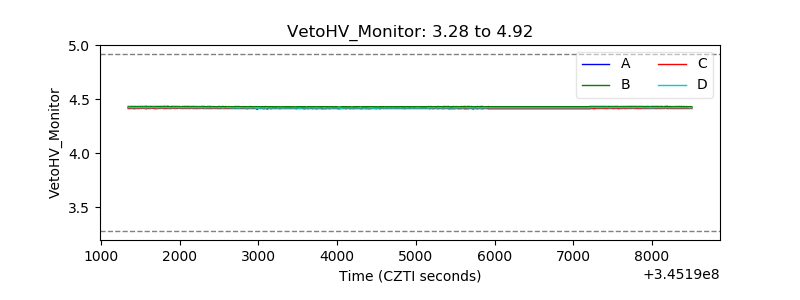 |
| Veto LLD | 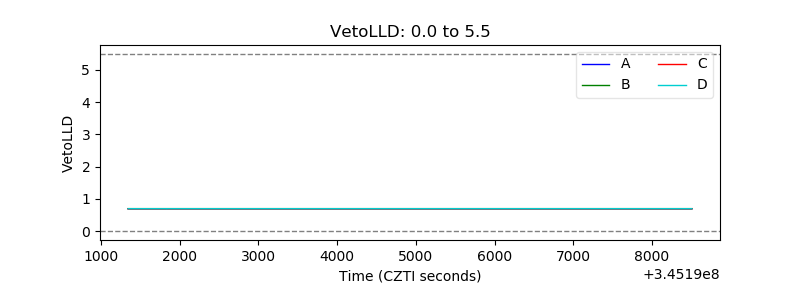 |
| Alpha Counter | 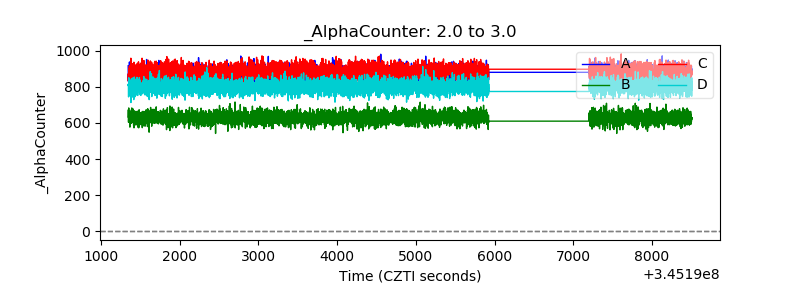 |
| _CPM_Rate | 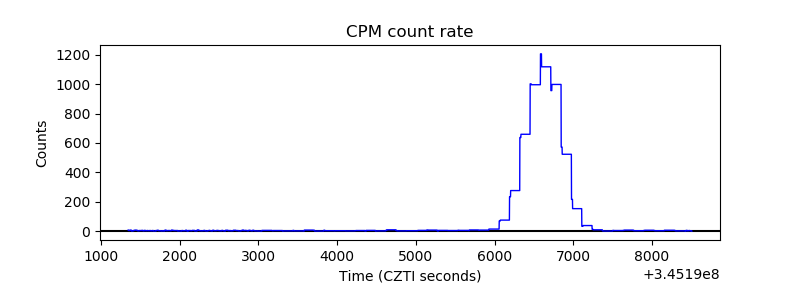 |
| CZT Counter | 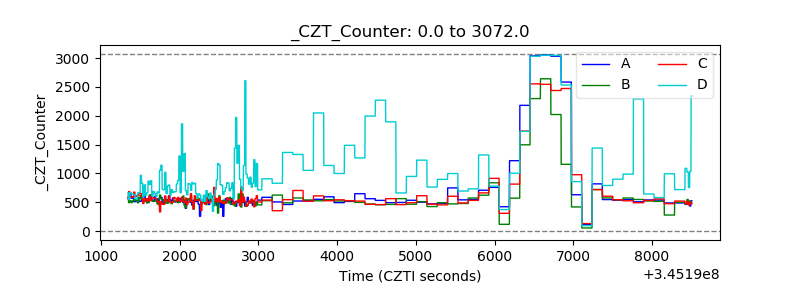 |
| +2.5 Volts monitor |  |
| +5 Volts monitor | 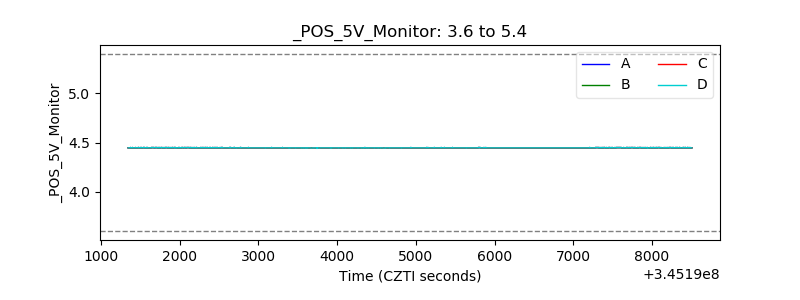 |
| _ROLL_ROT | 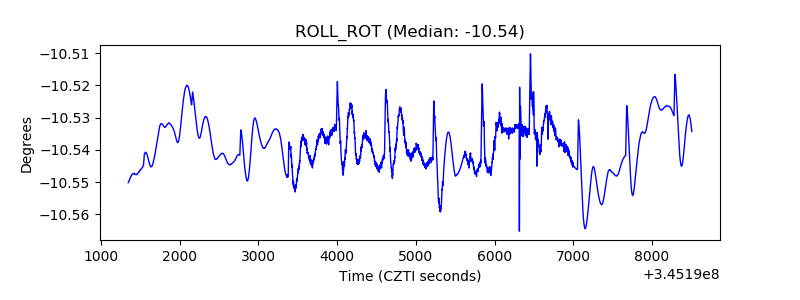 |
| _Roll_DEC | 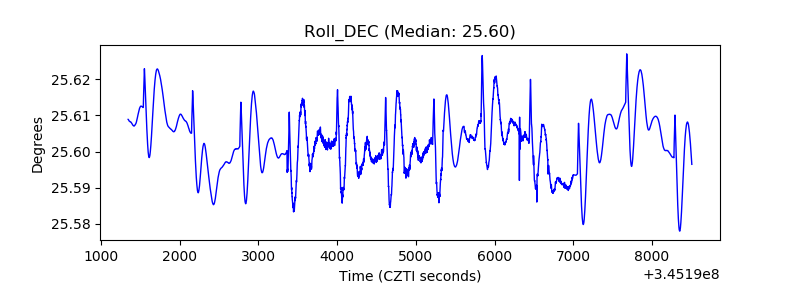 |
| _Roll_RA | 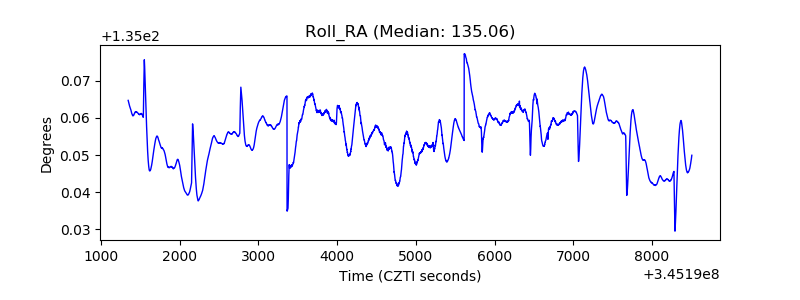 |
| Veto Counter | 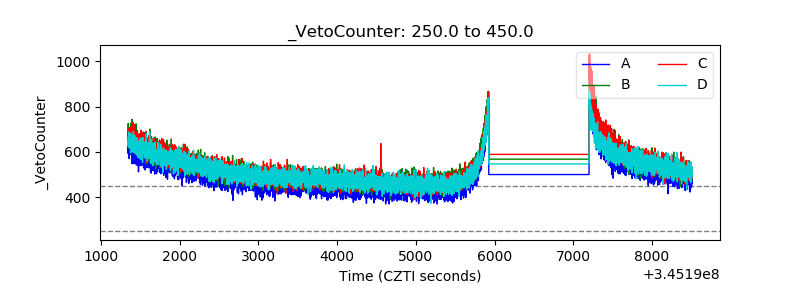 |