| Param | Original file | Final file |
|---|---|---|
| Filename | modeM0/AS1A10_057T05_9000004060_28112cztM0_level2.evt | modeM0/AS1A10_057T05_9000004060_28112cztM0_level2_quad_clean.evt |
| Size (bytes) | 524,692,800 | 78,387,840 |
| Size | 500.4 MB | 74.8 MB |
| Events in quadrant A | 3,167,177 | 501,372 |
| Events in quadrant B | 3,230,172 | 499,973 |
| Events in quadrant C | 3,236,097 | 476,329 |
| Events in quadrant D | 5,840,056 | 466,751 |
| Mode M0 | |||
|---|---|---|---|
| Quadrant | BADHDUFLAG | Total packets | Discarded packets |
| A | 0 | 12801 | 0 |
| B | 0 | 13036 | 0 |
| C | 0 | 13050 | 0 |
| D | 0 | 21782 | 0 |
| Mode M9 | |||
|---|---|---|---|
| Quadrant | BADHDUFLAG | Total packets | Discarded packets |
| A | 0 | 11 | 0 |
| B | 0 | 11 | 0 |
| C | 0 | 11 | 0 |
| D | 0 | 11 | 0 |
| Quadrant | Total seconds | Saturated seconds | Saturation percentage |
|---|---|---|---|
| A | 6144 | 133 | 2.164714% |
| B | 6144 | 140 | 2.278646% |
| C | 6145 | 161 | 2.620016% |
| D | 6144 | 444 | 7.226562% |
Noise dominated data is calculated using 1-second bins in cleaned event files. If a bin has >2000 counts, and if more than 50% of those come from <1% of pixels, then it is considered to be noise-dominated and hence unusable.
| Quadrant | # 1 sec bins | Bins with >0 counts | Bins with >2000 counts | High rate bins dominated by noise | Noise dominated (total time) | Noise dominated (detector-on time) | Marked lightcurve |
|---|---|---|---|---|---|---|---|
| A | 7230 | 6144 | 0 | 0 | 0.00% | 0.00% | 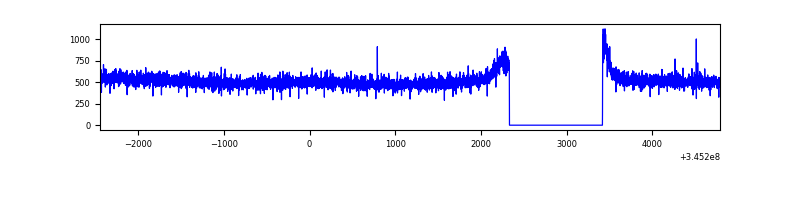 |
| B | 7230 | 6144 | 0 | 0 | 0.00% | 0.00% | 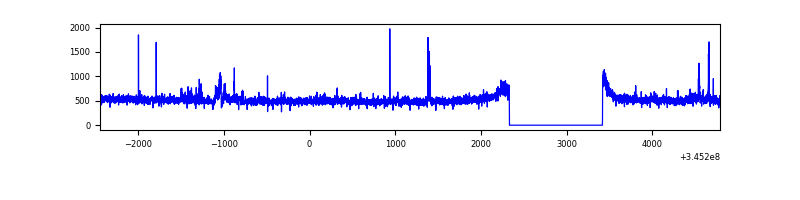 |
| C | 7231 | 6145 | 6 | 6 | 0.08% | 0.10% | 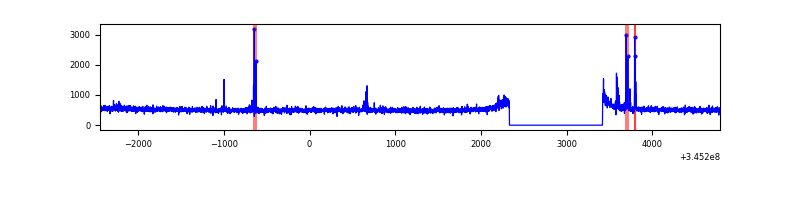 |
| D | 7230 | 6144 | 246 | 246 | 3.40% | 4.00% | 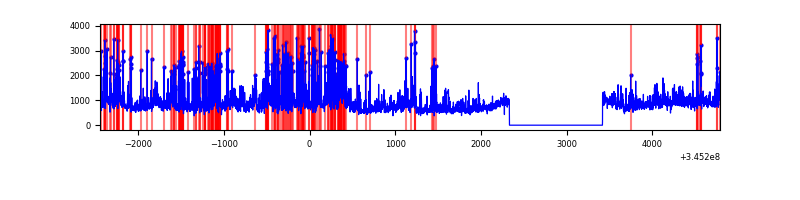 |
Top three noisy pixels from each quadrant. If the there are fewer than three noisy pixels in the level2.evt file, extra rows are filled as -1
| Pixel properties | Quadrant properties | ||||||
|---|---|---|---|---|---|---|---|
| Quadrant | DetID | PixID | Counts | Sigma | Mean | Median | Sigma |
| A | 13 | 254 | 10295 | 57.6 | 821 | 803 | 164.8 |
| A | 3 | 137 | 7525 | 40.79 | 821 | 803 | 164.8 |
| A | 0 | 226 | 6915 | 37.09 | 821 | 803 | 164.8 |
| B | 15 | 32 | 33988 | 217.85 | 799 | 779 | 152.4 |
| B | 4 | 200 | 22449 | 142.15 | 799 | 779 | 152.4 |
| B | 0 | 230 | 19870 | 125.23 | 799 | 779 | 152.4 |
| C | 14 | 238 | 127674 | 710.29 | 773 | 780 | 178.7 |
| C | 15 | 208 | 71898 | 398.08 | 773 | 780 | 178.7 |
| C | 3 | 233 | 20530 | 110.55 | 773 | 780 | 178.7 |
| D | 7 | 223 | 1429984 | 7757.18 | 779 | 758 | 184.2 |
| D | 1 | 52 | 796683 | 4319.91 | 779 | 758 | 184.2 |
| D | 8 | 195 | 404574 | 2191.73 | 779 | 758 | 184.2 |
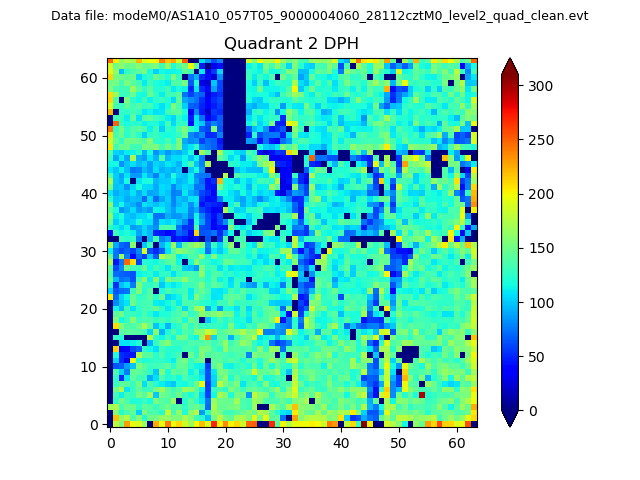
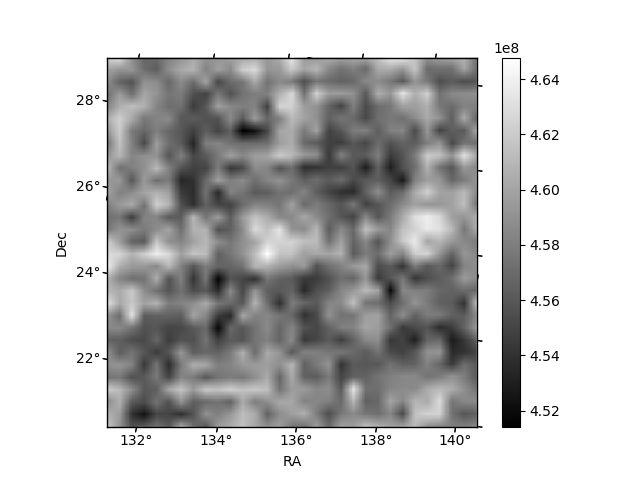
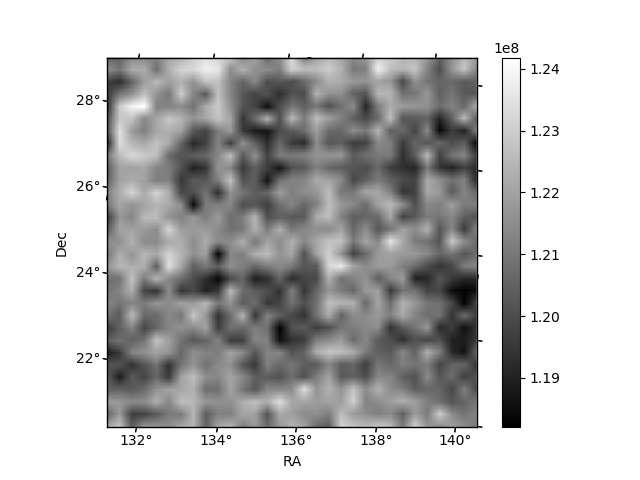
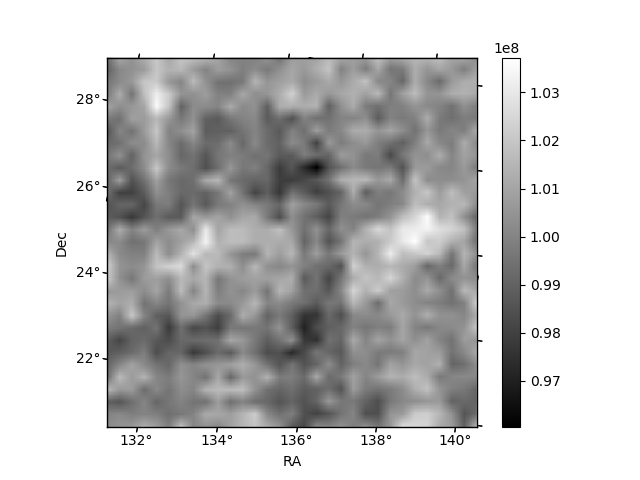
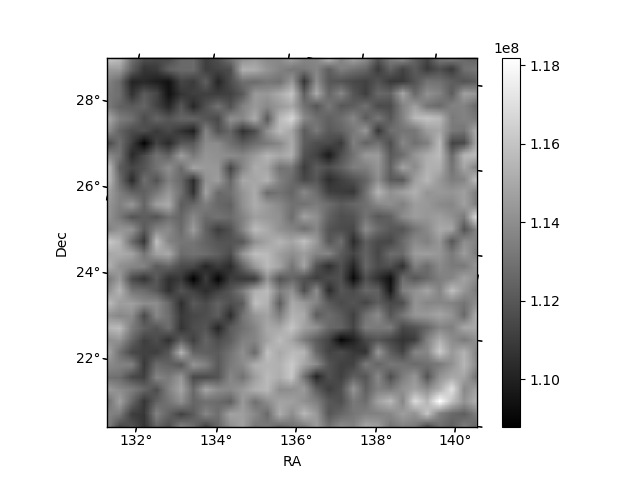
Histogram calculated using DETX and DETY for each event in the final _common_clean file
| Quadrant A | 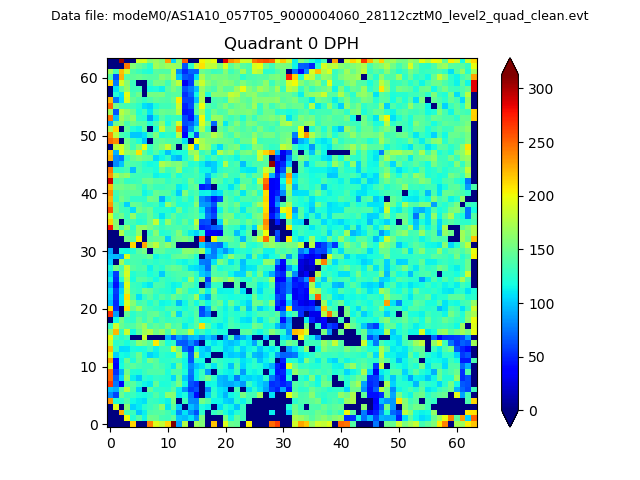 |
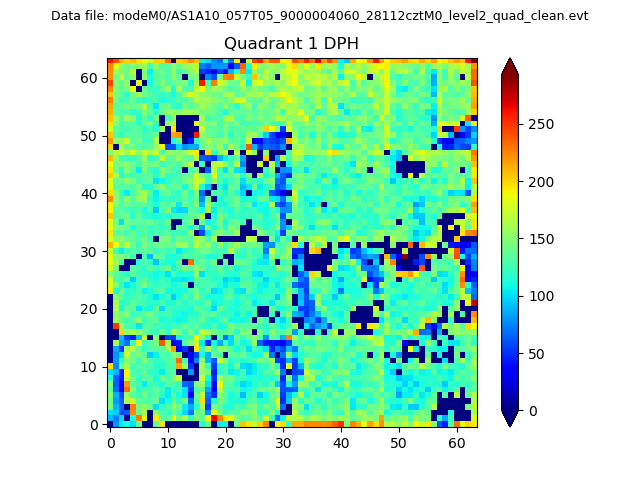 |
Quadrant B |
|---|---|---|---|
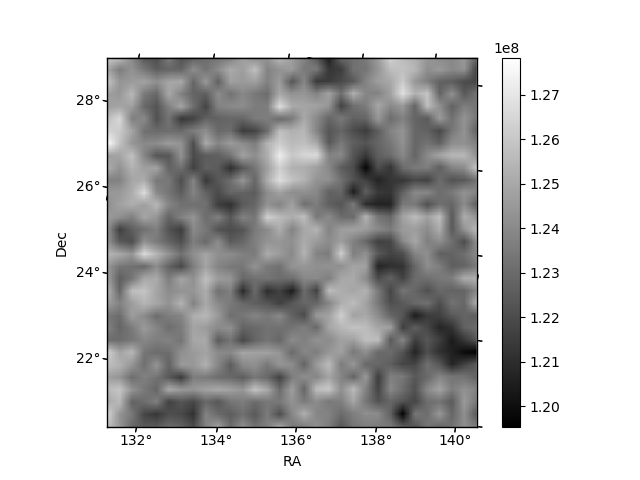
| Quadrant D | 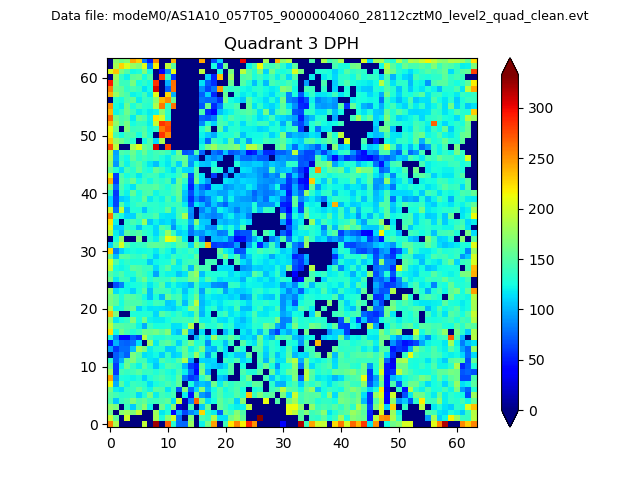 |
 |
Quadrant C |
| Plot type | Count rate plots | Images |
|---|---|---|
| Comparison with Poisson distribution Blue bars denote a histogram of data divided into 1 sec bins. Red curve is a Poisson curve with rate = median count rate of data. |
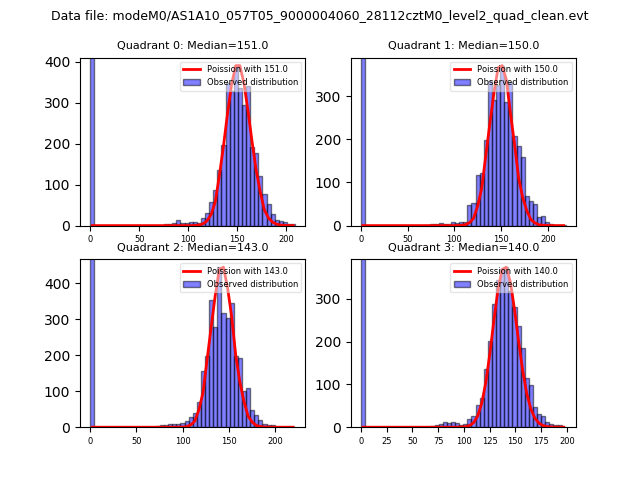 |
 |
| Quadrant-wise count rates Data is divided into 100 sec bins |
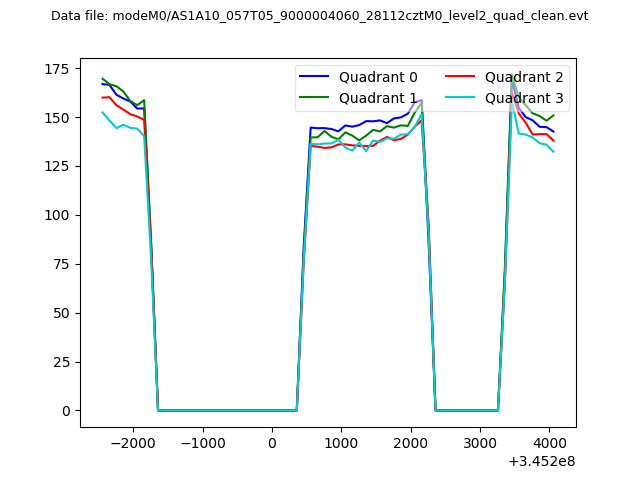 |
|
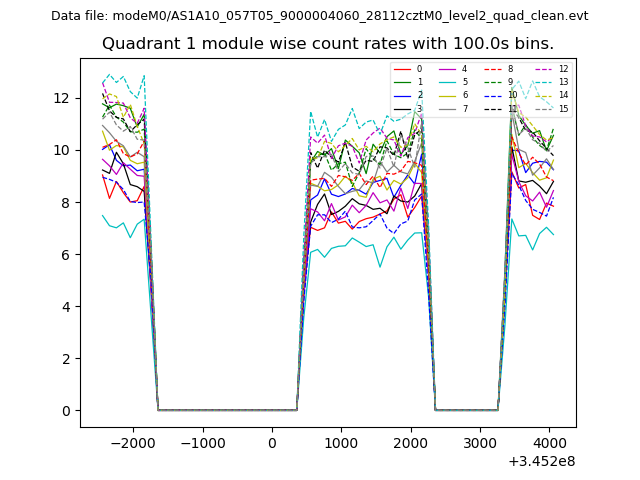
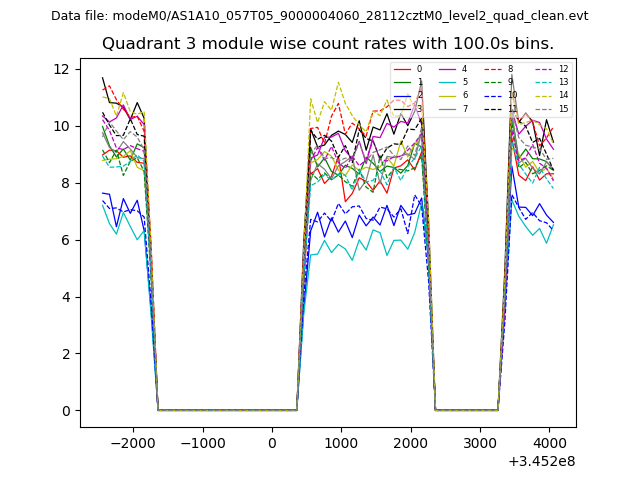
| Module-wise count rates for Quadrant A Data is divided into 100 sec bins |
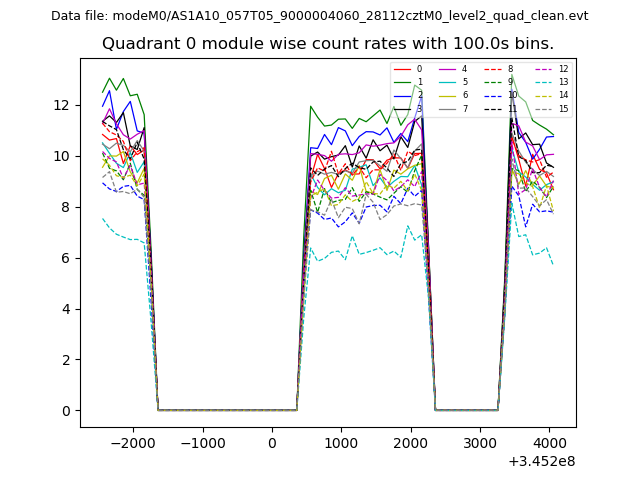 |
 |
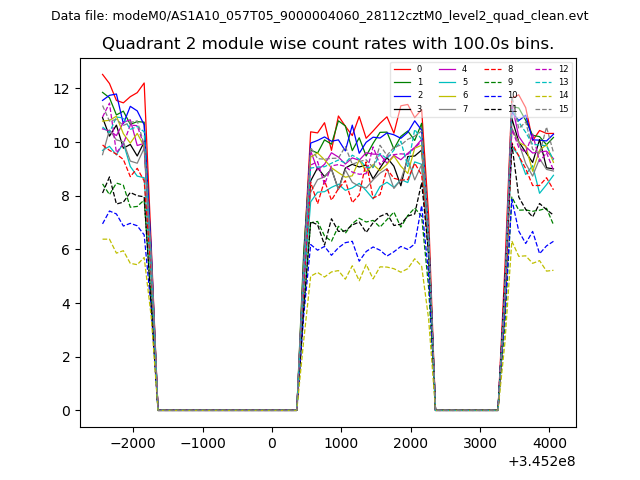
| Module-wise count rates for Quadrant B Data is divided into 100 sec bins |
 |
 |
| Module-wise count rates for Quadrant C Data is divided into 100 sec bins |
 |
 |
| Module-wise count rates for Quadrant D Data is divided into 100 sec bins |
 |
 |
| Parameter | Plot |
|---|---|
| CZT HV Monitor | 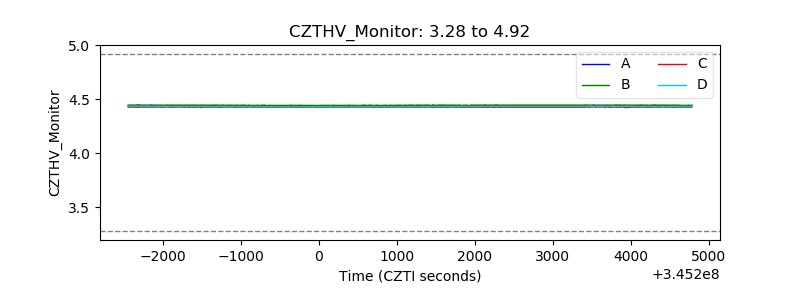 |
| D_VDD | 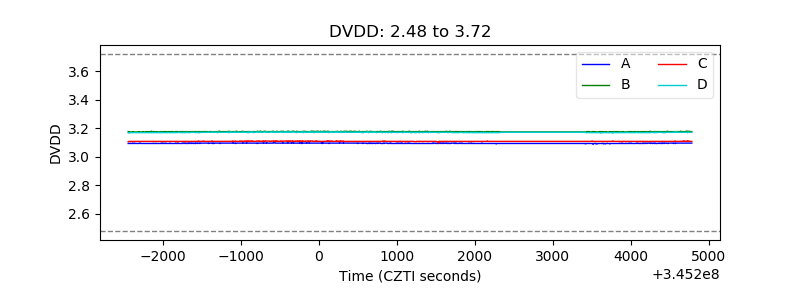 |
| Temperature 1 | 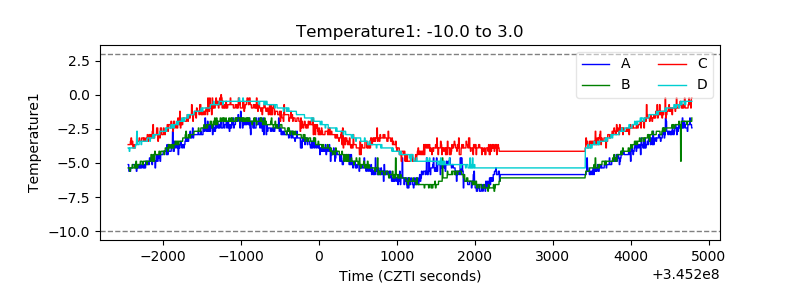 |
| Veto HV Monitor | 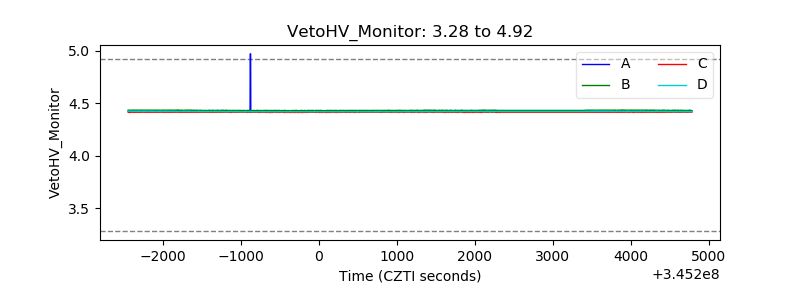 |
| Veto LLD | 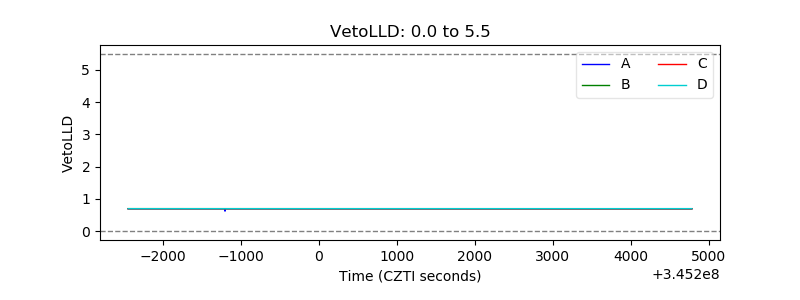 |
| Alpha Counter | 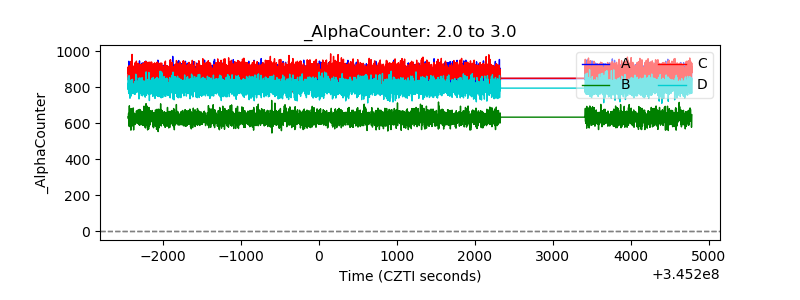 |
| _CPM_Rate | 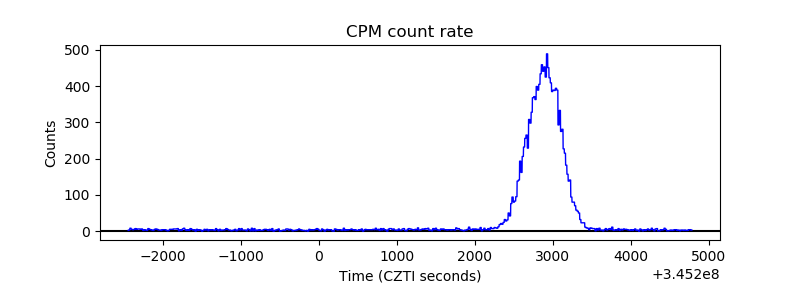 |
| CZT Counter | 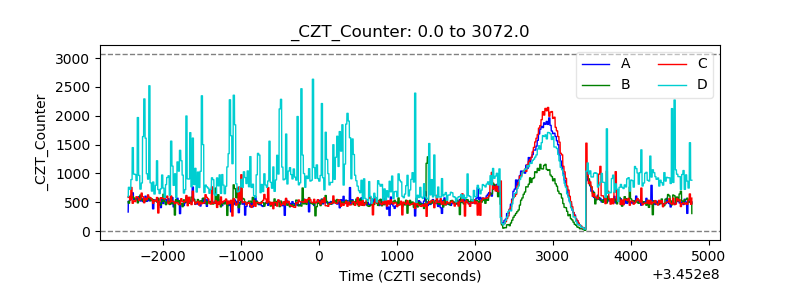 |
| +2.5 Volts monitor | 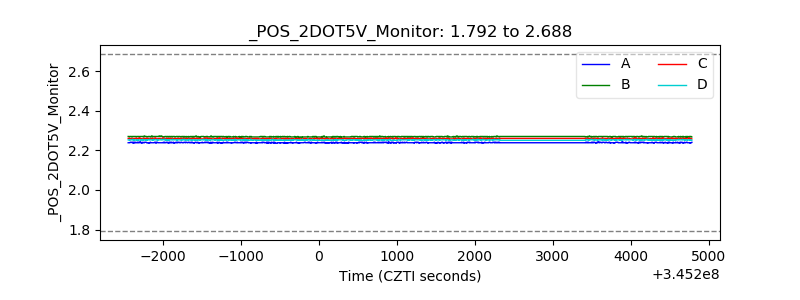 |
| +5 Volts monitor | 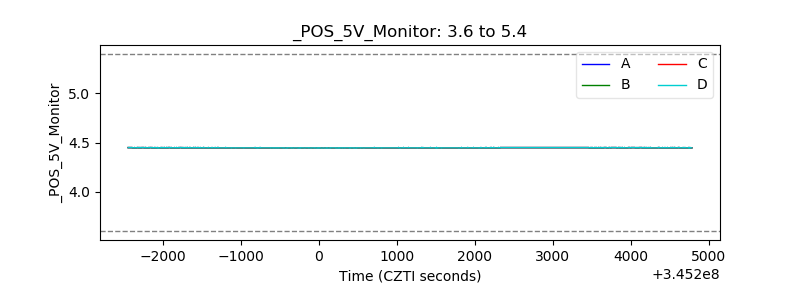 |
| _ROLL_ROT | 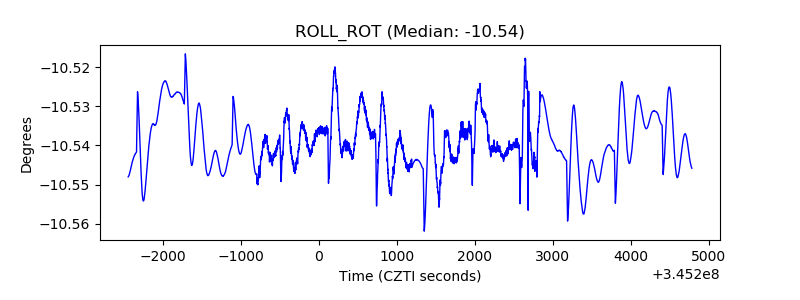 |
| _Roll_DEC | 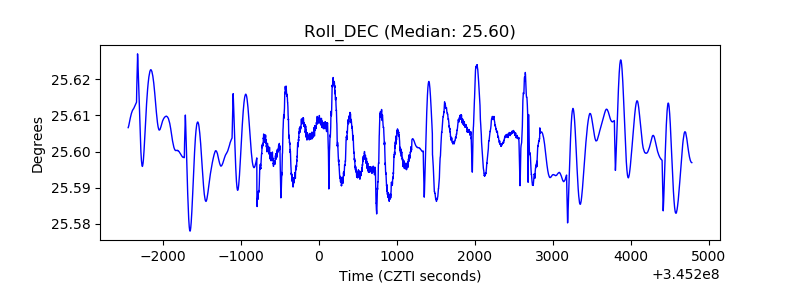 |
| _Roll_RA | 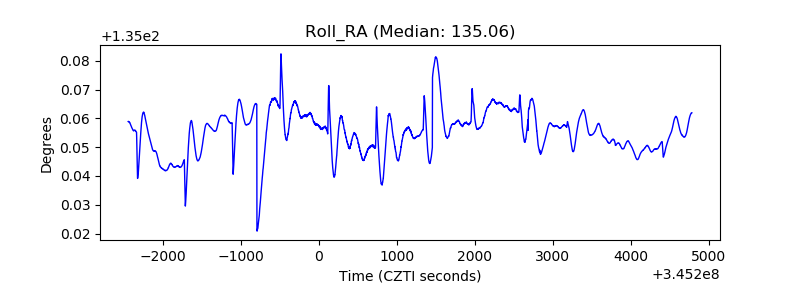 |
| Veto Counter | 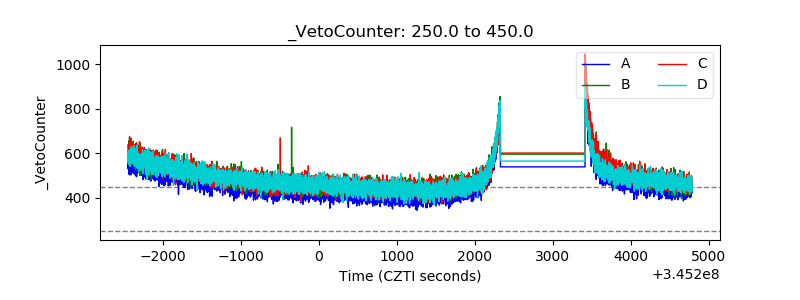 |