| Param | Original file | Final file |
|---|---|---|
| Filename | modeM0/AS1A10_057T05_9000004060_28113cztM0_level2.evt | modeM0/AS1A10_057T05_9000004060_28113cztM0_level2_quad_clean.evt |
| Size (bytes) | 329,693,760 | 37,497,600 |
| Size | 314.4 MB | 35.8 MB |
| Events in quadrant A | 1,861,437 | 225,944 |
| Events in quadrant B | 2,005,352 | 225,695 |
| Events in quadrant C | 1,918,087 | 214,486 |
| Events in quadrant D | 3,945,042 | 204,067 |
| Mode M0 | |||
|---|---|---|---|
| Quadrant | BADHDUFLAG | Total packets | Discarded packets |
| A | 0 | 7712 | 0 |
| B | 0 | 8213 | 0 |
| C | 0 | 7909 | 0 |
| D | 0 | 14374 | 0 |
| Mode M9 | |||
|---|---|---|---|
| Quadrant | BADHDUFLAG | Total packets | Discarded packets |
| A | 0 | 2 | 0 |
| B | 0 | 3 | 0 |
| C | 0 | 3 | 0 |
| D | 0 | 3 | 0 |
| Quadrant | Total seconds | Saturated seconds | Saturation percentage |
|---|---|---|---|
| A | 3746 | 36 | 0.961025% |
| B | 3746 | 49 | 1.308062% |
| C | 3746 | 57 | 1.521623% |
| D | 3746 | 224 | 5.979712% |
Noise dominated data is calculated using 1-second bins in cleaned event files. If a bin has >2000 counts, and if more than 50% of those come from <1% of pixels, then it is considered to be noise-dominated and hence unusable.
| Quadrant | # 1 sec bins | Bins with >0 counts | Bins with >2000 counts | High rate bins dominated by noise | Noise dominated (total time) | Noise dominated (detector-on time) | Marked lightcurve |
|---|---|---|---|---|---|---|---|
| A | 3746 | 3746 | 0 | 0 | 0.00% | 0.00% | 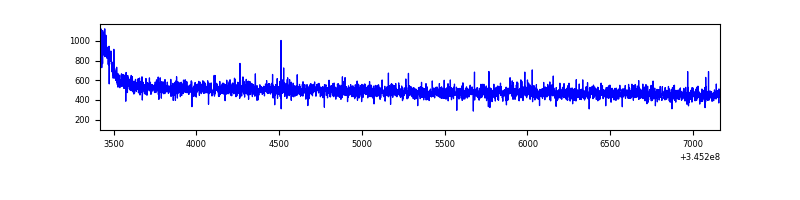 |
| B | 3746 | 3746 | 0 | 0 | 0.00% | 0.00% | 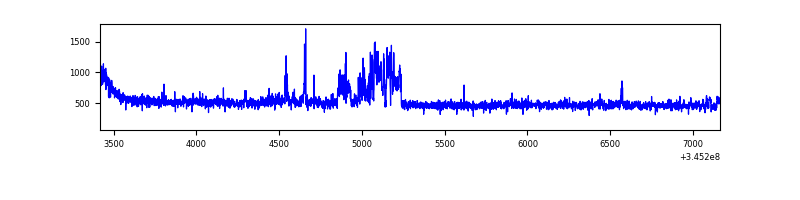 |
| C | 3746 | 3746 | 4 | 4 | 0.11% | 0.11% | 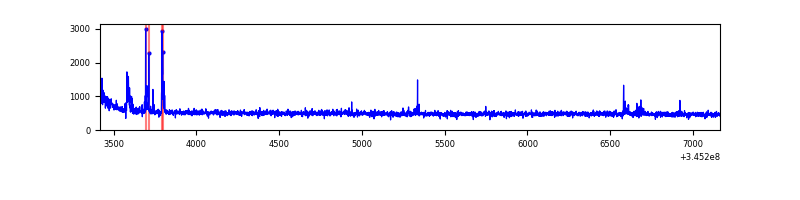 |
| D | 3746 | 3746 | 164 | 164 | 4.38% | 4.38% | 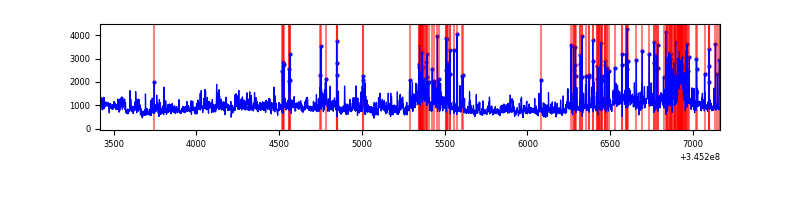 |
Top three noisy pixels from each quadrant. If the there are fewer than three noisy pixels in the level2.evt file, extra rows are filled as -1
| Pixel properties | Quadrant properties | ||||||
|---|---|---|---|---|---|---|---|
| Quadrant | DetID | PixID | Counts | Sigma | Mean | Median | Sigma |
| A | 13 | 254 | 6630 | 62.67 | 482 | 472 | 98.3 |
| A | 3 | 137 | 4457 | 40.55 | 482 | 472 | 98.3 |
| A | 0 | 226 | 4128 | 37.21 | 482 | 472 | 98.3 |
| B | 15 | 32 | 124372 | 1349.29 | 470 | 459 | 91.8 |
| B | 4 | 200 | 15816 | 167.22 | 470 | 459 | 91.8 |
| B | 0 | 230 | 12118 | 126.95 | 470 | 459 | 91.8 |
| C | 14 | 238 | 74543 | 689.76 | 456 | 459 | 107.4 |
| C | 15 | 208 | 59675 | 551.33 | 456 | 459 | 107.4 |
| C | 3 | 233 | 7760 | 67.98 | 456 | 459 | 107.4 |
| D | 7 | 223 | 1311656 | 11892.33 | 459 | 448 | 110.3 |
| D | 8 | 195 | 411536 | 3728.46 | 459 | 448 | 110.3 |
| D | 2 | 250 | 255841 | 2316.35 | 459 | 448 | 110.3 |
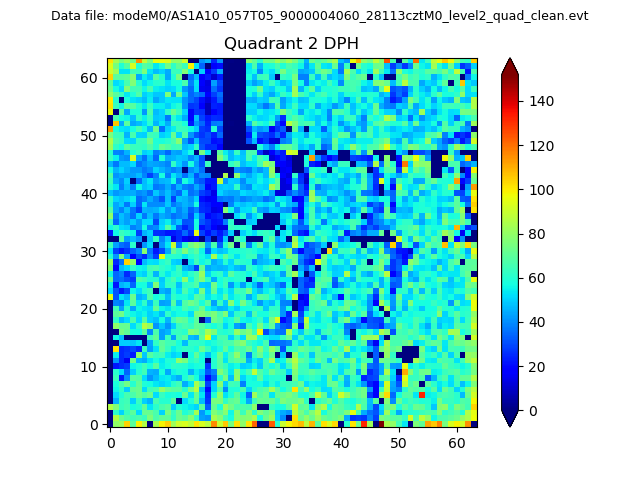
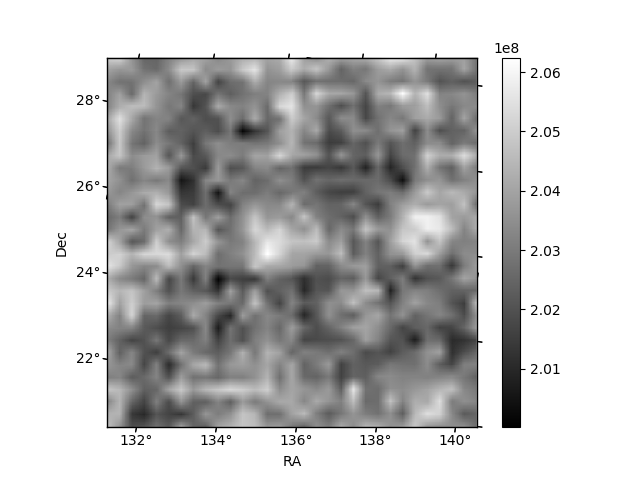
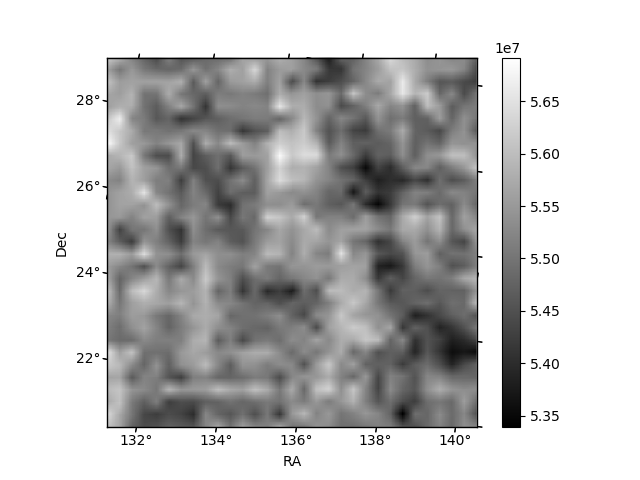
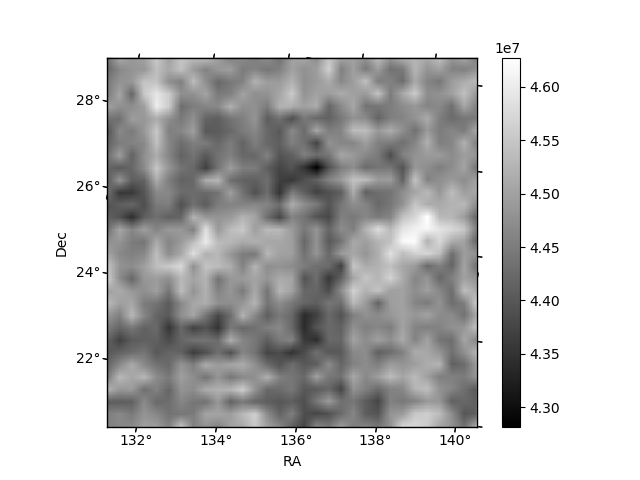
Histogram calculated using DETX and DETY for each event in the final _common_clean file
| Quadrant A | 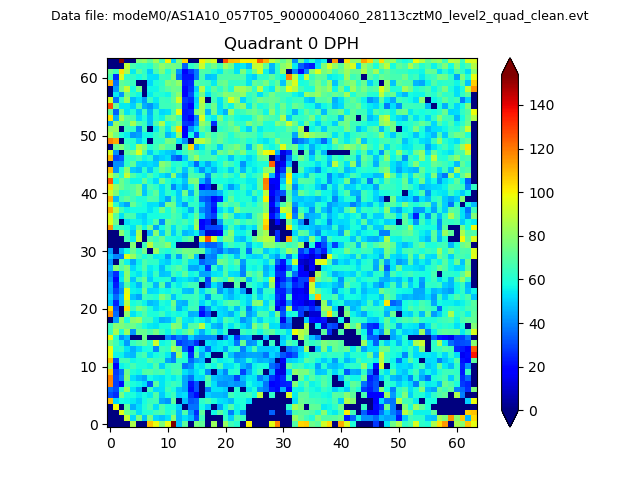 |
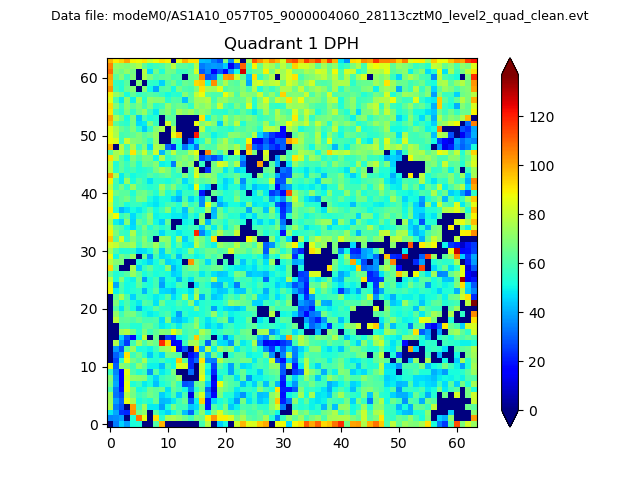 |
Quadrant B |
|---|---|---|---|
| Quadrant D | 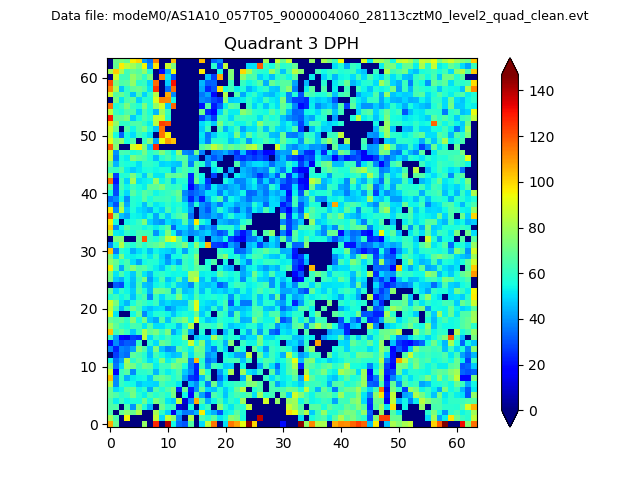 |
 |
Quadrant C |
| Plot type | Count rate plots | Images |
|---|---|---|
| Comparison with Poisson distribution Blue bars denote a histogram of data divided into 1 sec bins. Red curve is a Poisson curve with rate = median count rate of data. |
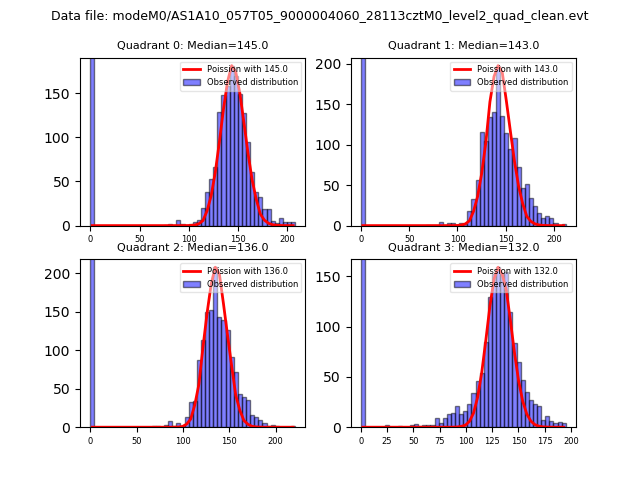 |
 |
| Quadrant-wise count rates Data is divided into 100 sec bins |
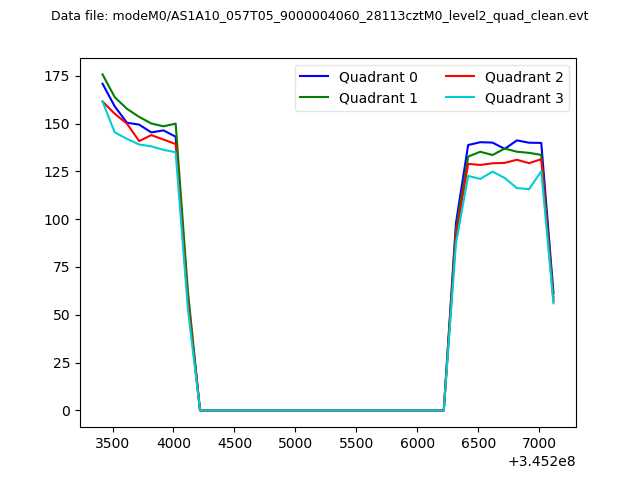 |
|
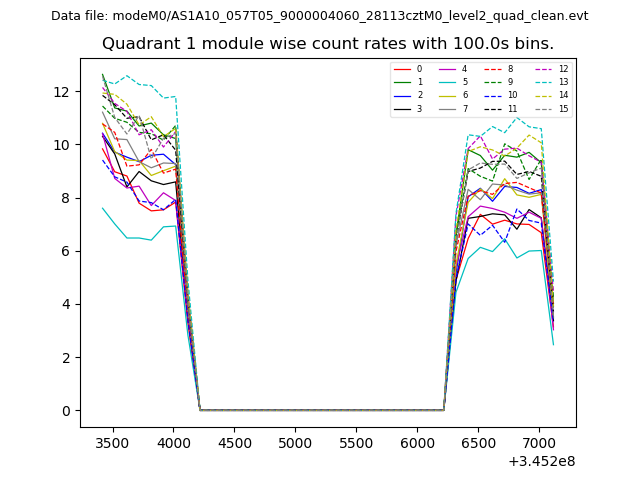
| Module-wise count rates for Quadrant A Data is divided into 100 sec bins |
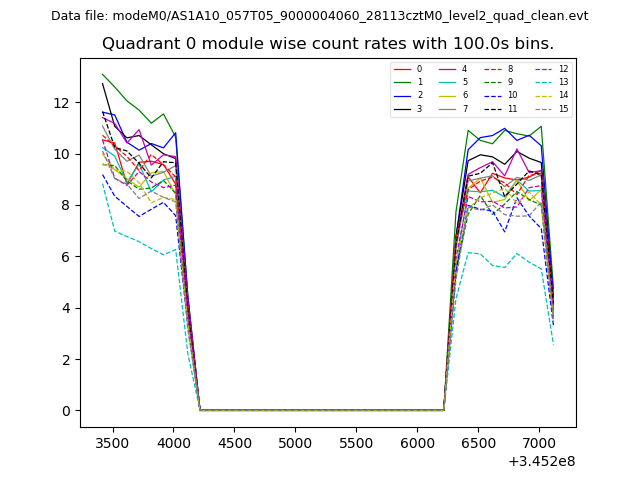 |
 |
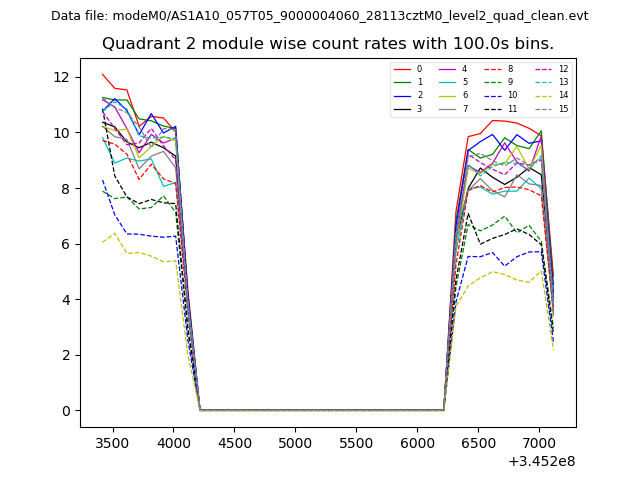
| Module-wise count rates for Quadrant B Data is divided into 100 sec bins |
 |
 |
| Module-wise count rates for Quadrant C Data is divided into 100 sec bins |
 |
 |
| Module-wise count rates for Quadrant D Data is divided into 100 sec bins |
 |
 |
| Parameter | Plot |
|---|---|
| CZT HV Monitor | 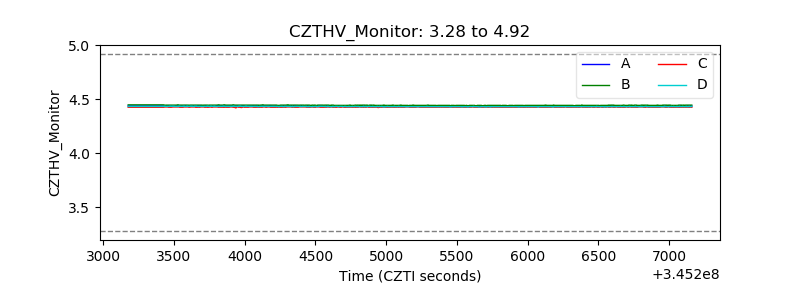 |
| D_VDD | 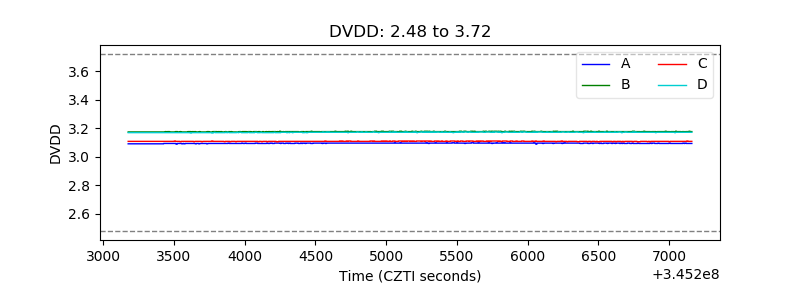 |
| Temperature 1 | 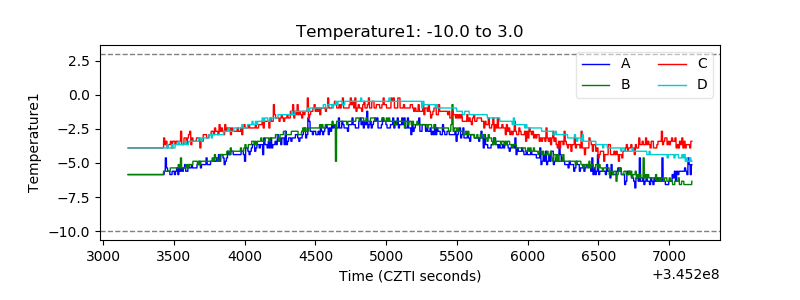 |
| Veto HV Monitor | 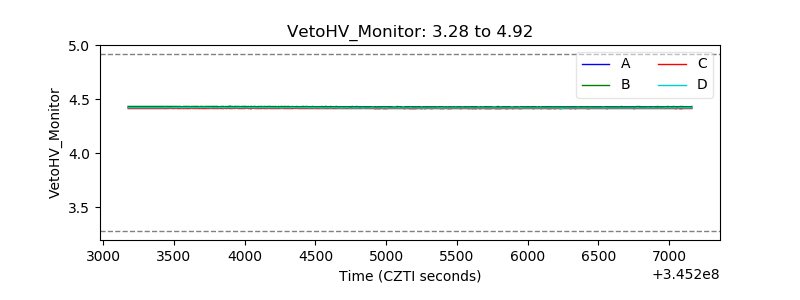 |
| Veto LLD | 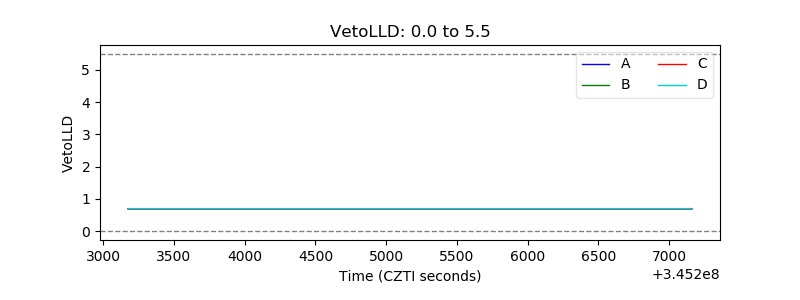 |
| Alpha Counter | 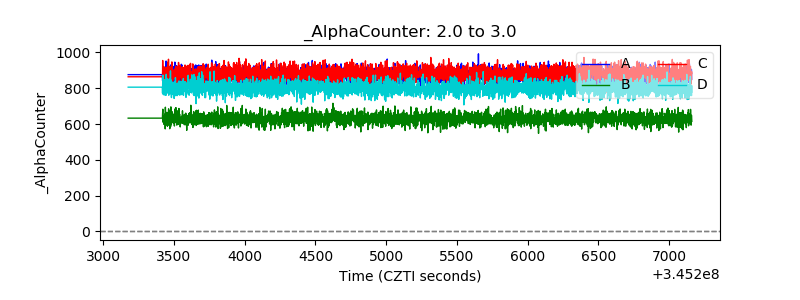 |
| _CPM_Rate | 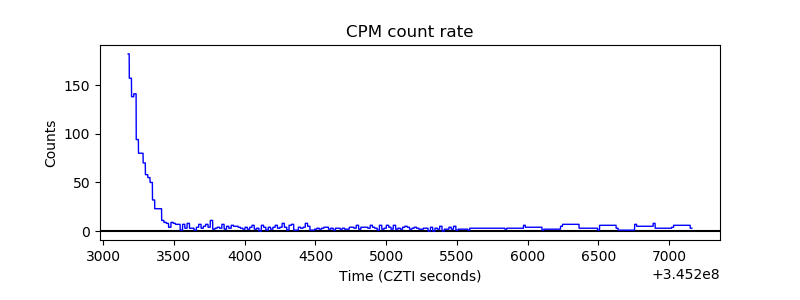 |
| CZT Counter | 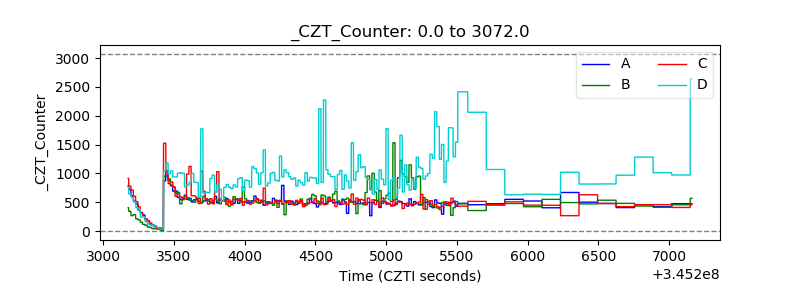 |
| +2.5 Volts monitor |  |
| +5 Volts monitor |  |
| _ROLL_ROT | 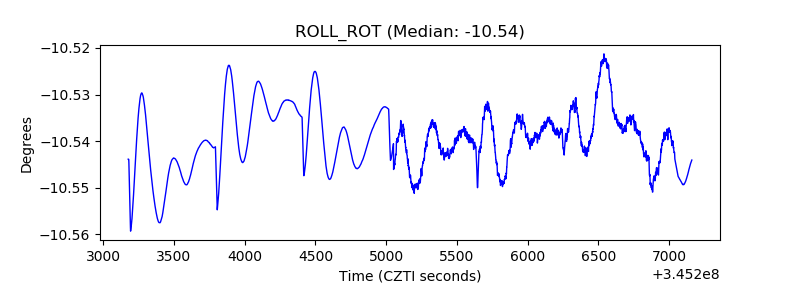 |
| _Roll_DEC | 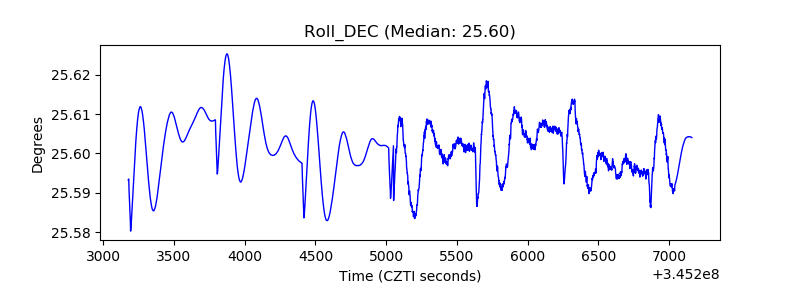 |
| _Roll_RA | 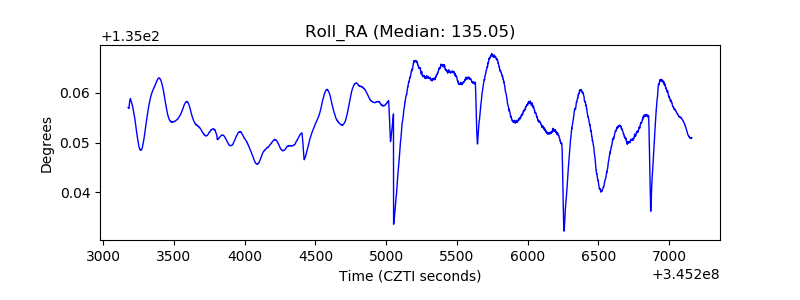 |
| Veto Counter | 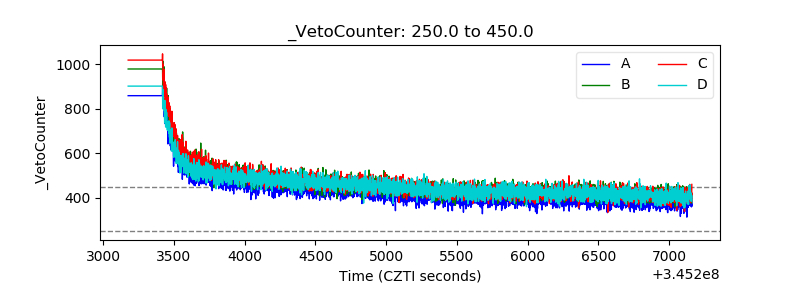 |