| Param | Original file | Final file |
|---|---|---|
| Filename | modeM0/AS1A10_024T01_9000004062cztM0_level2.fits | modeM0/AS1A10_024T01_9000004062cztM0_level2_quad_clean.evt |
| Size (bytes) | 239,155,200 | 231,099,840 |
| Size | 228.1 MB | 220.4 MB |
| Events in quadrant A | 1,475,780 | 1,402,540 |
| Events in quadrant B | 1,394,772 | 1,381,065 |
| Events in quadrant C | 1,420,692 | 1,313,880 |
| Events in quadrant D | 1,209,258 | 1,158,879 |
| Mode SS | |||
|---|---|---|---|
| Quadrant | BADHDUFLAG | Total packets | Discarded packets |
| A | 0 | 520 | 0 |
| B | 0 | 520 | 0 |
| C | 0 | 520 | 0 |
| D | 0 | 520 | 0 |
| Mode M9 | |||
|---|---|---|---|
| Quadrant | BADHDUFLAG | Total packets | Discarded packets |
| A | 0 | 23 | 0 |
| B | 0 | 23 | 0 |
| C | 0 | 23 | 0 |
| D | 0 | 23 | 0 |
| Mode M0 | |||
|---|---|---|---|
| Quadrant | BADHDUFLAG | Total packets | Discarded packets |
| A | 0 | 52350 | 0 |
| B | 0 | 56070 | 0 |
| C | 0 | 53128 | 0 |
| D | 0 | 83778 | 0 |
| Quadrant | Total seconds | Saturated seconds | Saturation percentage |
|---|---|---|---|
| A | 25324 | 277 | 1.093824% |
| B | 25324 | 412 | 1.626915% |
| C | 25324 | 427 | 1.686148% |
| D | 25324 | 1622 | 6.404991% |
Noise dominated data is calculated using 1-second bins in cleaned event files. If a bin has >2000 counts, and if more than 50% of those come from <1% of pixels, then it is considered to be noise-dominated and hence unusable.
| Quadrant | # 1 sec bins | Bins with >0 counts | Bins with >2000 counts | High rate bins dominated by noise | Noise dominated (total time) | Noise dominated (detector-on time) | Marked lightcurve |
|---|---|---|---|---|---|---|---|
| A | 27649 | 25323 | 0 | 0 | 0.00% | 0.00% |  |
| B | 27649 | 25324 | 0 | 0 | 0.00% | 0.00% |  |
| C | 27649 | 25324 | 0 | 0 | 0.00% | 0.00% |  |
| D | 27649 | 25313 | 0 | 0 | 0.00% | 0.00% |  |
Top three noisy pixels from each quadrant. If the there are fewer than three noisy pixels in the level2.evt file, extra rows are filled as -1
| Pixel properties | Quadrant properties | ||||||
|---|---|---|---|---|---|---|---|
| Quadrant | DetID | PixID | Counts | Sigma | Mean | Median | Sigma |
| A | 0 | 29 | 1222 | 8.99 | 384 | 360 | 95.9 |
| A | 7 | 110 | 1182 | 8.57 | 384 | 360 | 95.9 |
| A | 9 | 19 | 1116 | 7.88 | 384 | 360 | 95.9 |
| B | 2 | 9 | 1153 | 10.51 | 370 | 352 | 76.2 |
| B | 5 | 128 | 967 | 8.07 | 370 | 352 | 76.2 |
| B | 3 | 17 | 936 | 7.66 | 370 | 352 | 76.2 |
| C | 12 | 241 | 1011 | 6.88 | 375 | 351 | 96.0 |
| C | 2 | 191 | 993 | 6.69 | 375 | 351 | 96.0 |
| C | 9 | 233 | 977 | 6.52 | 375 | 351 | 96.0 |
| D | 3 | 14 | 910 | 6.3 | 345 | 313 | 94.8 |
| D | 10 | 189 | 848 | 5.64 | 345 | 313 | 94.8 |
| D | 15 | 63 | 835 | 5.51 | 345 | 313 | 94.8 |
Histogram calculated using DETX and DETY for each event in the final _common_clean file
| Quadrant A |  |
 |
Quadrant B |
|---|---|---|---|
| Quadrant D | 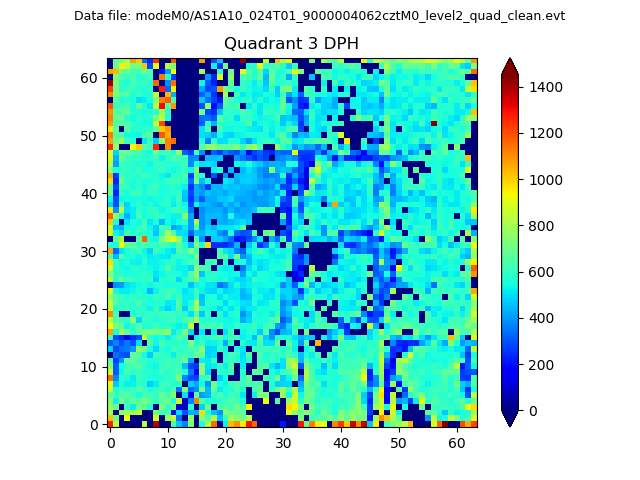 |
 |
Quadrant C |
| Plot type | Count rate plots | Images |
|---|---|---|
| Comparison with Poisson distribution Blue bars denote a histogram of data divided into 1 sec bins. Red curve is a Poisson curve with rate = median count rate of data. |
 |
 |
| Quadrant-wise count rates Data is divided into 100 sec bins |
 |
|
| Module-wise count rates for Quadrant A Data is divided into 100 sec bins |
 |
 |
| Module-wise count rates for Quadrant B Data is divided into 100 sec bins |
 |
 |
| Module-wise count rates for Quadrant C Data is divided into 100 sec bins |
 |
 |
| Module-wise count rates for Quadrant D Data is divided into 100 sec bins |
 |
 |
| Parameter | Plot |
|---|---|
| CZT HV Monitor |  |
| D_VDD | 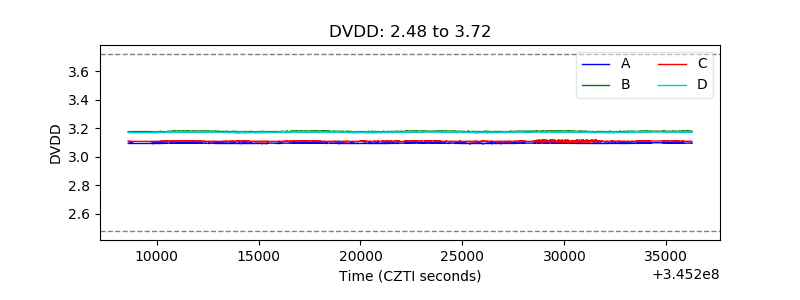 |
| Temperature 1 |  |
| Veto HV Monitor |  |
| Veto LLD | 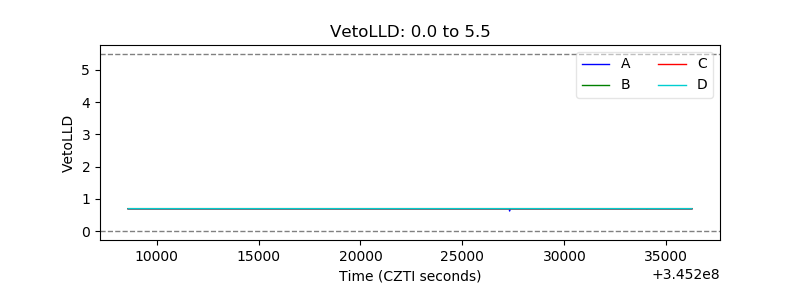 |
| Alpha Counter |  |
| _CPM_Rate |  |
| CZT Counter |  |
| +2.5 Volts monitor |  |
| +5 Volts monitor |  |
| _ROLL_ROT |  |
| _Roll_DEC |  |
| _Roll_RA | 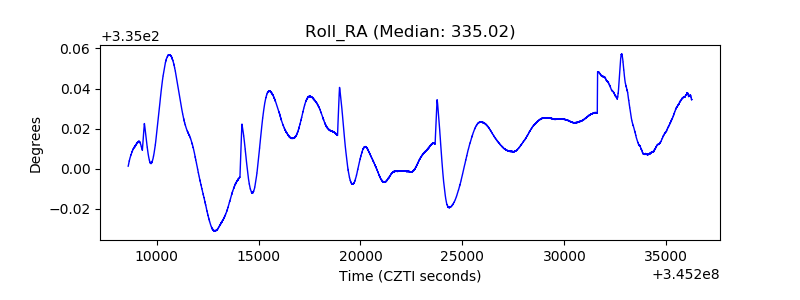 |
| Veto Counter |  |