| Param | Original file | Final file |
|---|---|---|
| Filename | modeM0/AS1A10_024T01_9000004062_28113cztM0_level2.evt | modeM0/AS1A10_024T01_9000004062_28113cztM0_level2_quad_clean.evt |
| Size (bytes) | 172,883,520 | 34,099,200 |
| Size | 164.9 MB | 32.5 MB |
| Events in quadrant A | 1,016,772 | 228,366 |
| Events in quadrant B | 1,068,540 | 230,858 |
| Events in quadrant C | 1,030,445 | 222,827 |
| Events in quadrant D | 1,985,429 | 208,275 |
| Mode M9 | |||
|---|---|---|---|
| Quadrant | BADHDUFLAG | Total packets | Discarded packets |
| A | 0 | 8 | 0 |
| B | 0 | 8 | 0 |
| C | 0 | 8 | 0 |
| D | 0 | 8 | 0 |
| Mode M0 | |||
|---|---|---|---|
| Quadrant | BADHDUFLAG | Total packets | Discarded packets |
| A | 0 | 4193 | 0 |
| B | 0 | 4344 | 0 |
| C | 0 | 4286 | 0 |
| D | 0 | 7307 | 0 |
| Quadrant | Total seconds | Saturated seconds | Saturation percentage |
|---|---|---|---|
| A | 1952 | 77 | 3.944672% |
| B | 1951 | 74 | 3.792927% |
| C | 1951 | 76 | 3.895438% |
| D | 1951 | 215 | 11.019990% |
Noise dominated data is calculated using 1-second bins in cleaned event files. If a bin has >2000 counts, and if more than 50% of those come from <1% of pixels, then it is considered to be noise-dominated and hence unusable.
| Quadrant | # 1 sec bins | Bins with >0 counts | Bins with >2000 counts | High rate bins dominated by noise | Noise dominated (total time) | Noise dominated (detector-on time) | Marked lightcurve |
|---|---|---|---|---|---|---|---|
| A | 2762 | 1952 | 0 | 0 | 0.00% | 0.00% | 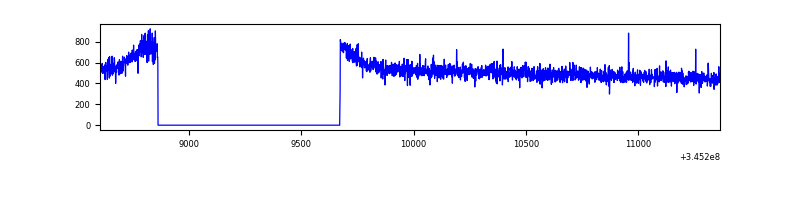 |
| B | 2761 | 1951 | 4 | 4 | 0.14% | 0.21% | 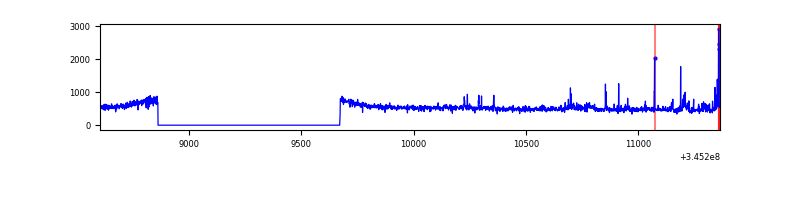 |
| C | 2761 | 1952 | 2 | 2 | 0.07% | 0.10% | 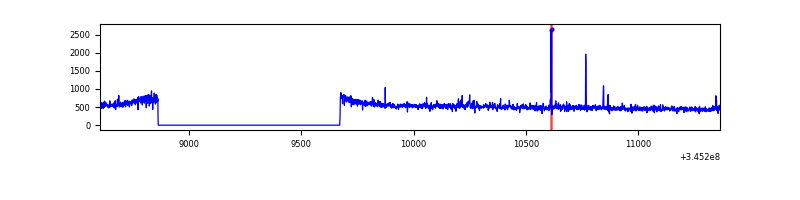 |
| D | 2761 | 1951 | 86 | 86 | 3.11% | 4.41% | 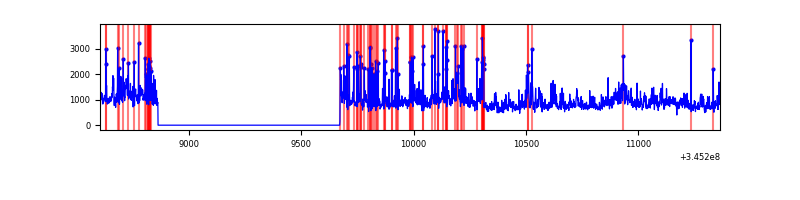 |
Top three noisy pixels from each quadrant. If the there are fewer than three noisy pixels in the level2.evt file, extra rows are filled as -1
| Pixel properties | Quadrant properties | ||||||
|---|---|---|---|---|---|---|---|
| Quadrant | DetID | PixID | Counts | Sigma | Mean | Median | Sigma |
| A | 13 | 254 | 3026 | 50.21 | 263 | 258 | 55.1 |
| A | 3 | 137 | 2519 | 41.02 | 263 | 258 | 55.1 |
| A | 0 | 226 | 2285 | 36.77 | 263 | 258 | 55.1 |
| B | 0 | 245 | 27413 | 531.04 | 255 | 248 | 51.2 |
| B | 0 | 230 | 8783 | 166.85 | 255 | 248 | 51.2 |
| B | 15 | 33 | 8497 | 161.26 | 255 | 248 | 51.2 |
| C | 14 | 238 | 39848 | 665.46 | 246 | 247 | 59.5 |
| C | 2 | 16 | 20352 | 337.85 | 246 | 247 | 59.5 |
| C | 3 | 233 | 6351 | 102.57 | 246 | 247 | 59.5 |
| D | 7 | 223 | 465414 | 7670.77 | 246 | 238 | 60.6 |
| D | 8 | 195 | 274385 | 4520.7 | 246 | 238 | 60.6 |
| D | 1 | 52 | 230010 | 3788.95 | 246 | 238 | 60.6 |
Histogram calculated using DETX and DETY for each event in the final _common_clean file
| Quadrant A | 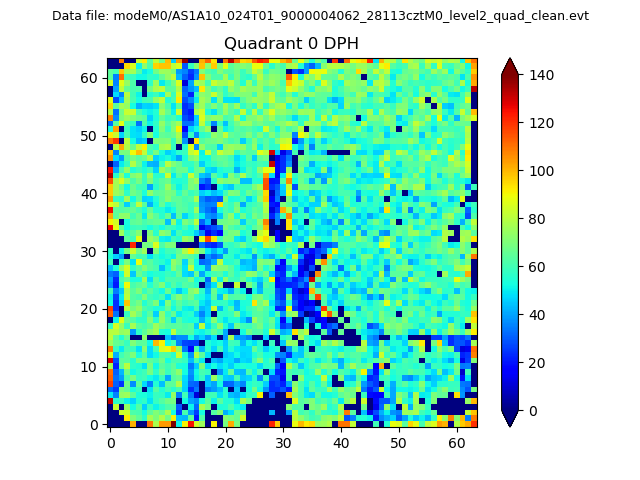 |
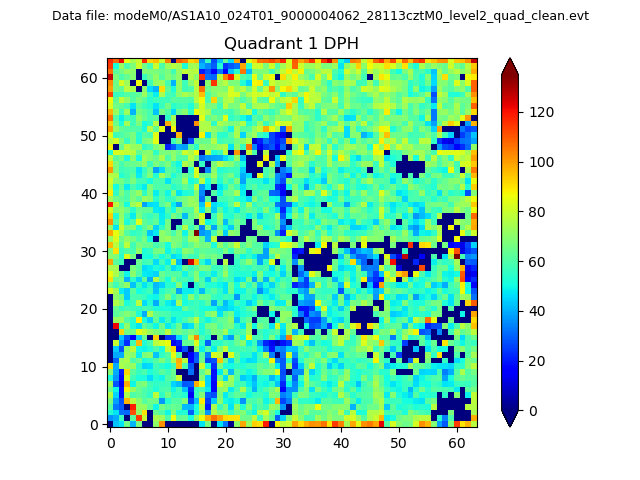 |
Quadrant B |
|---|---|---|---|
| Quadrant D | 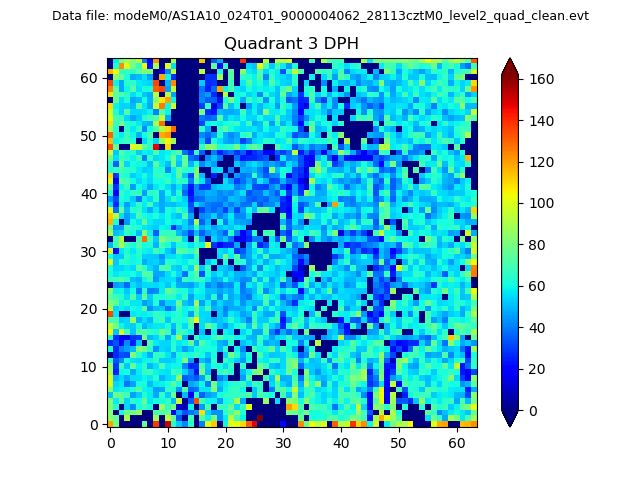 |
 |
Quadrant C |
| Plot type | Count rate plots | Images |
|---|---|---|
| Comparison with Poisson distribution Blue bars denote a histogram of data divided into 1 sec bins. Red curve is a Poisson curve with rate = median count rate of data. |
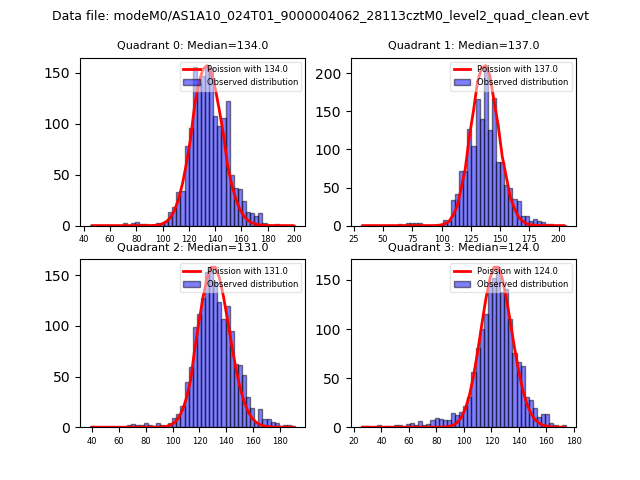 |
 |
| Quadrant-wise count rates Data is divided into 100 sec bins |
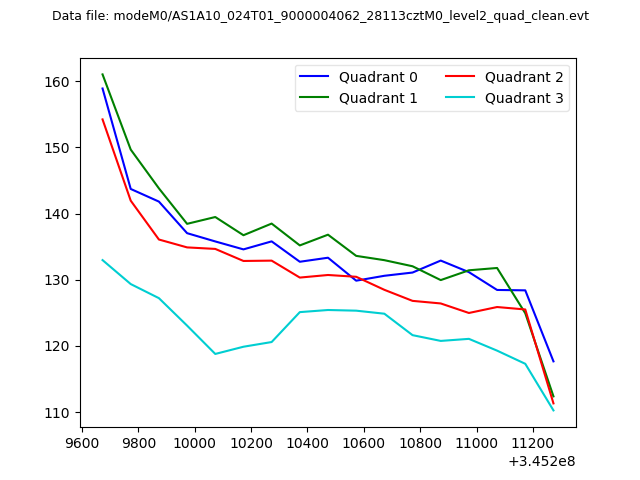 |
|
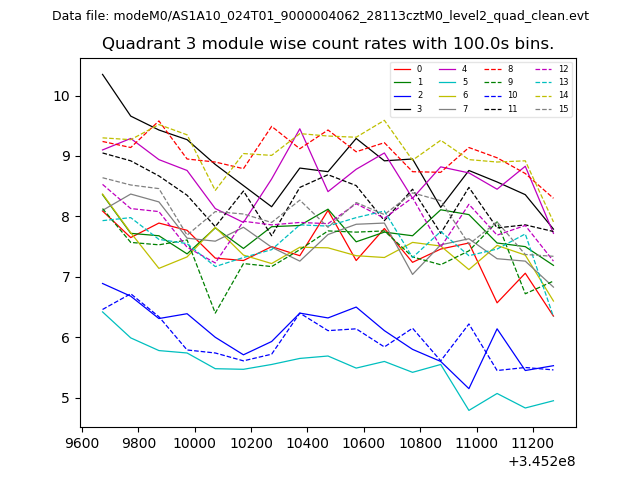
| Module-wise count rates for Quadrant A Data is divided into 100 sec bins |
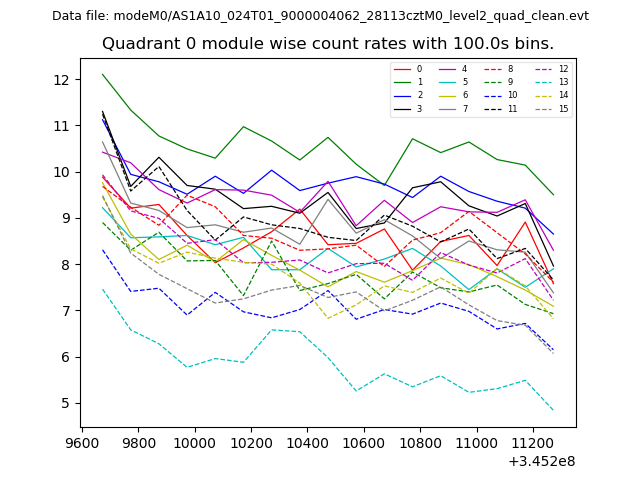 |
 |
| Module-wise count rates for Quadrant B Data is divided into 100 sec bins |
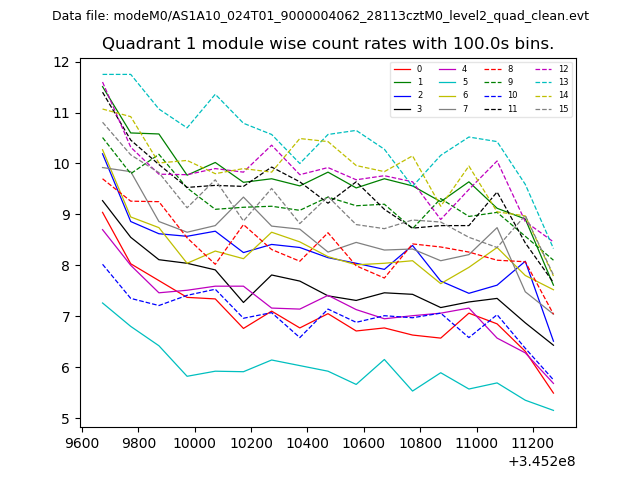 |
 |
| Module-wise count rates for Quadrant C Data is divided into 100 sec bins |
 |
 |
| Module-wise count rates for Quadrant D Data is divided into 100 sec bins |
 |
 |
| Parameter | Plot |
|---|---|
| CZT HV Monitor | 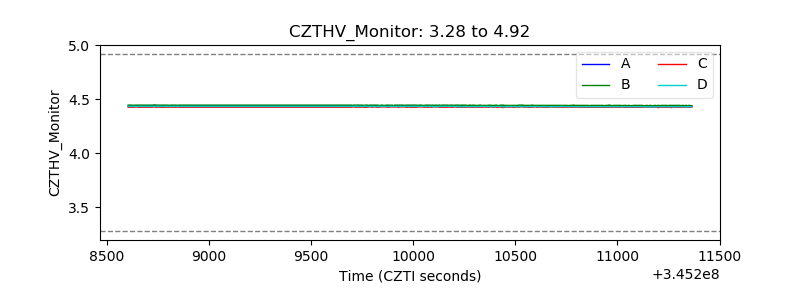 |
| D_VDD | 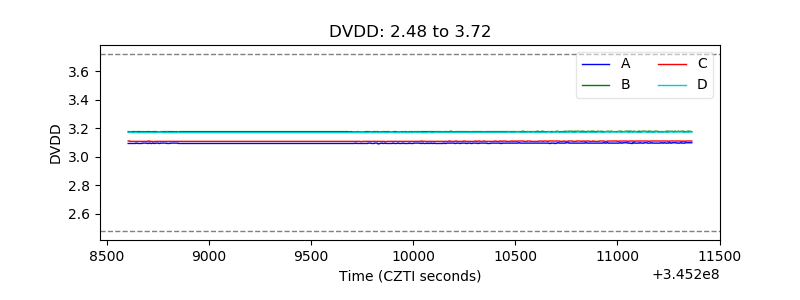 |
| Temperature 1 | 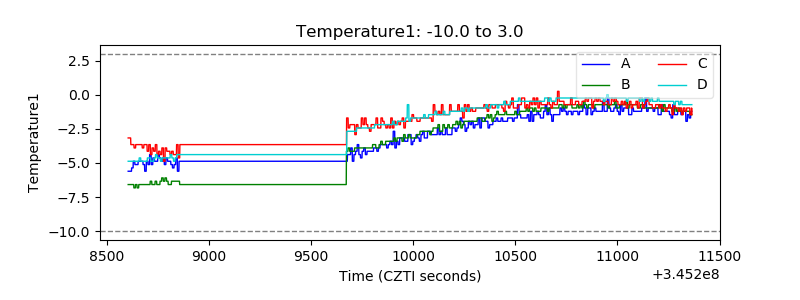 |
| Veto HV Monitor | 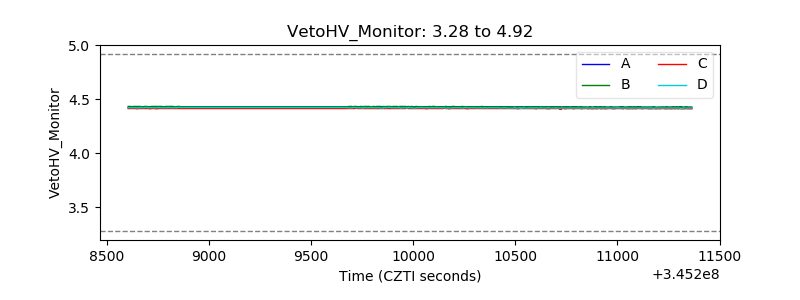 |
| Veto LLD | 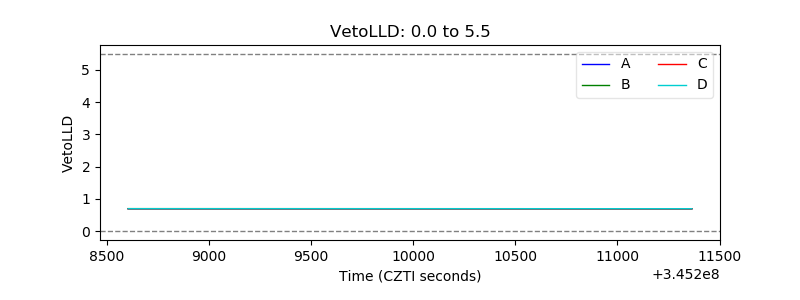 |
| Alpha Counter | 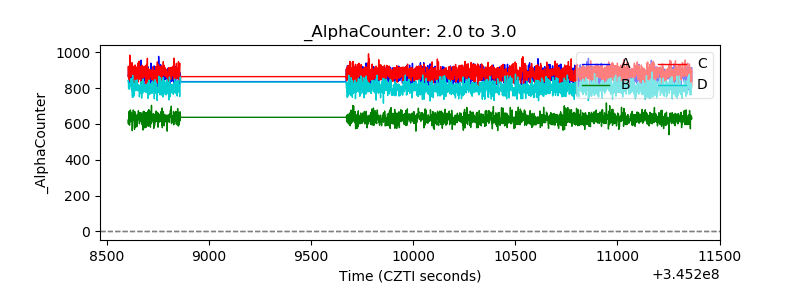 |
| _CPM_Rate | 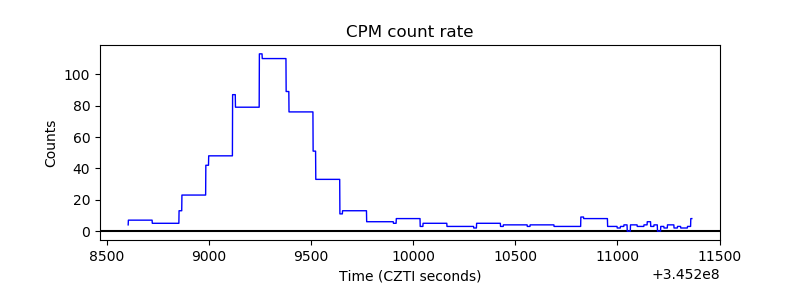 |
| CZT Counter |  |
| +2.5 Volts monitor |  |
| +5 Volts monitor | 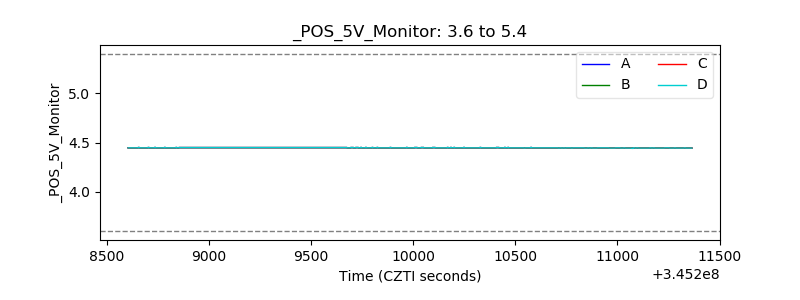 |
| _ROLL_ROT | 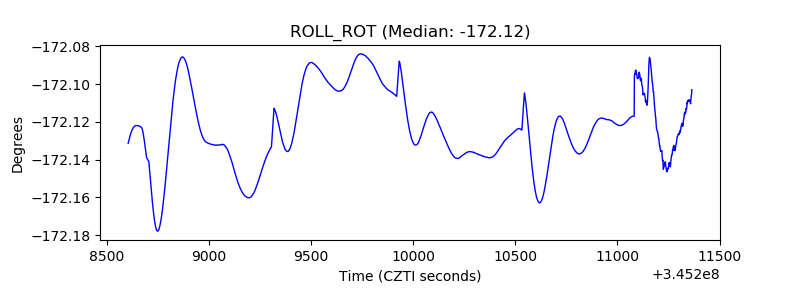 |
| _Roll_DEC | 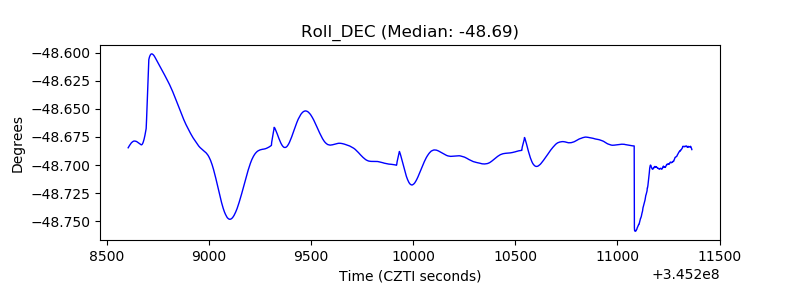 |
| _Roll_RA | 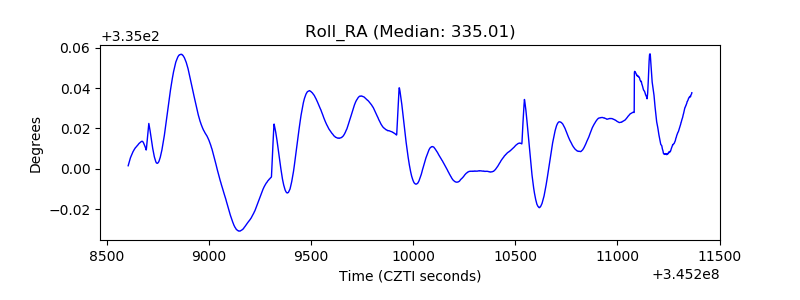 |
| Veto Counter | 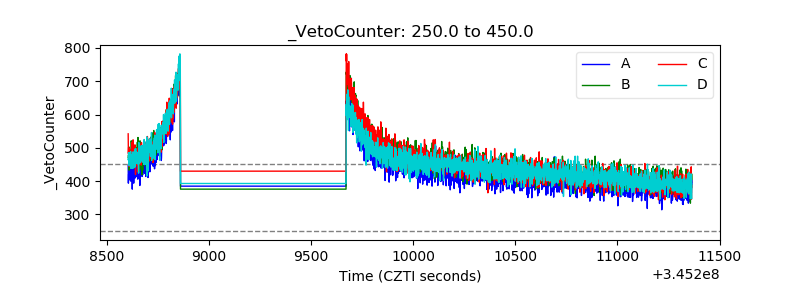 |