| Param | Original file | Final file |
|---|---|---|
| Filename | modeM0/AS1A10_024T01_9000004062_28114cztM0_level2.evt | modeM0/AS1A10_024T01_9000004062_28114cztM0_level2_quad_clean.evt |
| Size (bytes) | 551,324,160 | 92,859,840 |
| Size | 525.8 MB | 88.6 MB |
| Events in quadrant A | 3,127,218 | 609,158 |
| Events in quadrant B | 3,291,291 | 606,183 |
| Events in quadrant C | 3,249,852 | 582,660 |
| Events in quadrant D | 6,581,391 | 554,000 |
| Mode M9 | |||
|---|---|---|---|
| Quadrant | BADHDUFLAG | Total packets | Discarded packets |
| A | 0 | 5 | 0 |
| B | 0 | 5 | 0 |
| C | 0 | 5 | 0 |
| D | 0 | 5 | 0 |
| Mode M0 | |||
|---|---|---|---|
| Quadrant | BADHDUFLAG | Total packets | Discarded packets |
| A | 0 | 13650 | 0 |
| B | 0 | 14029 | 0 |
| C | 0 | 14098 | 0 |
| D | 0 | 24293 | 0 |
| Quadrant | Total seconds | Saturated seconds | Saturation percentage |
|---|---|---|---|
| A | 6605 | 79 | 1.196064% |
| B | 6606 | 92 | 1.392673% |
| C | 6606 | 132 | 1.998183% |
| D | 6606 | 530 | 8.023009% |
Noise dominated data is calculated using 1-second bins in cleaned event files. If a bin has >2000 counts, and if more than 50% of those come from <1% of pixels, then it is considered to be noise-dominated and hence unusable.
| Quadrant | # 1 sec bins | Bins with >0 counts | Bins with >2000 counts | High rate bins dominated by noise | Noise dominated (total time) | Noise dominated (detector-on time) | Marked lightcurve |
|---|---|---|---|---|---|---|---|
| A | 6995 | 6607 | 0 | 0 | 0.00% | 0.00% | 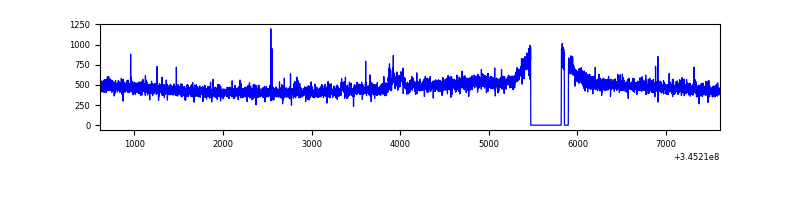 |
| B | 6996 | 6608 | 6 | 6 | 0.09% | 0.09% | 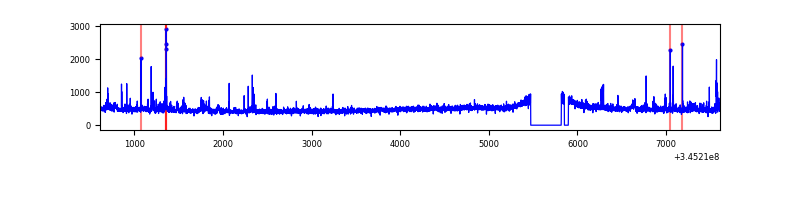 |
| C | 6996 | 6608 | 10 | 10 | 0.14% | 0.15% |  |
| D | 6996 | 6607 | 470 | 470 | 6.72% | 7.11% | 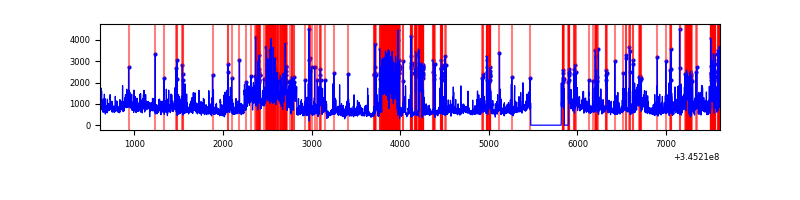 |
Top three noisy pixels from each quadrant. If the there are fewer than three noisy pixels in the level2.evt file, extra rows are filled as -1
| Pixel properties | Quadrant properties | ||||||
|---|---|---|---|---|---|---|---|
| Quadrant | DetID | PixID | Counts | Sigma | Mean | Median | Sigma |
| A | 5 | 203 | 25126 | 150.86 | 803 | 787 | 161.3 |
| A | 13 | 254 | 11111 | 63.99 | 803 | 787 | 161.3 |
| A | 3 | 137 | 7540 | 41.86 | 803 | 787 | 161.3 |
| B | 10 | 245 | 37670 | 245.05 | 791 | 772 | 150.6 |
| B | 0 | 245 | 34164 | 221.77 | 791 | 772 | 150.6 |
| B | 0 | 190 | 29011 | 187.54 | 791 | 772 | 150.6 |
| C | 14 | 238 | 121521 | 680.88 | 756 | 760 | 177.4 |
| C | 2 | 16 | 116955 | 655.14 | 756 | 760 | 177.4 |
| C | 3 | 233 | 57189 | 318.16 | 756 | 760 | 177.4 |
| D | 1 | 52 | 1765268 | 9813.47 | 747 | 727 | 179.8 |
| D | 7 | 223 | 1382438 | 7684.36 | 747 | 727 | 179.8 |
| D | 2 | 250 | 307250 | 1704.72 | 747 | 727 | 179.8 |
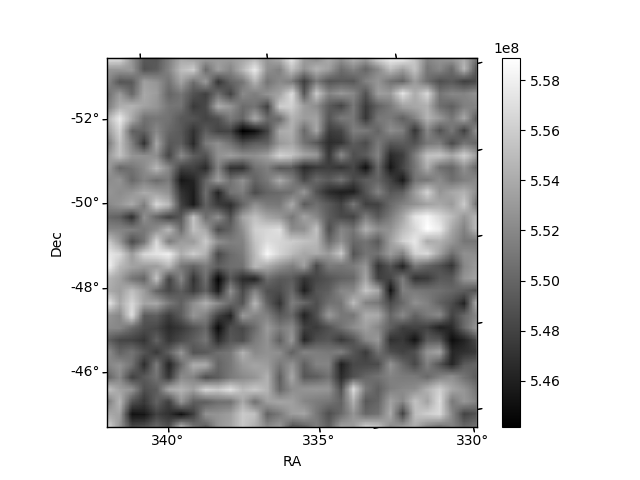
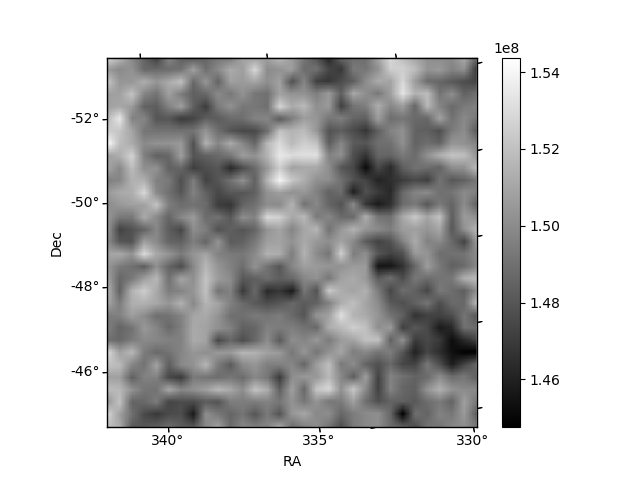
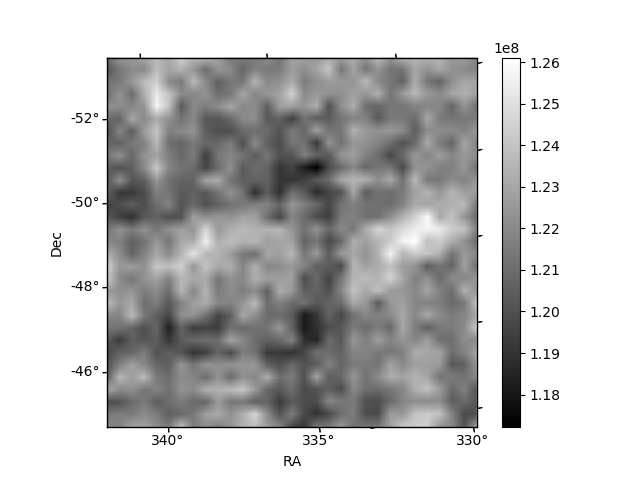
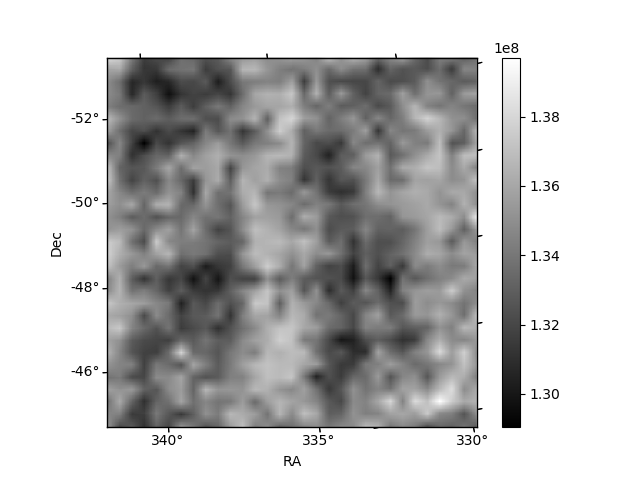
Histogram calculated using DETX and DETY for each event in the final _common_clean file
| Quadrant A | 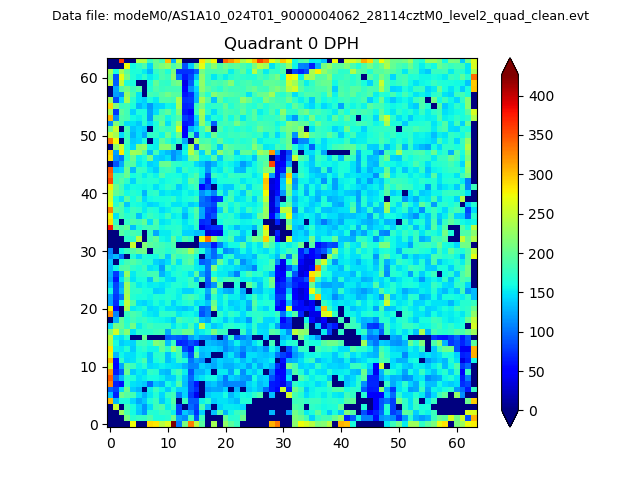 |
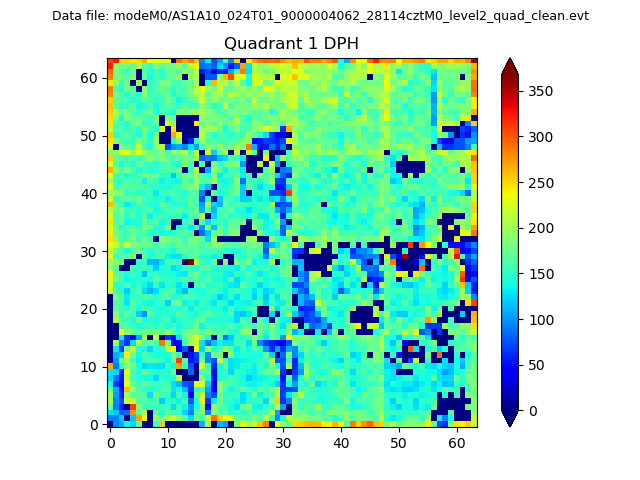 |
Quadrant B |
|---|---|---|---|
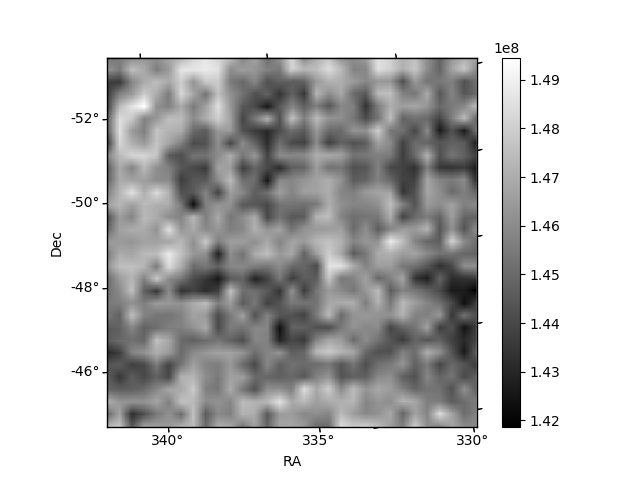
| Quadrant D | 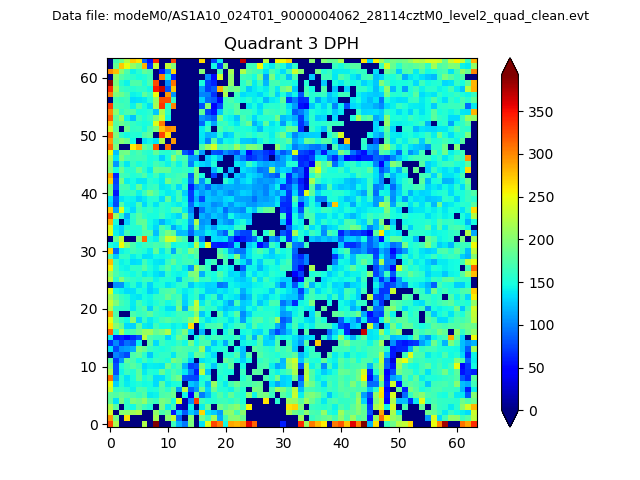 |
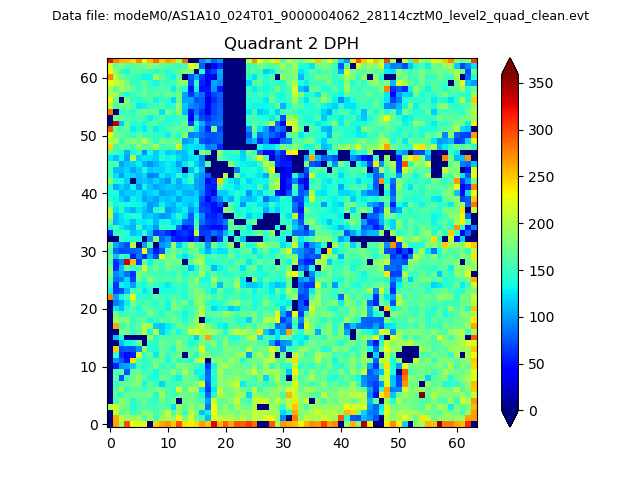 |
Quadrant C |
| Plot type | Count rate plots | Images |
|---|---|---|
| Comparison with Poisson distribution Blue bars denote a histogram of data divided into 1 sec bins. Red curve is a Poisson curve with rate = median count rate of data. |
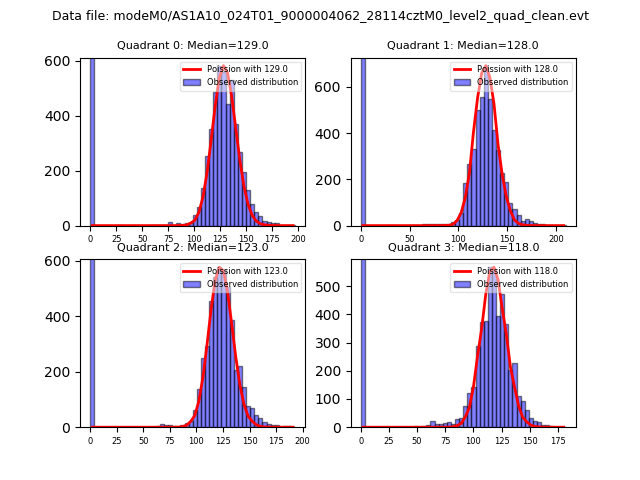 |
 |
| Quadrant-wise count rates Data is divided into 100 sec bins |
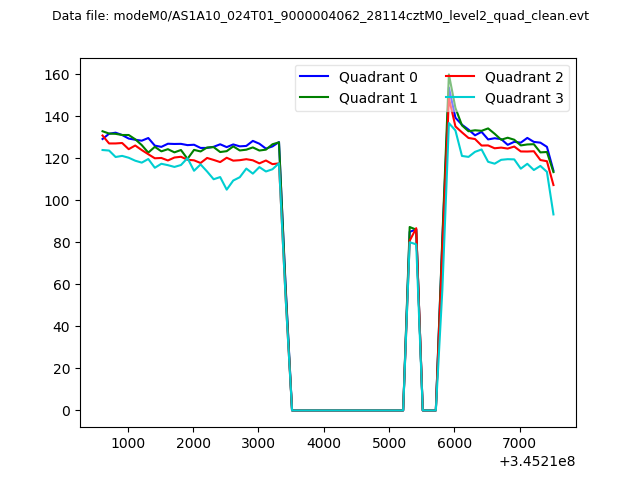 |
|
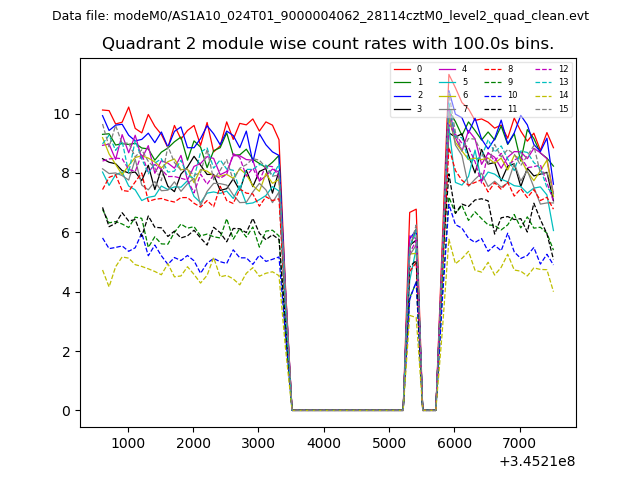
| Module-wise count rates for Quadrant A Data is divided into 100 sec bins |
 |
 |
| Module-wise count rates for Quadrant B Data is divided into 100 sec bins |
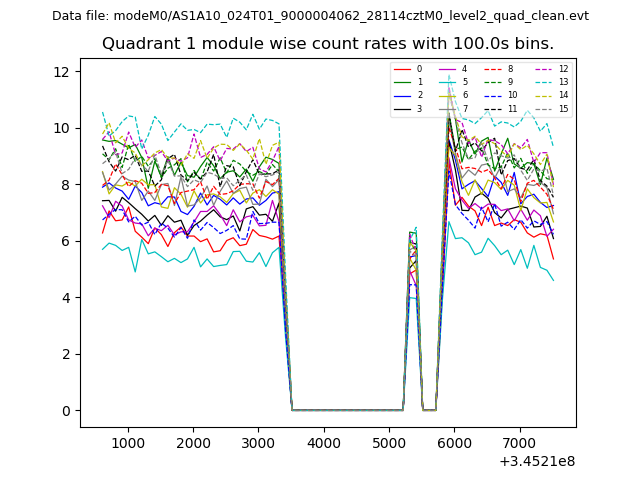 |
 |
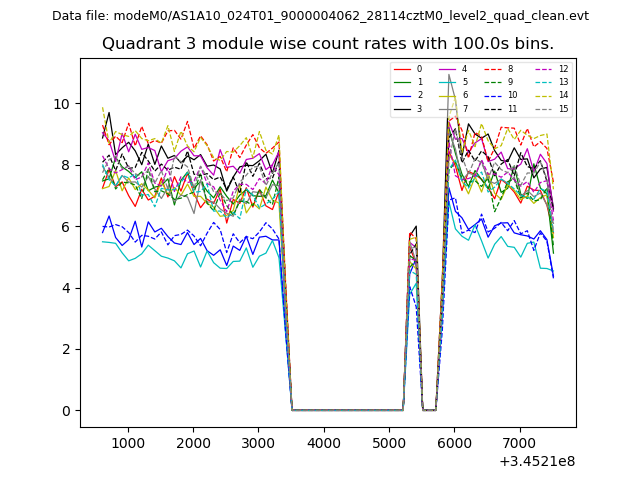
| Module-wise count rates for Quadrant C Data is divided into 100 sec bins |
 |
 |
| Module-wise count rates for Quadrant D Data is divided into 100 sec bins |
 |
 |
| Parameter | Plot |
|---|---|
| CZT HV Monitor | 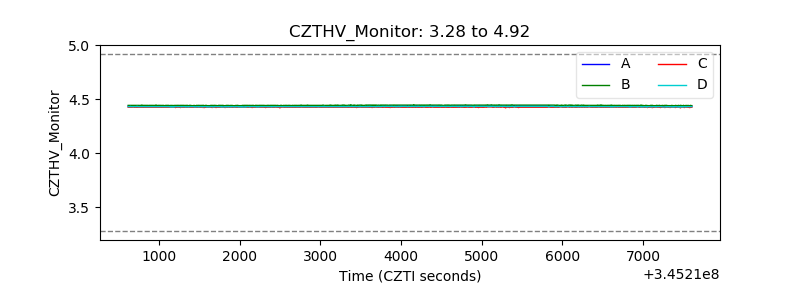 |
| D_VDD | 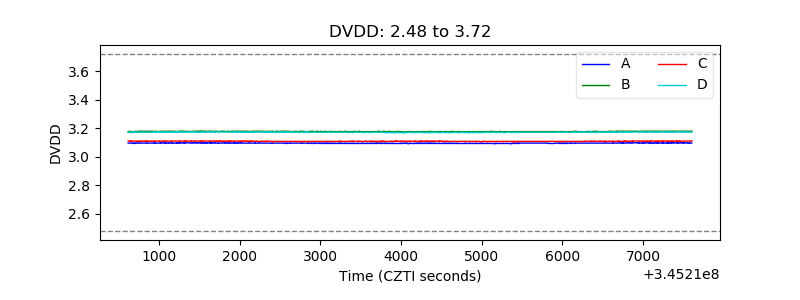 |
| Temperature 1 | 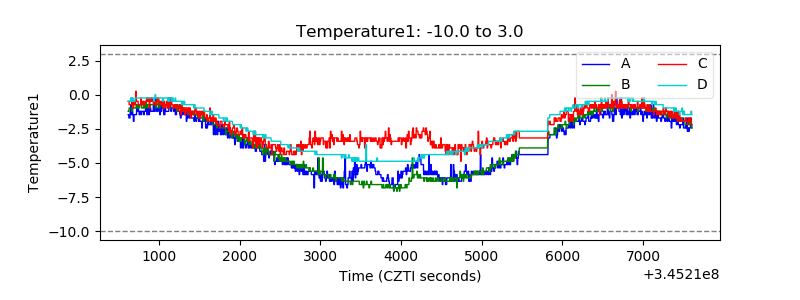 |
| Veto HV Monitor | 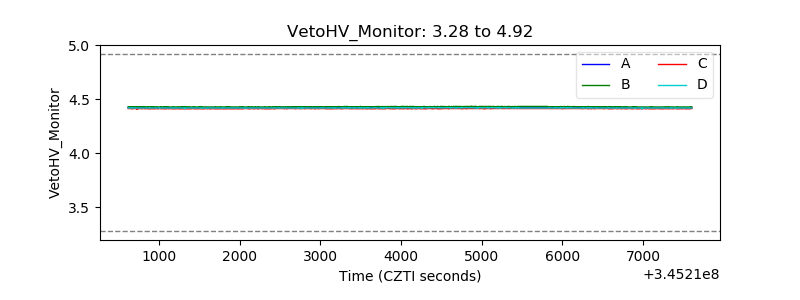 |
| Veto LLD | 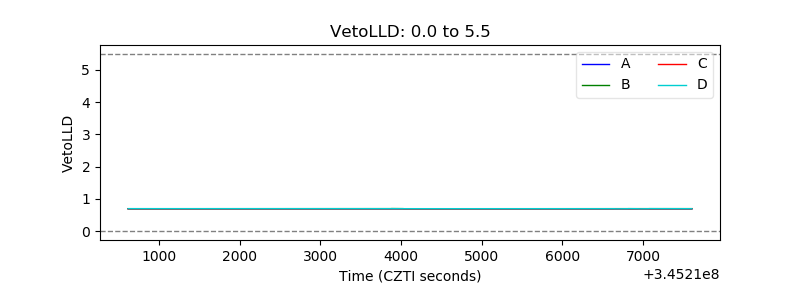 |
| Alpha Counter | 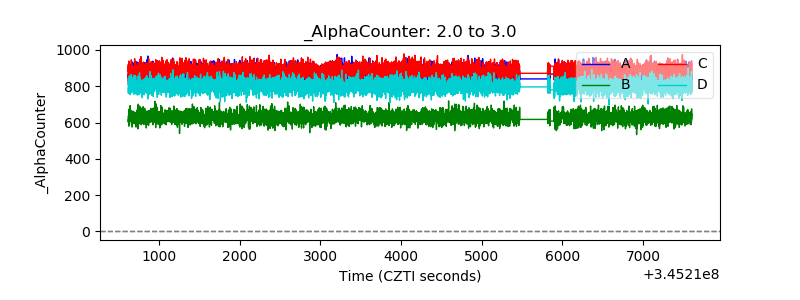 |
| _CPM_Rate | 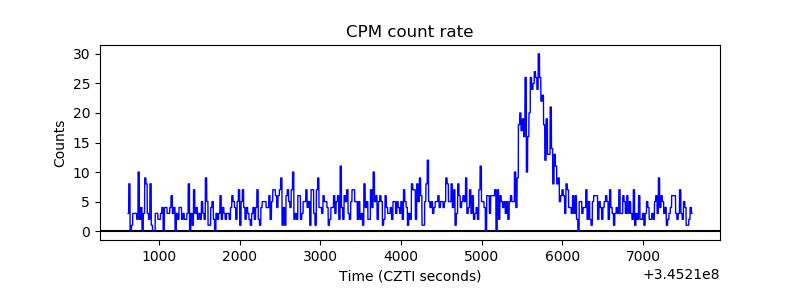 |
| CZT Counter | 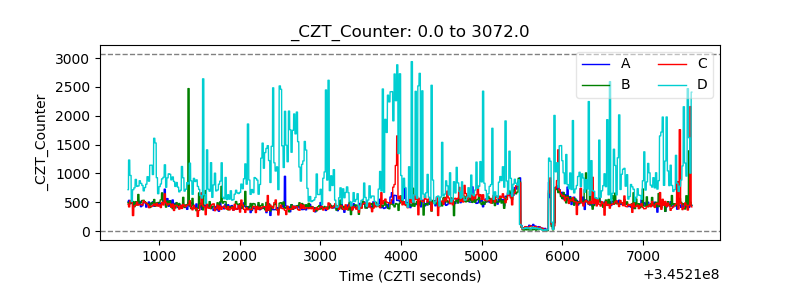 |
| +2.5 Volts monitor | 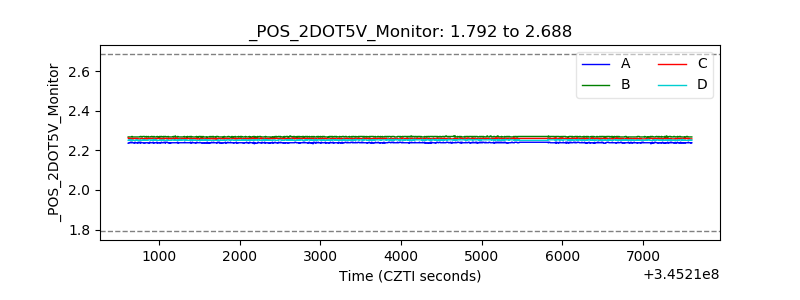 |
| +5 Volts monitor |  |
| _ROLL_ROT | 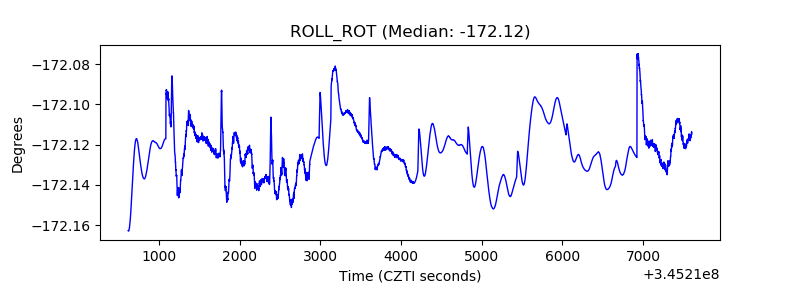 |
| _Roll_DEC | 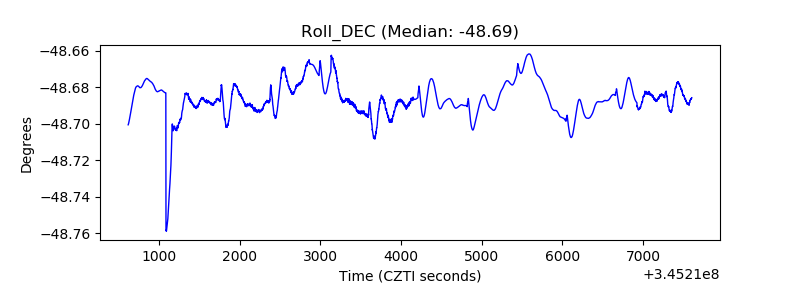 |
| _Roll_RA | 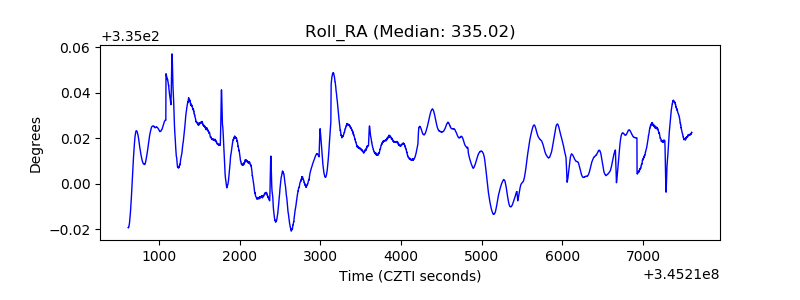 |
| Veto Counter | 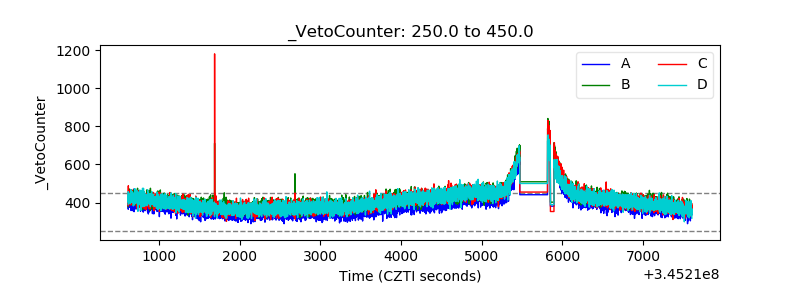 |