| Param | Original file | Final file |
|---|---|---|
| Filename | modeM0/AS1A10_024T01_9000004062_28116cztM0_level2.evt | modeM0/AS1A10_024T01_9000004062_28116cztM0_level2_quad_clean.evt |
| Size (bytes) | 567,558,720 | 106,145,280 |
| Size | 541.3 MB | 101.2 MB |
| Events in quadrant A | 3,435,192 | 695,823 |
| Events in quadrant B | 4,165,237 | 694,765 |
| Events in quadrant C | 3,439,464 | 667,009 |
| Events in quadrant D | 5,648,142 | 643,095 |
| Mode M9 | |||
|---|---|---|---|
| Quadrant | BADHDUFLAG | Total packets | Discarded packets |
| A | 0 | 3 | 0 |
| B | 0 | 3 | 0 |
| C | 0 | 3 | 0 |
| D | 0 | 3 | 0 |
| Mode M0 | |||
|---|---|---|---|
| Quadrant | BADHDUFLAG | Total packets | Discarded packets |
| A | 0 | 15121 | 0 |
| B | 0 | 17149 | 0 |
| C | 0 | 15195 | 0 |
| D | 0 | 21949 | 0 |
| Quadrant | Total seconds | Saturated seconds | Saturation percentage |
|---|---|---|---|
| A | 7377 | 23 | 0.311780% |
| B | 7378 | 81 | 1.097858% |
| C | 7378 | 71 | 0.962320% |
| D | 7377 | 231 | 3.131354% |
Noise dominated data is calculated using 1-second bins in cleaned event files. If a bin has >2000 counts, and if more than 50% of those come from <1% of pixels, then it is considered to be noise-dominated and hence unusable.
| Quadrant | # 1 sec bins | Bins with >0 counts | Bins with >2000 counts | High rate bins dominated by noise | Noise dominated (total time) | Noise dominated (detector-on time) | Marked lightcurve |
|---|---|---|---|---|---|---|---|
| A | 7767 | 7378 | 0 | 0 | 0.00% | 0.00% | 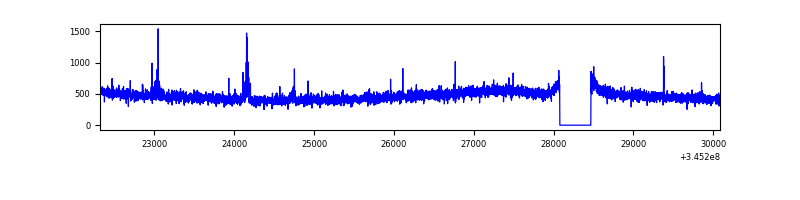 |
| B | 7768 | 7379 | 38 | 38 | 0.49% | 0.51% | 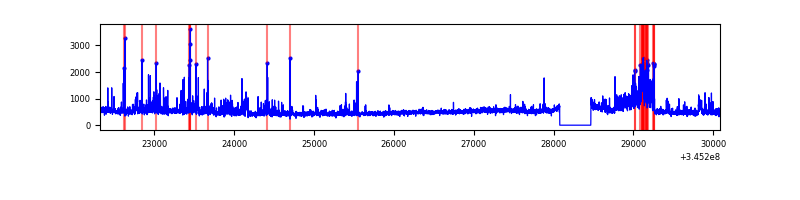 |
| C | 7768 | 7379 | 0 | 0 | 0.00% | 0.00% | 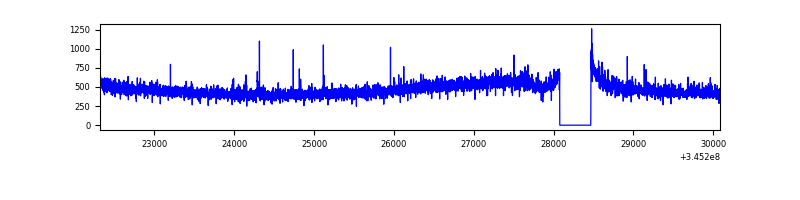 |
| D | 7767 | 7378 | 205 | 205 | 2.64% | 2.78% | 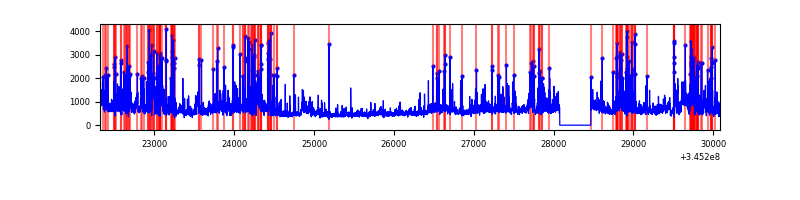 |
Top three noisy pixels from each quadrant. If the there are fewer than three noisy pixels in the level2.evt file, extra rows are filled as -1
| Pixel properties | Quadrant properties | ||||||
|---|---|---|---|---|---|---|---|
| Quadrant | DetID | PixID | Counts | Sigma | Mean | Median | Sigma |
| A | 15 | 174 | 21243 | 114.34 | 879 | 860 | 178.3 |
| A | 13 | 254 | 12718 | 66.52 | 879 | 860 | 178.3 |
| A | 3 | 137 | 8544 | 43.11 | 879 | 860 | 178.3 |
| B | 10 | 245 | 349175 | 2100.93 | 870 | 847 | 165.8 |
| B | 10 | 246 | 94917 | 567.38 | 870 | 847 | 165.8 |
| B | 4 | 200 | 78686 | 469.48 | 870 | 847 | 165.8 |
| C | 14 | 238 | 133273 | 678.52 | 830 | 834 | 195.2 |
| C | 3 | 233 | 54655 | 275.74 | 830 | 834 | 195.2 |
| C | 2 | 16 | 14472 | 69.87 | 830 | 834 | 195.2 |
| D | 1 | 52 | 1363377 | 6832.44 | 832 | 808 | 199.4 |
| D | 7 | 223 | 335468 | 1678.11 | 832 | 808 | 199.4 |
| D | 8 | 195 | 299156 | 1496.03 | 832 | 808 | 199.4 |
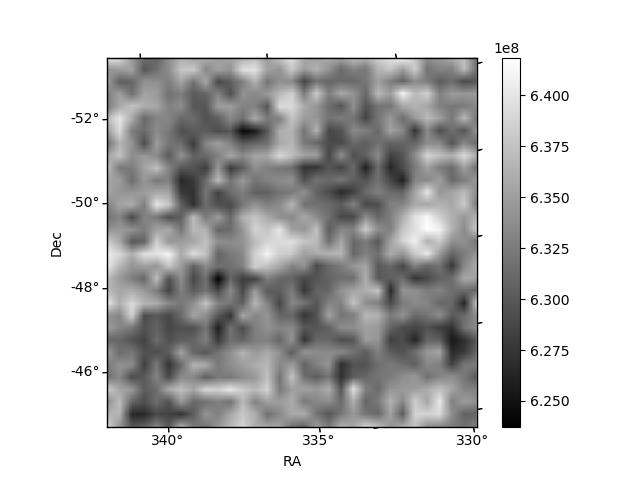
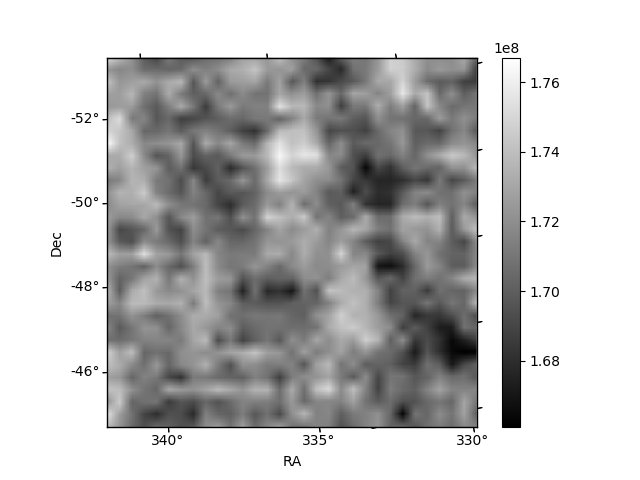
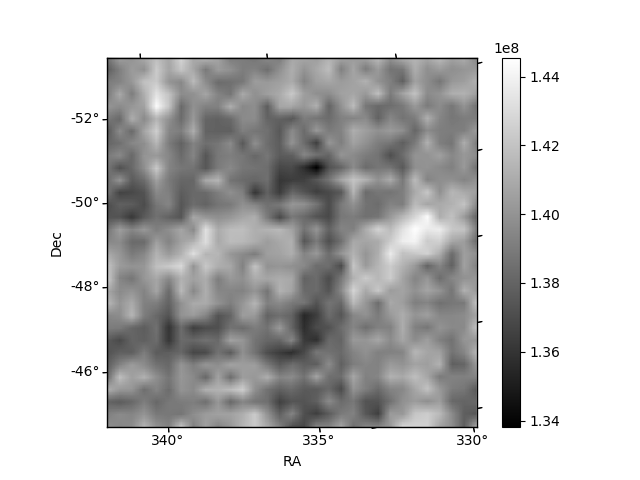
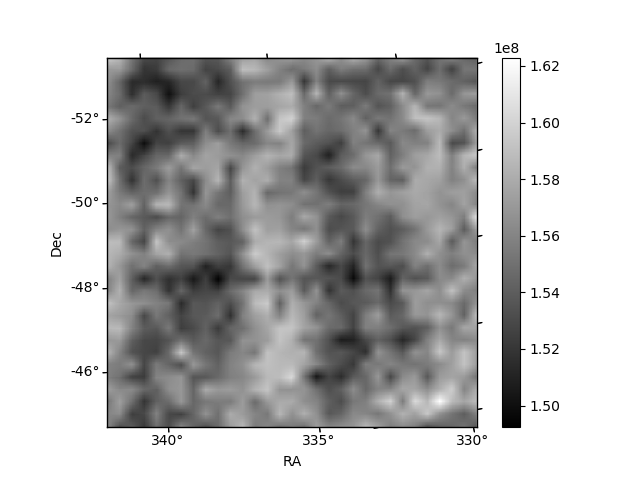
Histogram calculated using DETX and DETY for each event in the final _common_clean file
| Quadrant A | 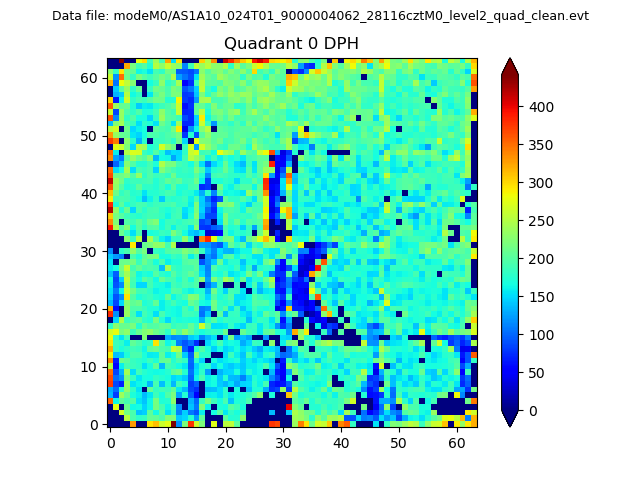 |
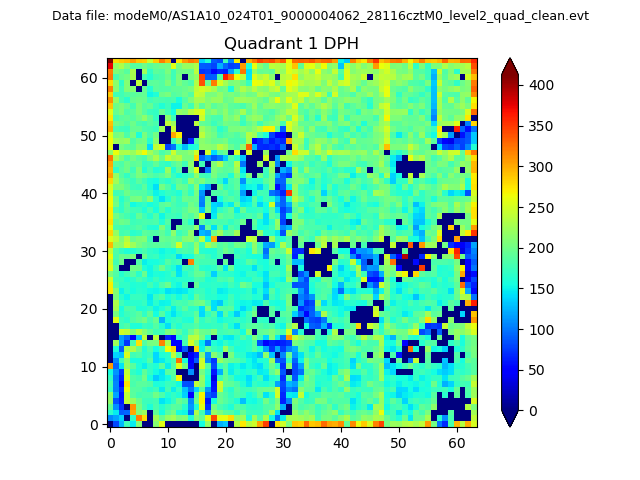 |
Quadrant B |
|---|---|---|---|
| Quadrant D | 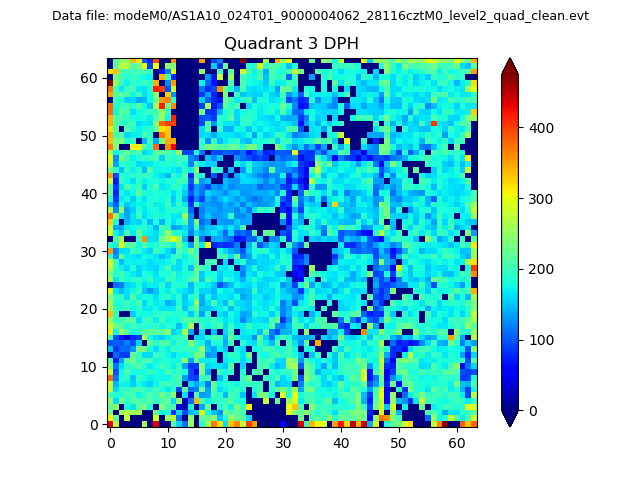 |
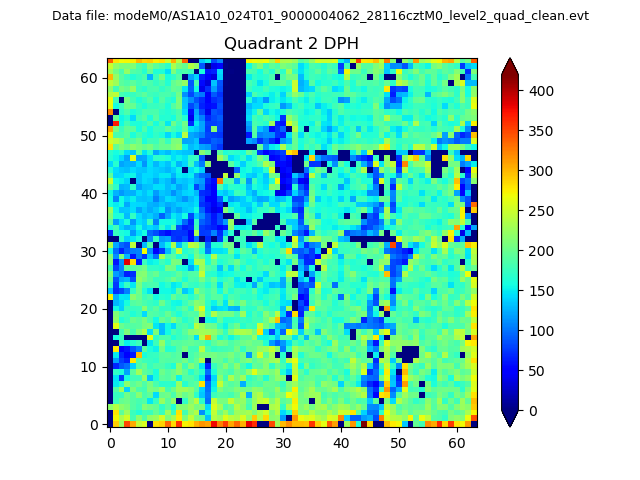 |
Quadrant C |
| Plot type | Count rate plots | Images |
|---|---|---|
| Comparison with Poisson distribution Blue bars denote a histogram of data divided into 1 sec bins. Red curve is a Poisson curve with rate = median count rate of data. |
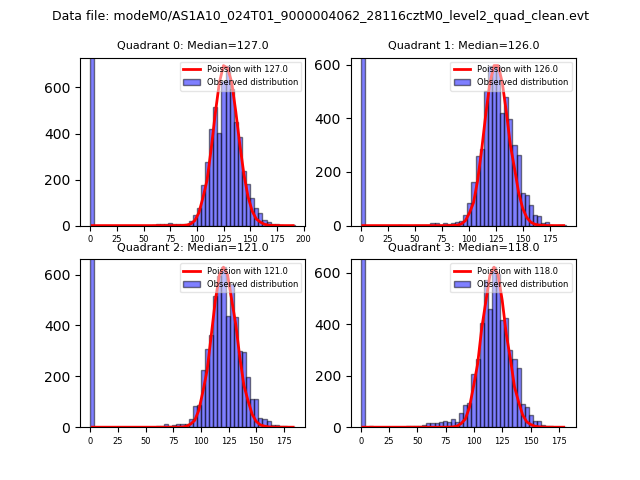 |
 |
| Quadrant-wise count rates Data is divided into 100 sec bins |
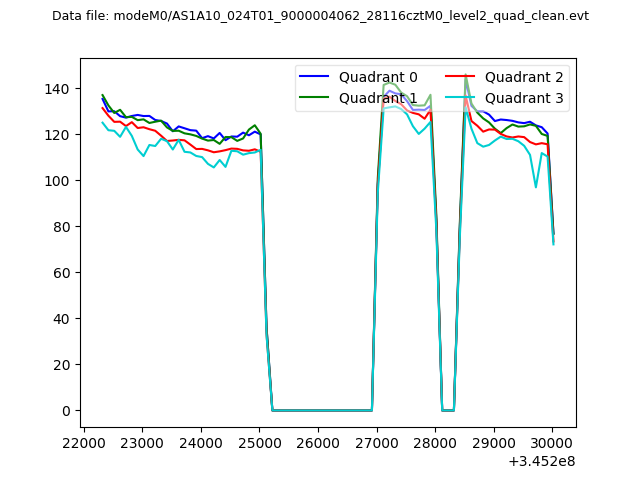 |
|
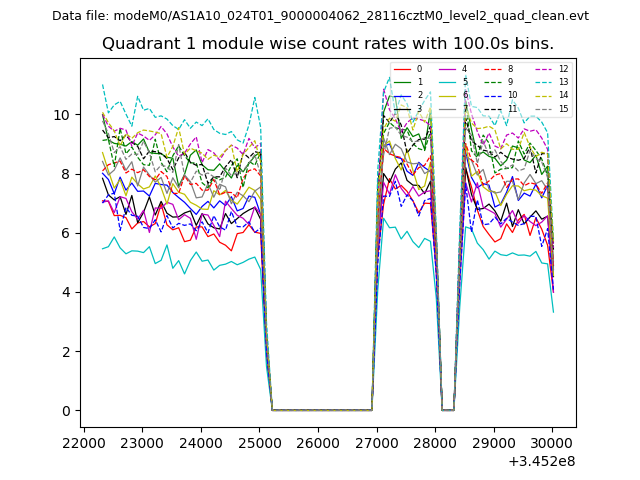
| Module-wise count rates for Quadrant A Data is divided into 100 sec bins |
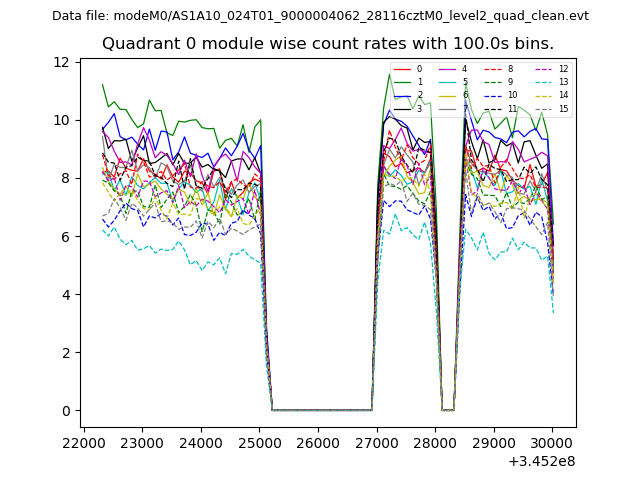 |
 |
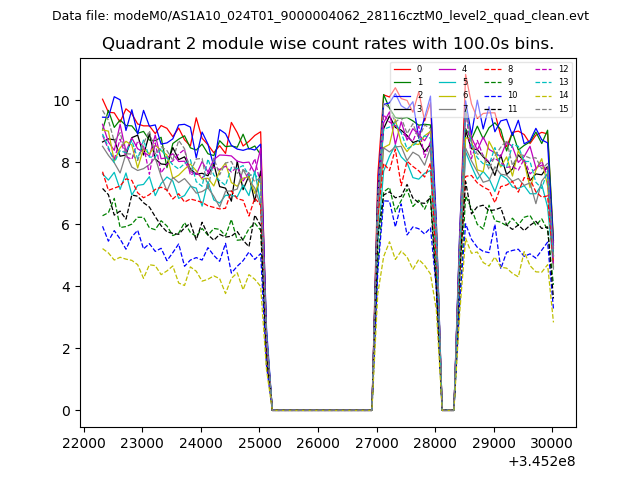
| Module-wise count rates for Quadrant B Data is divided into 100 sec bins |
 |
 |
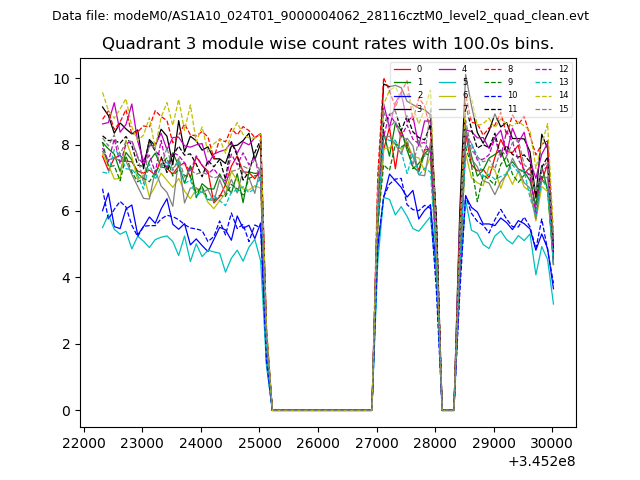
| Module-wise count rates for Quadrant C Data is divided into 100 sec bins |
 |
 |
| Module-wise count rates for Quadrant D Data is divided into 100 sec bins |
 |
 |
| Parameter | Plot |
|---|---|
| CZT HV Monitor | 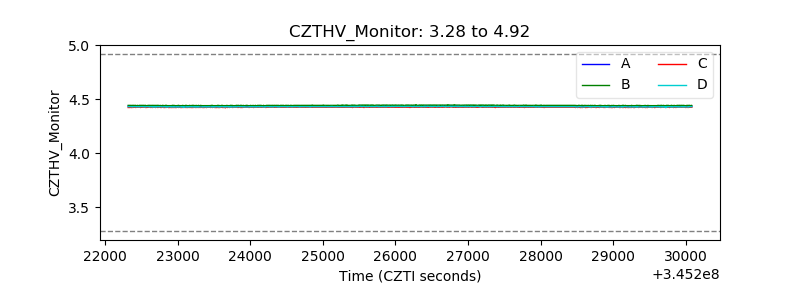 |
| D_VDD | 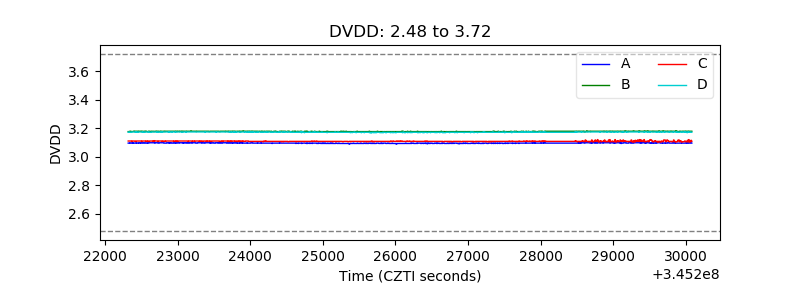 |
| Temperature 1 | 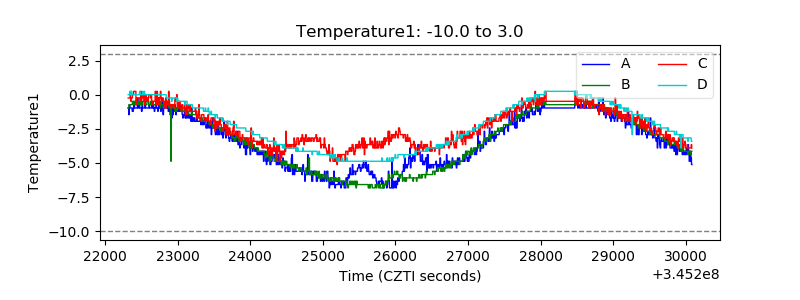 |
| Veto HV Monitor | 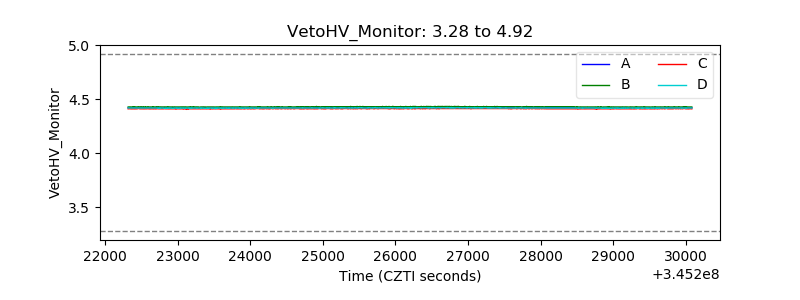 |
| Veto LLD | 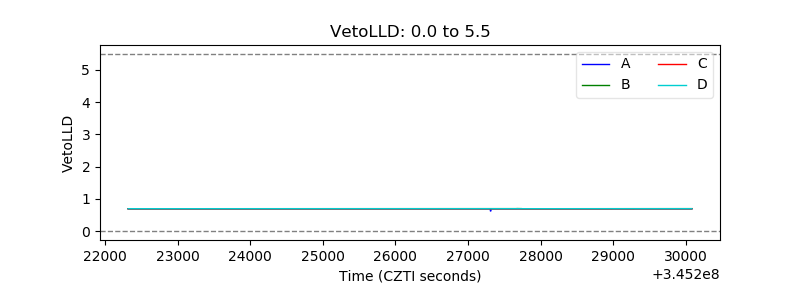 |
| Alpha Counter | 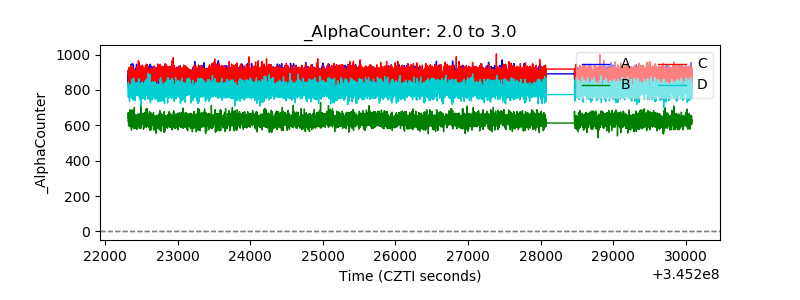 |
| _CPM_Rate | 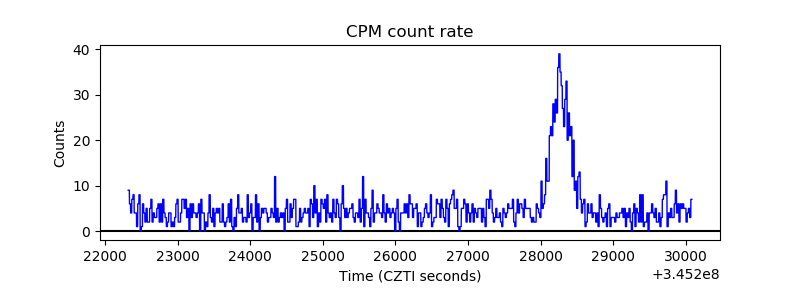 |
| CZT Counter | 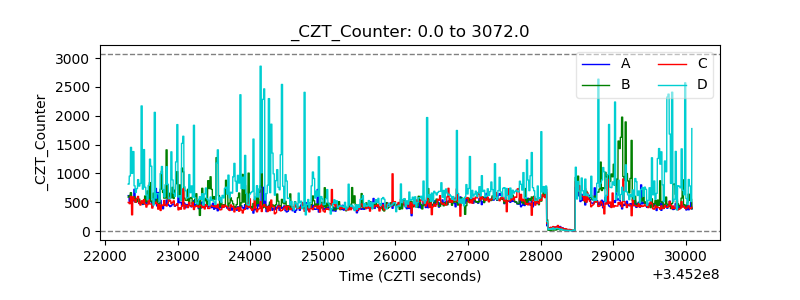 |
| +2.5 Volts monitor | 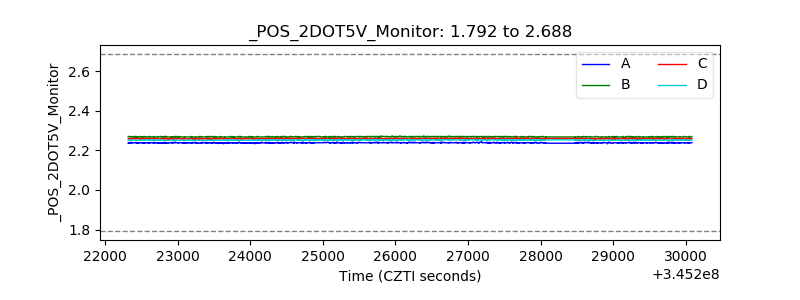 |
| +5 Volts monitor |  |
| _ROLL_ROT | 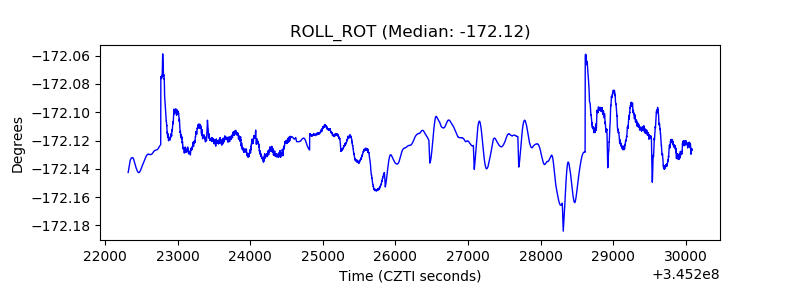 |
| _Roll_DEC | 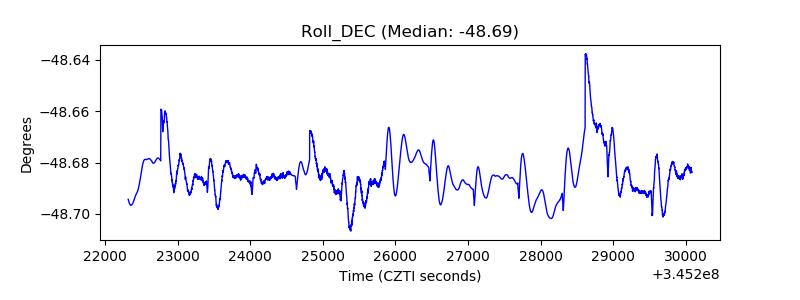 |
| _Roll_RA | 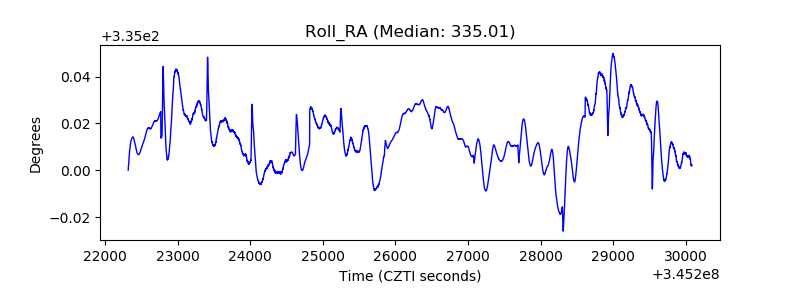 |
| Veto Counter | 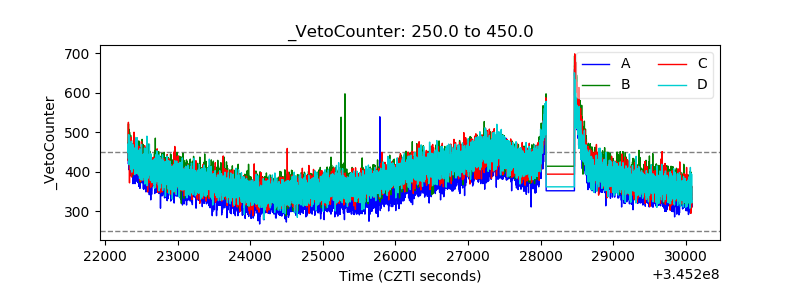 |