| Param | Original file | Final file |
|---|---|---|
| Filename | modeM0/AS1A10_024T01_9000004062_28118cztM0_level2.evt | modeM0/AS1A10_024T01_9000004062_28118cztM0_level2_quad_clean.evt |
| Size (bytes) | 533,459,520 | 93,697,920 |
| Size | 508.7 MB | 89.4 MB |
| Events in quadrant A | 3,106,264 | 614,283 |
| Events in quadrant B | 3,751,231 | 612,843 |
| Events in quadrant C | 3,119,502 | 588,389 |
| Events in quadrant D | 5,722,006 | 552,240 |
| Mode M9 | |||
|---|---|---|---|
| Quadrant | BADHDUFLAG | Total packets | Discarded packets |
| A | 0 | 5 | 0 |
| B | 0 | 5 | 0 |
| C | 0 | 5 | 0 |
| D | 0 | 5 | 0 |
| Mode M0 | |||
|---|---|---|---|
| Quadrant | BADHDUFLAG | Total packets | Discarded packets |
| A | 0 | 13743 | 0 |
| B | 0 | 15563 | 0 |
| C | 0 | 13756 | 0 |
| D | 0 | 21593 | 0 |
| Quadrant | Total seconds | Saturated seconds | Saturation percentage |
|---|---|---|---|
| A | 6741 | 27 | 0.400534% |
| B | 6741 | 100 | 1.483459% |
| C | 6741 | 60 | 0.890076% |
| D | 6742 | 432 | 6.407594% |
Noise dominated data is calculated using 1-second bins in cleaned event files. If a bin has >2000 counts, and if more than 50% of those come from <1% of pixels, then it is considered to be noise-dominated and hence unusable.
| Quadrant | # 1 sec bins | Bins with >0 counts | Bins with >2000 counts | High rate bins dominated by noise | Noise dominated (total time) | Noise dominated (detector-on time) | Marked lightcurve |
|---|---|---|---|---|---|---|---|
| A | 7251 | 6742 | 0 | 0 | 0.00% | 0.00% | 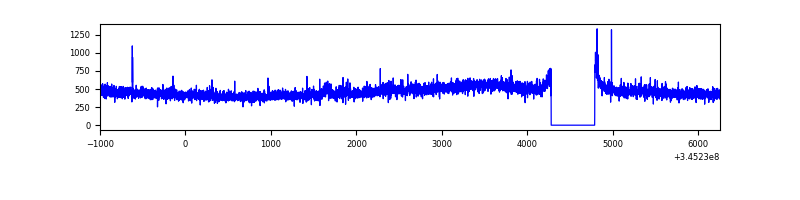 |
| B | 7251 | 6742 | 41 | 41 | 0.57% | 0.61% | 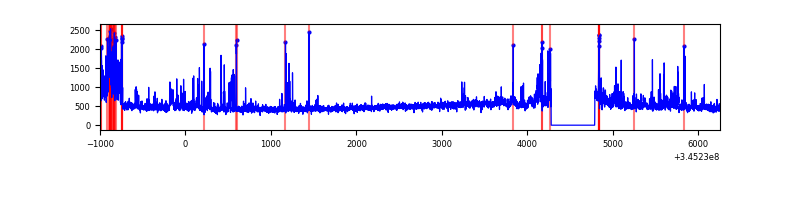 |
| C | 7251 | 6742 | 0 | 0 | 0.00% | 0.00% | 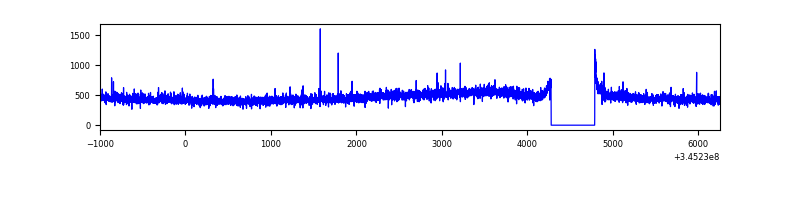 |
| D | 7252 | 6743 | 367 | 367 | 5.06% | 5.44% | 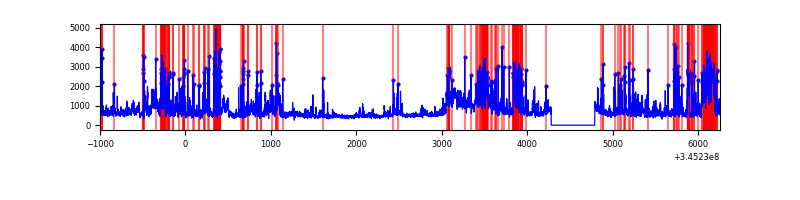 |
Top three noisy pixels from each quadrant. If the there are fewer than three noisy pixels in the level2.evt file, extra rows are filled as -1
| Pixel properties | Quadrant properties | ||||||
|---|---|---|---|---|---|---|---|
| Quadrant | DetID | PixID | Counts | Sigma | Mean | Median | Sigma |
| A | 6 | 16 | 12788 | 73.35 | 797 | 780 | 163.7 |
| A | 13 | 254 | 12109 | 69.21 | 797 | 780 | 163.7 |
| A | 3 | 137 | 7655 | 42.0 | 797 | 780 | 163.7 |
| B | 10 | 245 | 283216 | 1874.78 | 791 | 770 | 150.7 |
| B | 0 | 190 | 63332 | 415.27 | 791 | 770 | 150.7 |
| B | 4 | 200 | 53782 | 351.88 | 791 | 770 | 150.7 |
| C | 14 | 238 | 121561 | 679.51 | 755 | 758 | 177.8 |
| C | 3 | 233 | 35663 | 196.34 | 755 | 758 | 177.8 |
| C | 2 | 16 | 10262 | 53.46 | 755 | 758 | 177.8 |
| D | 1 | 52 | 1354483 | 7554.54 | 747 | 725 | 179.2 |
| D | 7 | 80 | 443531 | 2471.04 | 747 | 725 | 179.2 |
| D | 2 | 250 | 334589 | 1863.1 | 747 | 725 | 179.2 |
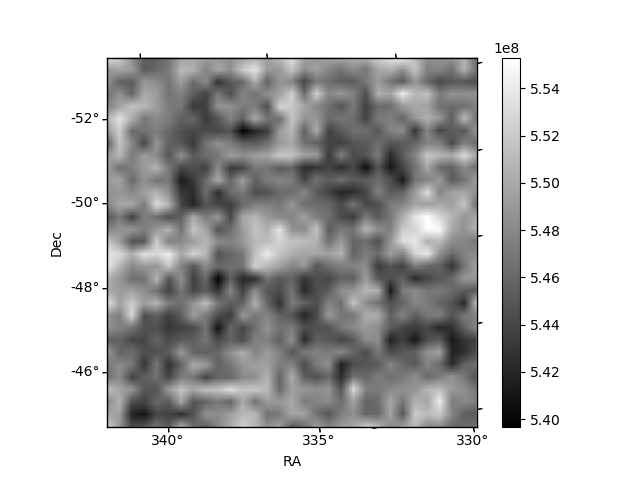
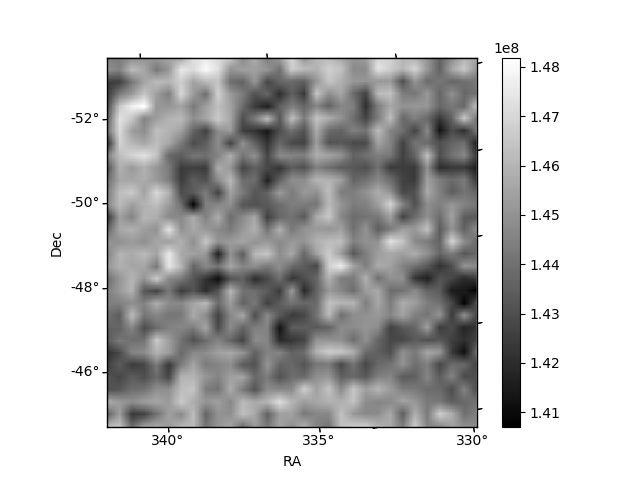
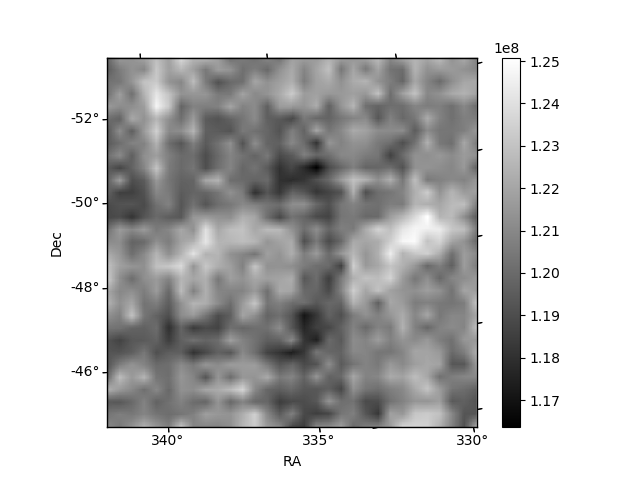
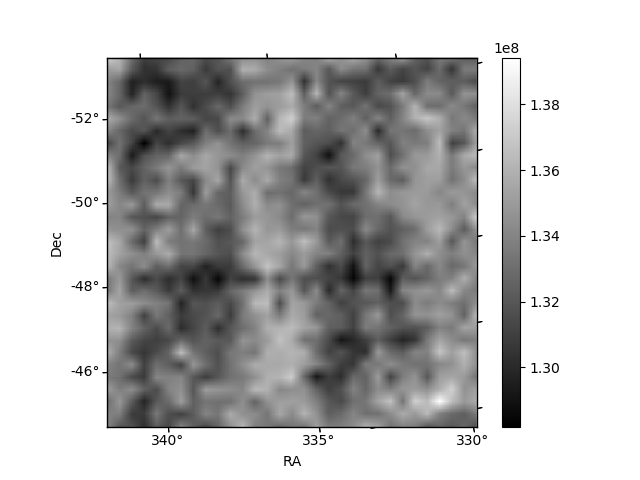
Histogram calculated using DETX and DETY for each event in the final _common_clean file
| Quadrant A | 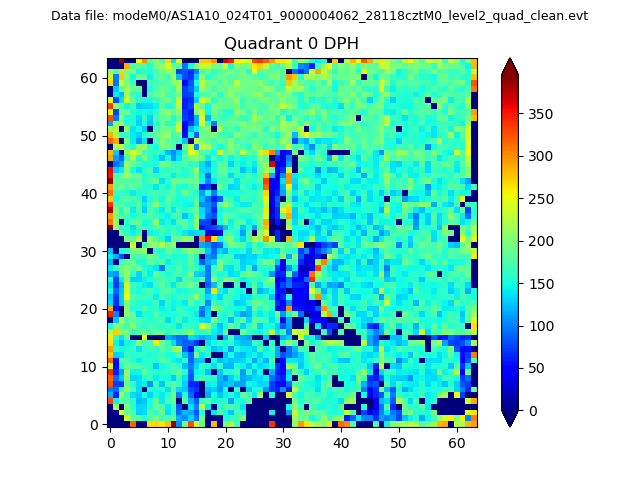 |
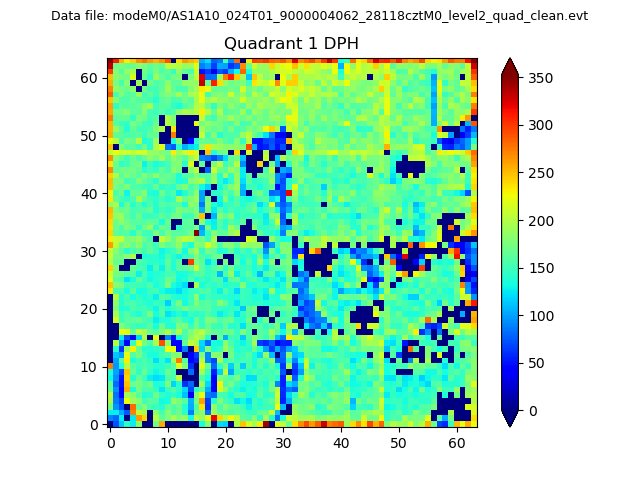 |
Quadrant B |
|---|---|---|---|
| Quadrant D | 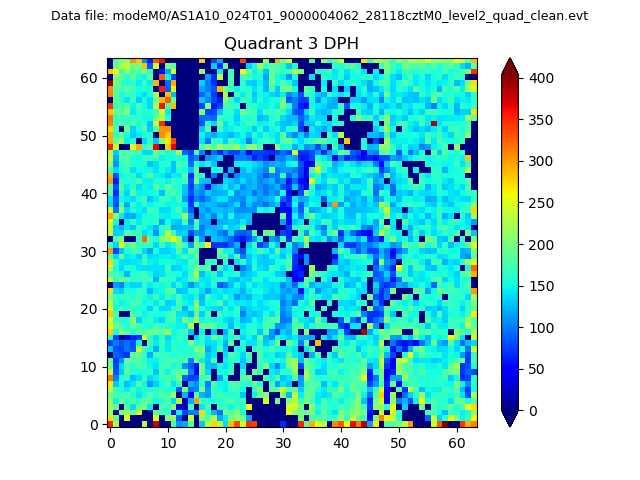 |
 |
Quadrant C |
| Plot type | Count rate plots | Images |
|---|---|---|
| Comparison with Poisson distribution Blue bars denote a histogram of data divided into 1 sec bins. Red curve is a Poisson curve with rate = median count rate of data. |
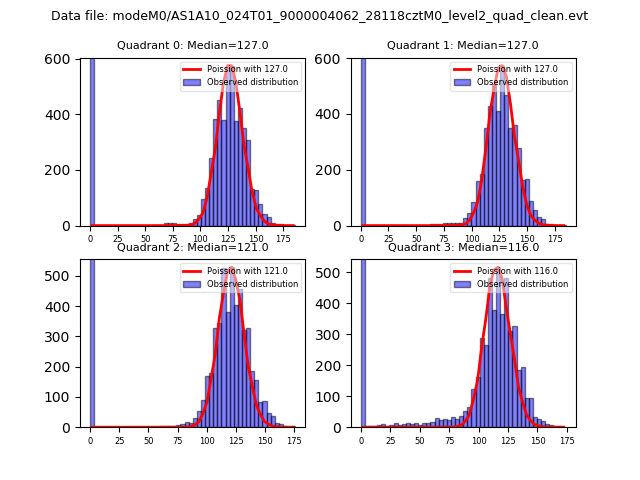 |
 |
| Quadrant-wise count rates Data is divided into 100 sec bins |
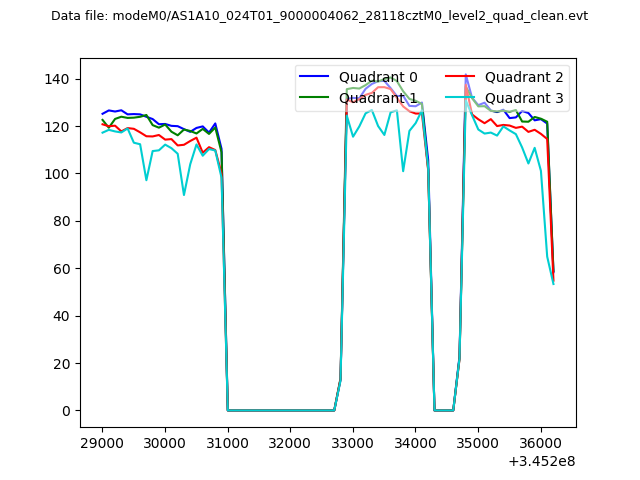 |
|
| Module-wise count rates for Quadrant A Data is divided into 100 sec bins |
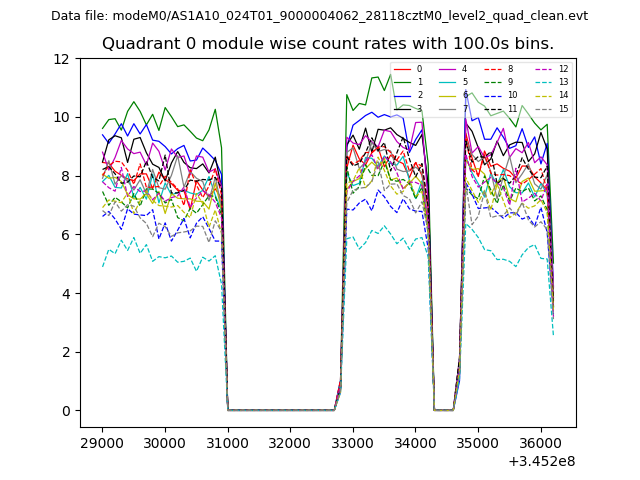 |
 |
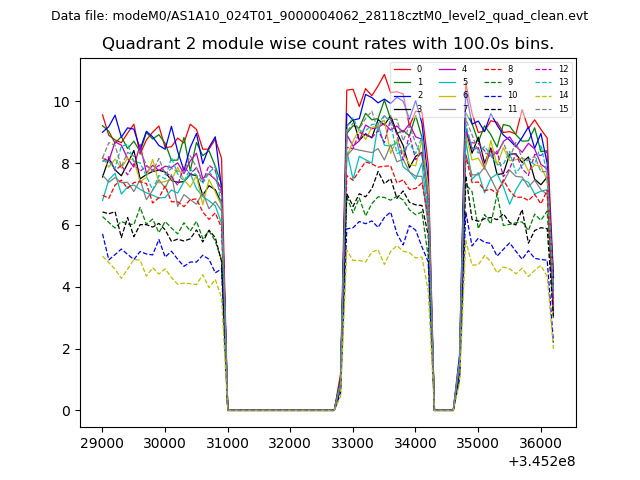
| Module-wise count rates for Quadrant B Data is divided into 100 sec bins |
 |
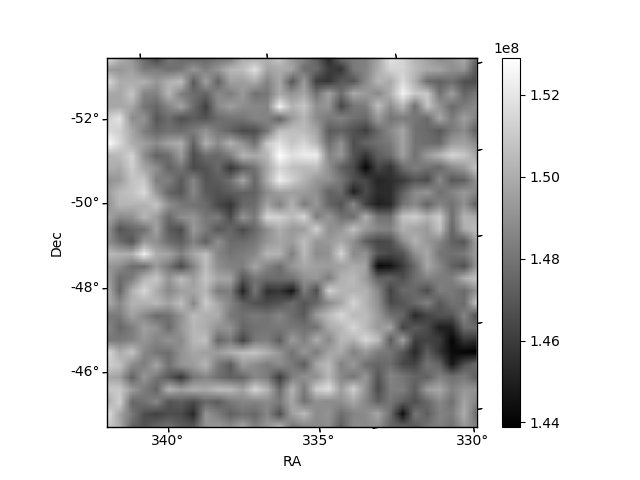 |
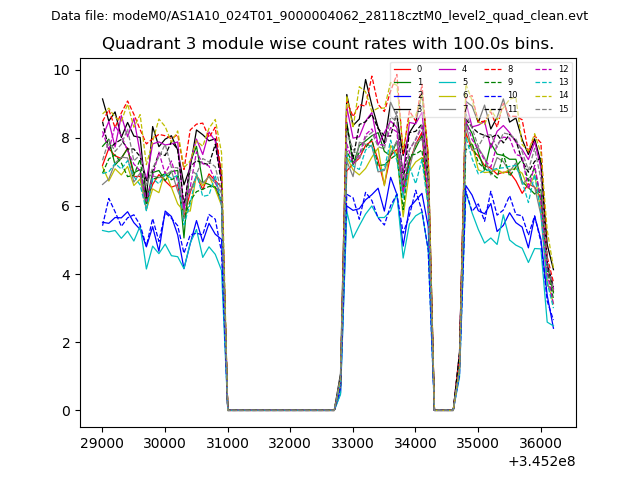
| Module-wise count rates for Quadrant C Data is divided into 100 sec bins |
 |
 |
| Module-wise count rates for Quadrant D Data is divided into 100 sec bins |
 |
 |
| Parameter | Plot |
|---|---|
| CZT HV Monitor | 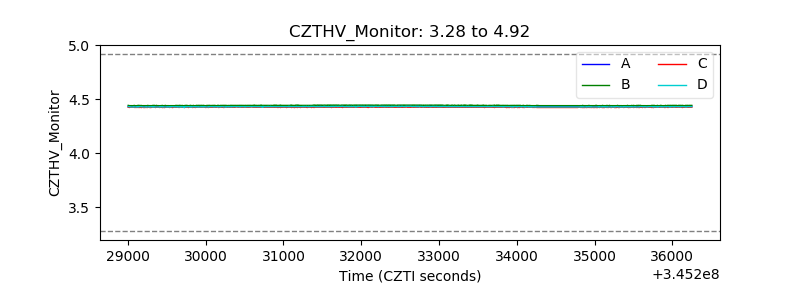 |
| D_VDD | 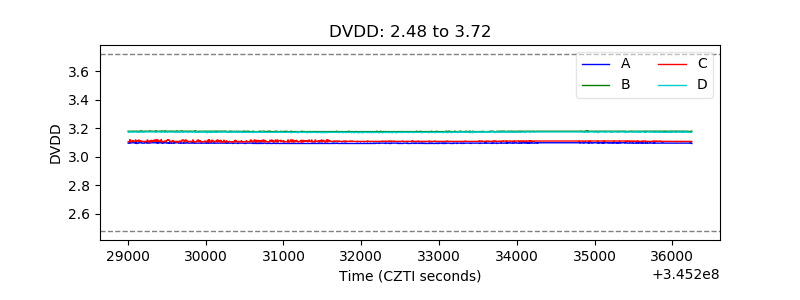 |
| Temperature 1 | 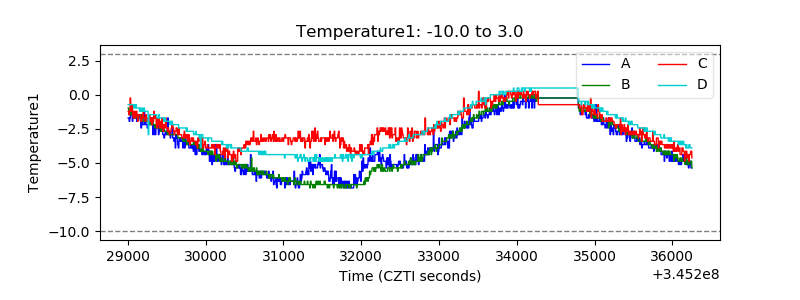 |
| Veto HV Monitor | 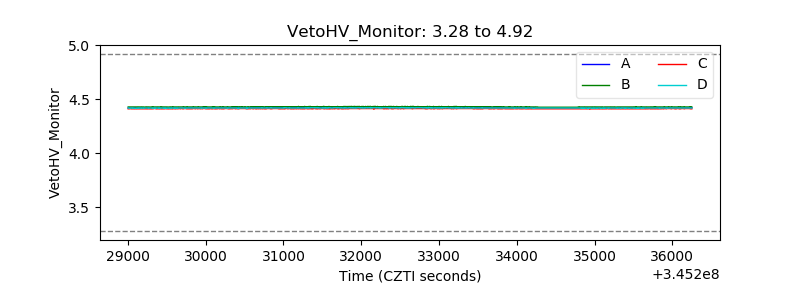 |
| Veto LLD | 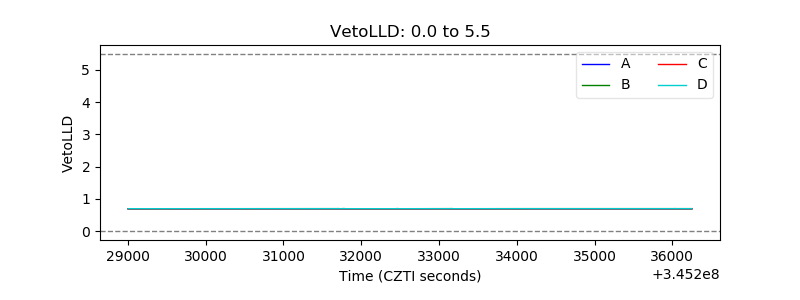 |
| Alpha Counter | 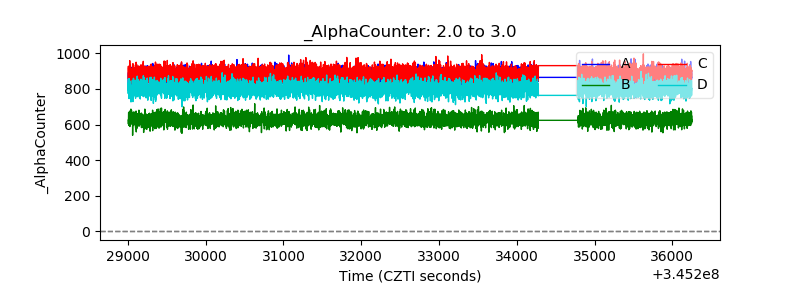 |
| _CPM_Rate | 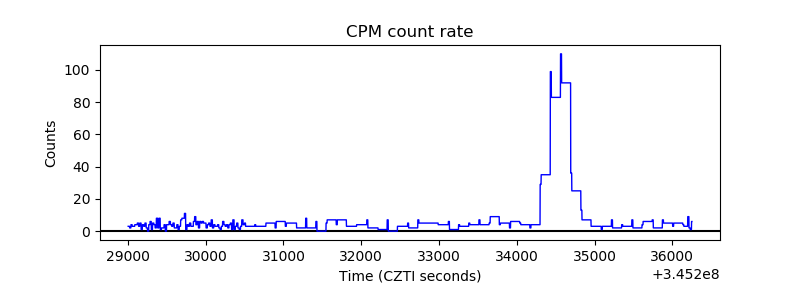 |
| CZT Counter |  |
| +2.5 Volts monitor | 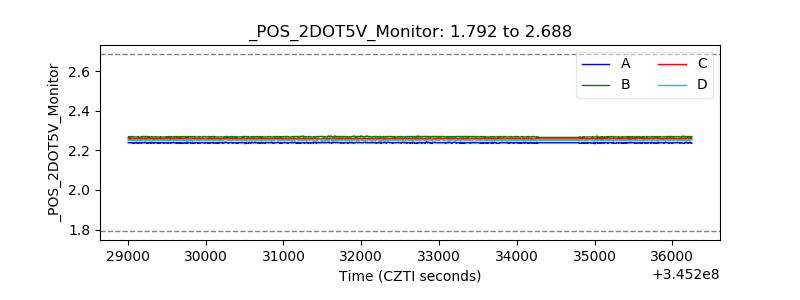 |
| +5 Volts monitor |  |
| _ROLL_ROT | 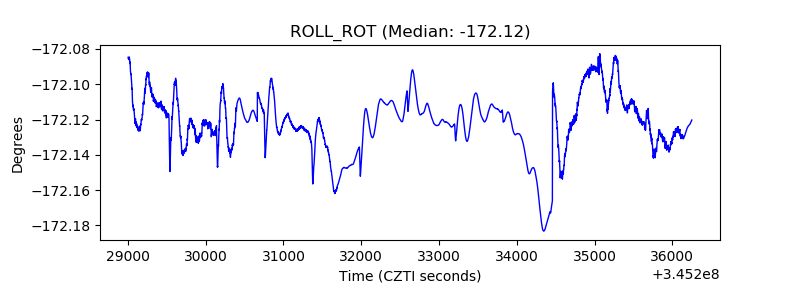 |
| _Roll_DEC | 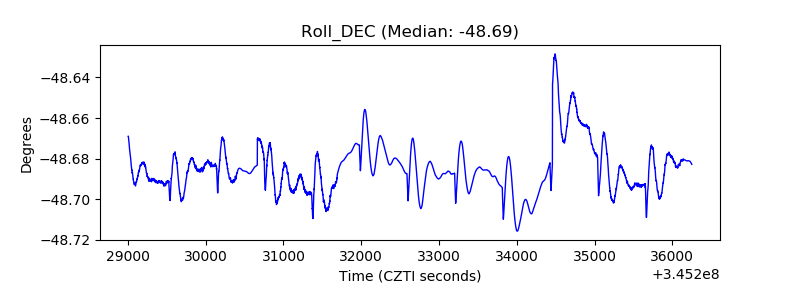 |
| _Roll_RA |  |
| Veto Counter | 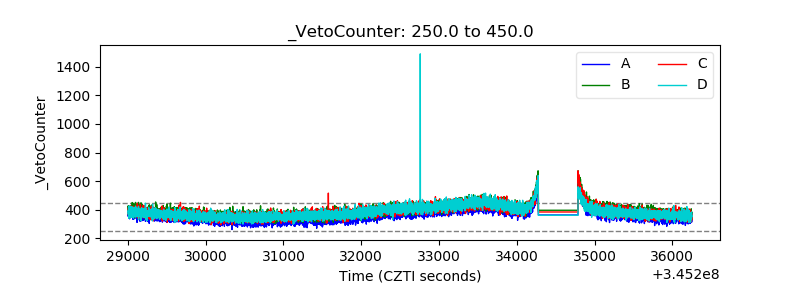 |