| Param | Original file | Final file |
|---|---|---|
| Filename | modeM0/AS1A10_090T14_9000004064cztM0_level2.fits | modeM0/AS1A10_090T14_9000004064cztM0_level2_quad_clean.evt |
| Size (bytes) | 478,604,160 | 396,135,360 |
| Size | 456.4 MB | 377.8 MB |
| Events in quadrant A | 3,057,492 | 2,370,336 |
| Events in quadrant B | 2,907,132 | 2,355,944 |
| Events in quadrant C | 2,902,336 | 2,206,169 |
| Events in quadrant D | 2,396,800 | 1,833,007 |
| Mode M9 | |||
|---|---|---|---|
| Quadrant | BADHDUFLAG | Total packets | Discarded packets |
| A | 0 | 101 | 0 |
| B | 0 | 101 | 0 |
| C | 0 | 101 | 0 |
| D | 0 | 101 | 0 |
| Mode SS | |||
|---|---|---|---|
| Quadrant | BADHDUFLAG | Total packets | Discarded packets |
| A | 0 | 956 | 0 |
| B | 0 | 956 | 0 |
| C | 0 | 956 | 0 |
| D | 0 | 956 | 0 |
| Mode M0 | |||
|---|---|---|---|
| Quadrant | BADHDUFLAG | Total packets | Discarded packets |
| A | 0 | 98847 | 0 |
| B | 0 | 103515 | 0 |
| C | 0 | 99230 | 0 |
| D | 0 | 163587 | 0 |
| Quadrant | Total seconds | Saturated seconds | Saturation percentage |
|---|---|---|---|
| A | 47058 | 476 | 1.011518% |
| B | 47058 | 695 | 1.476901% |
| C | 47058 | 640 | 1.360024% |
| D | 47058 | 5751 | 12.221089% |
Noise dominated data is calculated using 1-second bins in cleaned event files. If a bin has >2000 counts, and if more than 50% of those come from <1% of pixels, then it is considered to be noise-dominated and hence unusable.
| Quadrant | # 1 sec bins | Bins with >0 counts | Bins with >2000 counts | High rate bins dominated by noise | Noise dominated (total time) | Noise dominated (detector-on time) | Marked lightcurve |
|---|---|---|---|---|---|---|---|
| A | 57003 | 47055 | 0 | 0 | 0.00% | 0.00% | 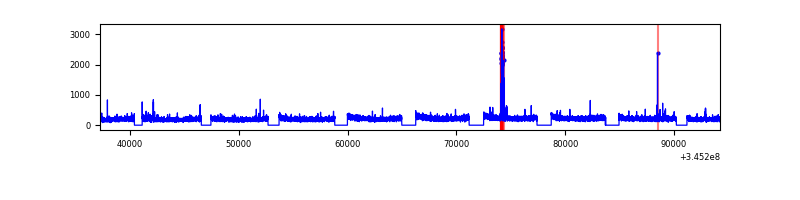 |
| B | 57003 | 47051 | 0 | 0 | 0.00% | 0.00% | 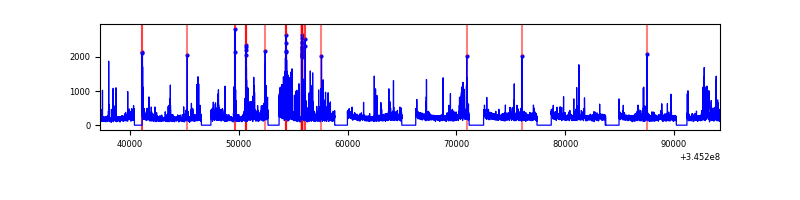 |
| C | 57003 | 47053 | 0 | 0 | 0.00% | 0.00% |  |
| D | 57003 | 46942 | 0 | 0 | 0.00% | 0.00% |  |
Top three noisy pixels from each quadrant. If the there are fewer than three noisy pixels in the level2.evt file, extra rows are filled as -1
| Pixel properties | Quadrant properties | ||||||
|---|---|---|---|---|---|---|---|
| Quadrant | DetID | PixID | Counts | Sigma | Mean | Median | Sigma |
| A | 0 | 29 | 2481 | 8.96 | 797 | 754 | 192.8 |
| A | 7 | 110 | 2458 | 8.84 | 797 | 754 | 192.8 |
| A | 9 | 19 | 2283 | 7.93 | 797 | 754 | 192.8 |
| B | 2 | 9 | 2273 | 10.27 | 770 | 740 | 149.3 |
| B | 5 | 128 | 1964 | 8.2 | 770 | 740 | 149.3 |
| B | 2 | 8 | 1898 | 7.76 | 770 | 740 | 149.3 |
| C | 1 | 81 | 2261 | 8.03 | 765 | 720 | 191.8 |
| C | 1 | 80 | 2210 | 7.77 | 765 | 720 | 191.8 |
| C | 12 | 241 | 2024 | 6.8 | 765 | 720 | 191.8 |
| D | 7 | 3 | 1745 | 6.16 | 685 | 625 | 181.9 |
| D | 10 | 189 | 1701 | 5.92 | 685 | 625 | 181.9 |
| D | 3 | 14 | 1675 | 5.77 | 685 | 625 | 181.9 |
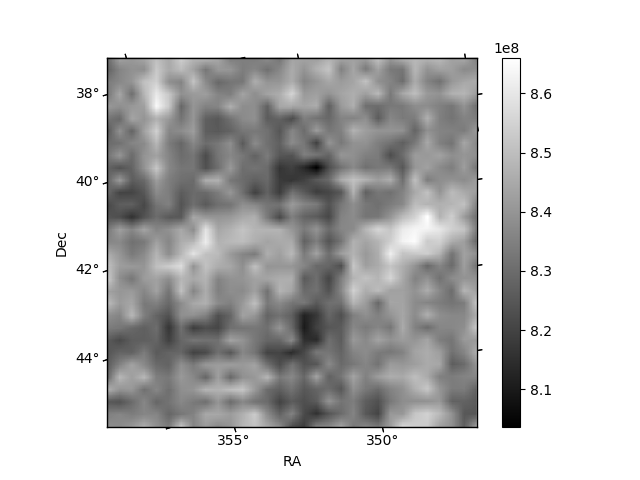
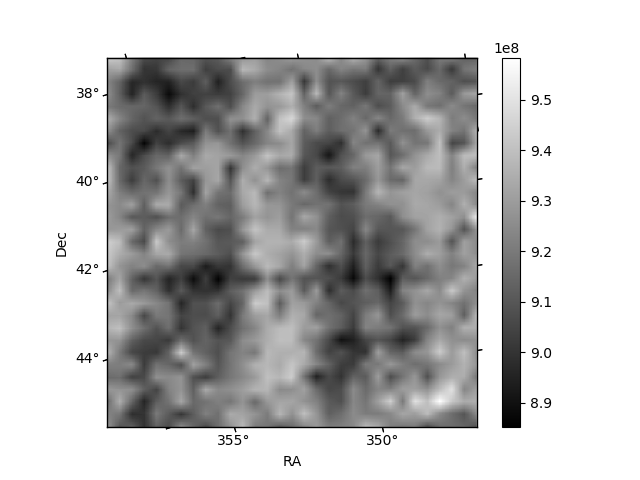
Histogram calculated using DETX and DETY for each event in the final _common_clean file
| Quadrant A | 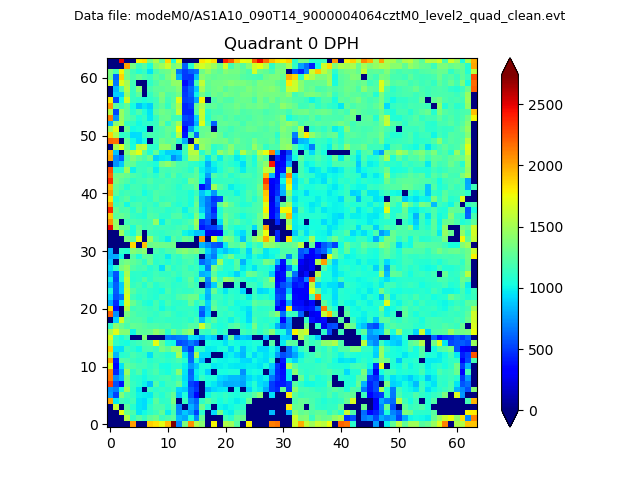 |
 |
Quadrant B |
|---|---|---|---|
| Quadrant D | 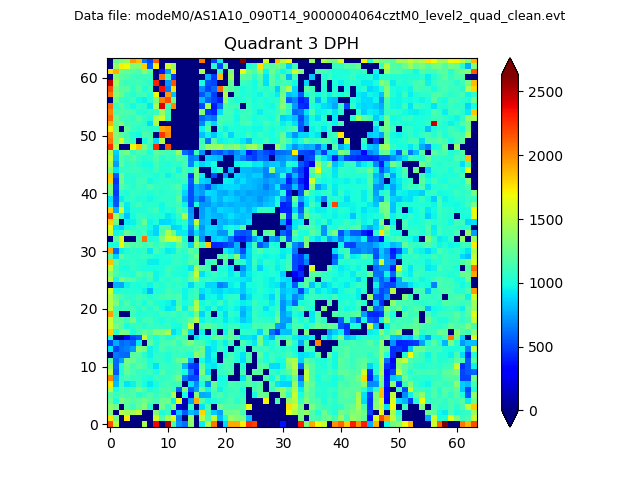 |
 |
Quadrant C |
| Plot type | Count rate plots | Images |
|---|---|---|
| Comparison with Poisson distribution Blue bars denote a histogram of data divided into 1 sec bins. Red curve is a Poisson curve with rate = median count rate of data. |
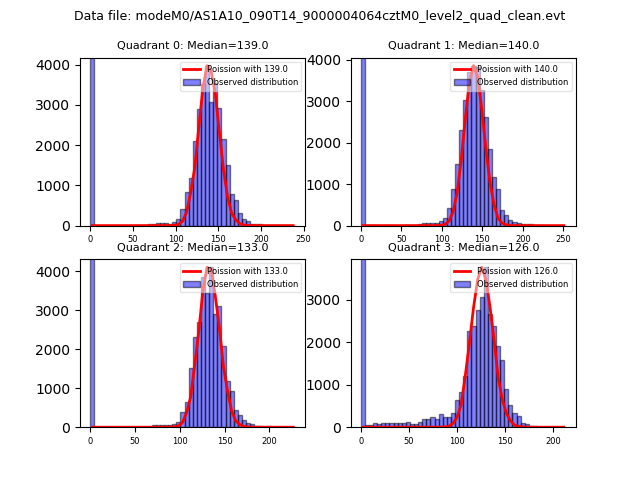 |
 |
| Quadrant-wise count rates Data is divided into 100 sec bins |
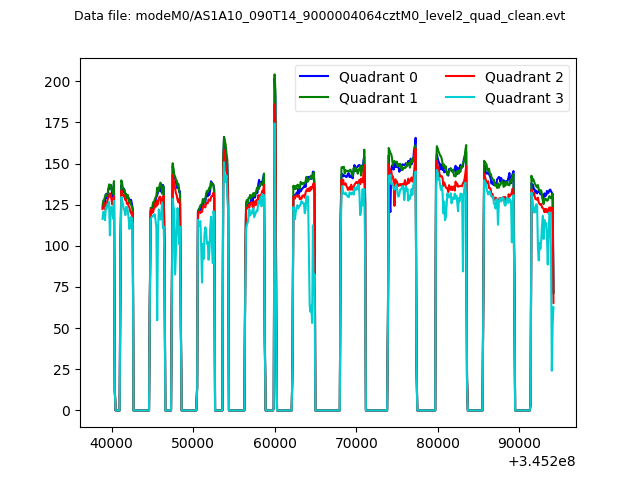 |
|
| Module-wise count rates for Quadrant A Data is divided into 100 sec bins |
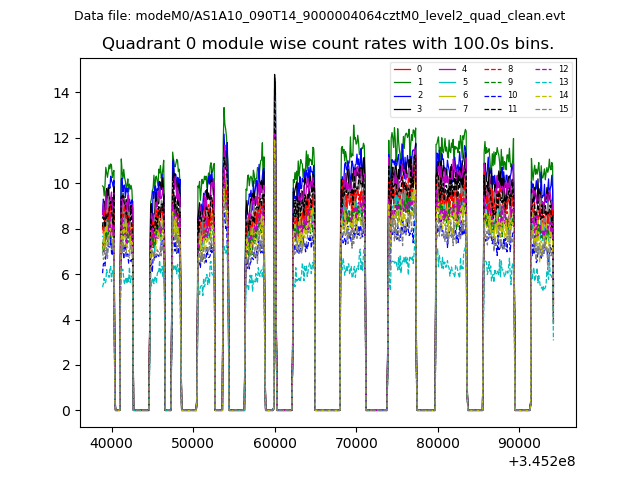 |
 |
| Module-wise count rates for Quadrant B Data is divided into 100 sec bins |
 |
 |
| Module-wise count rates for Quadrant C Data is divided into 100 sec bins |
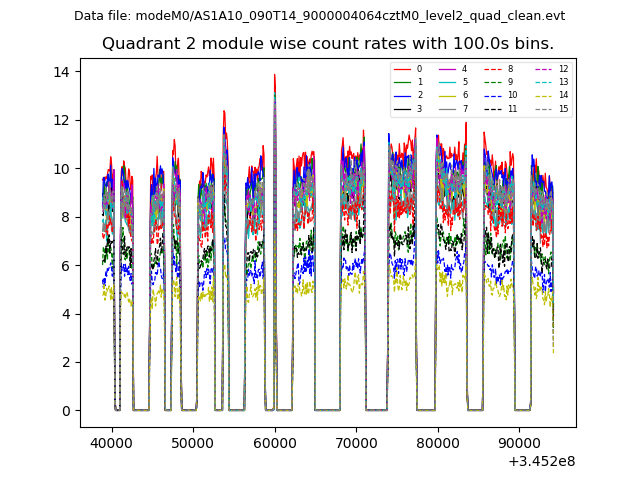 |
 |
| Module-wise count rates for Quadrant D Data is divided into 100 sec bins |
 |
 |
| Parameter | Plot |
|---|---|
| CZT HV Monitor |  |
| D_VDD | 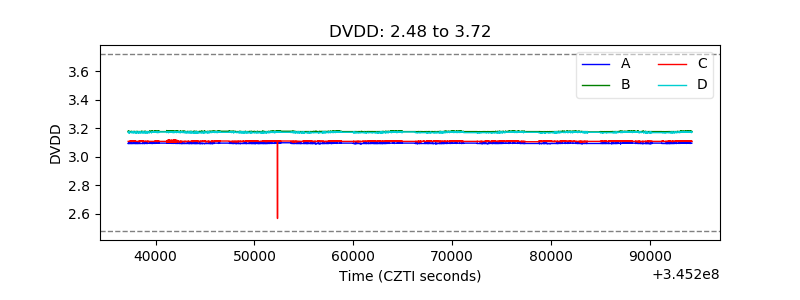 |
| Temperature 1 |  |
| Veto HV Monitor |  |
| Veto LLD | 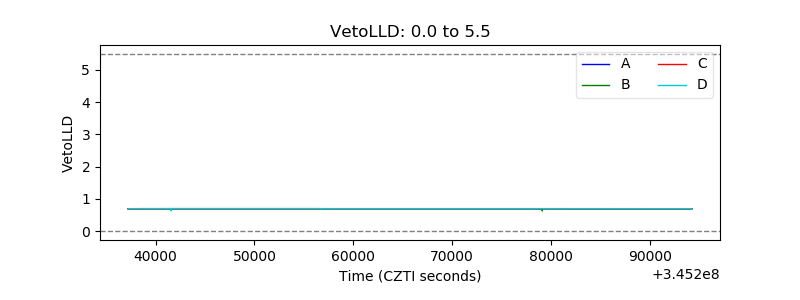 |
| Alpha Counter |  |
| _CPM_Rate |  |
| CZT Counter |  |
| +2.5 Volts monitor |  |
| +5 Volts monitor |  |
| _ROLL_ROT | 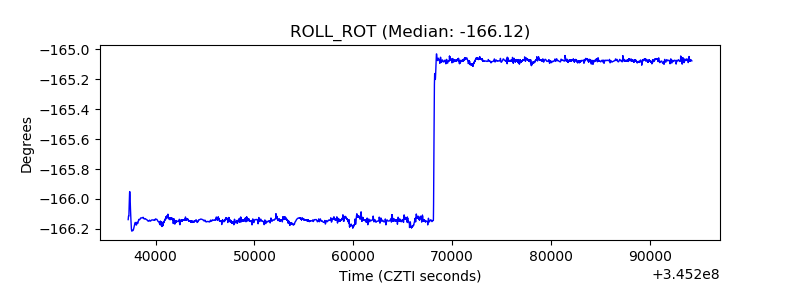 |
| _Roll_DEC | 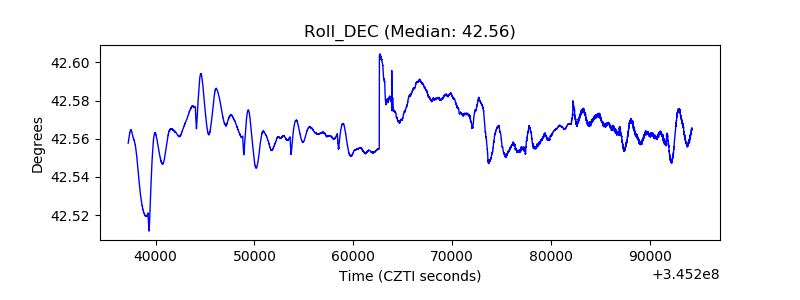 |
| _Roll_RA |  |
| Veto Counter |  |