| Param | Original file | Final file |
|---|---|---|
| Filename | modeM0/AS1A10_090T14_9000004064_28118cztM0_level2.evt | modeM0/AS1A10_090T14_9000004064_28118cztM0_level2_quad_clean.evt |
| Size (bytes) | 237,600,000 | 35,772,480 |
| Size | 226.6 MB | 34.1 MB |
| Events in quadrant A | 1,558,594 | 217,663 |
| Events in quadrant B | 1,667,856 | 217,450 |
| Events in quadrant C | 1,562,310 | 211,034 |
| Events in quadrant D | 2,180,845 | 202,033 |
| Mode M9 | |||
|---|---|---|---|
| Quadrant | BADHDUFLAG | Total packets | Discarded packets |
| A | 0 | 7 | 0 |
| B | 0 | 7 | 0 |
| C | 0 | 7 | 0 |
| D | 0 | 7 | 0 |
| Mode M0 | |||
|---|---|---|---|
| Quadrant | BADHDUFLAG | Total packets | Discarded packets |
| A | 0 | 6738 | 0 |
| B | 0 | 7102 | 0 |
| C | 0 | 6768 | 0 |
| D | 0 | 8717 | 0 |
| Quadrant | Total seconds | Saturated seconds | Saturation percentage |
|---|---|---|---|
| A | 3303 | 7 | 0.211929% |
| B | 3303 | 39 | 1.180745% |
| C | 3303 | 29 | 0.877990% |
| D | 3303 | 119 | 3.602785% |
Noise dominated data is calculated using 1-second bins in cleaned event files. If a bin has >2000 counts, and if more than 50% of those come from <1% of pixels, then it is considered to be noise-dominated and hence unusable.
| Quadrant | # 1 sec bins | Bins with >0 counts | Bins with >2000 counts | High rate bins dominated by noise | Noise dominated (total time) | Noise dominated (detector-on time) | Marked lightcurve |
|---|---|---|---|---|---|---|---|
| A | 4023 | 3304 | 0 | 0 | 0.00% | 0.00% |  |
| B | 4023 | 3304 | 30 | 30 | 0.75% | 0.91% |  |
| C | 4023 | 3304 | 1 | 1 | 0.02% | 0.03% | 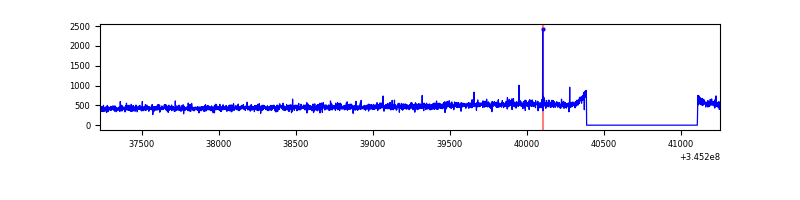 |
| D | 4023 | 3304 | 80 | 80 | 1.99% | 2.42% | 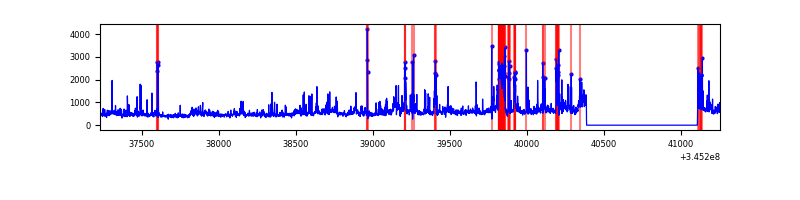 |
Top three noisy pixels from each quadrant. If the there are fewer than three noisy pixels in the level2.evt file, extra rows are filled as -1
| Pixel properties | Quadrant properties | ||||||
|---|---|---|---|---|---|---|---|
| Quadrant | DetID | PixID | Counts | Sigma | Mean | Median | Sigma |
| A | 13 | 254 | 5337 | 59.48 | 402 | 394 | 83.1 |
| A | 3 | 137 | 3965 | 42.97 | 402 | 394 | 83.1 |
| A | 0 | 226 | 3390 | 36.05 | 402 | 394 | 83.1 |
| B | 10 | 245 | 83018 | 1061.79 | 393 | 382 | 77.8 |
| B | 10 | 246 | 13447 | 167.87 | 393 | 382 | 77.8 |
| B | 12 | 111 | 9592 | 118.34 | 393 | 382 | 77.8 |
| C | 14 | 238 | 61552 | 675.53 | 380 | 381 | 90.6 |
| C | 3 | 233 | 18856 | 204.02 | 380 | 381 | 90.6 |
| C | 13 | 61 | 2604 | 24.55 | 380 | 381 | 90.6 |
| D | 1 | 52 | 329845 | 3581.48 | 381 | 369 | 92.0 |
| D | 7 | 223 | 206815 | 2244.12 | 381 | 369 | 92.0 |
| D | 8 | 195 | 94010 | 1017.9 | 381 | 369 | 92.0 |
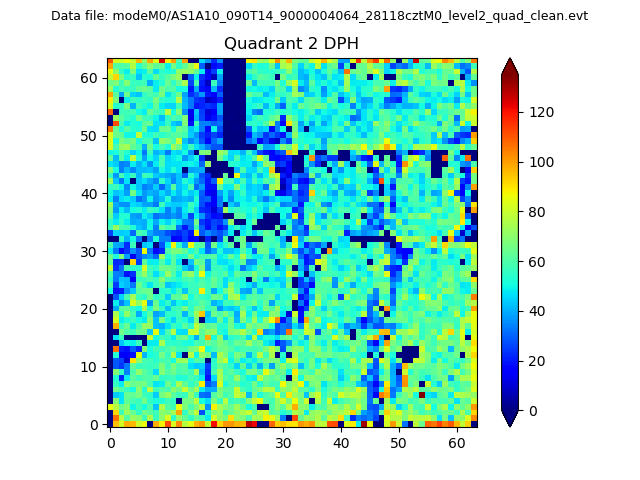
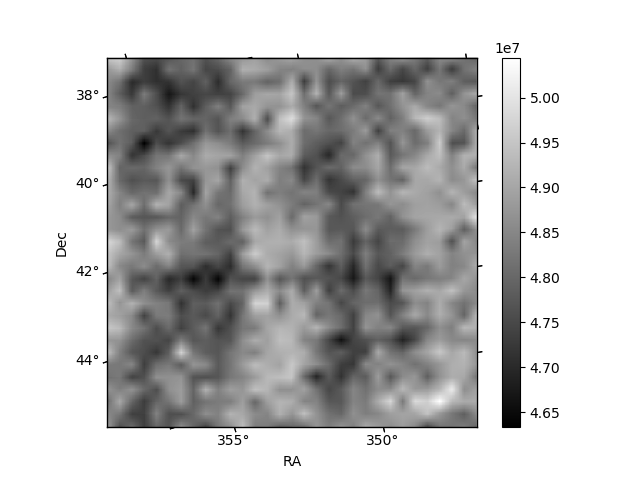
Histogram calculated using DETX and DETY for each event in the final _common_clean file
| Quadrant A |  |
 |
Quadrant B |
|---|---|---|---|
| Quadrant D |  |
 |
Quadrant C |
| Plot type | Count rate plots | Images |
|---|---|---|
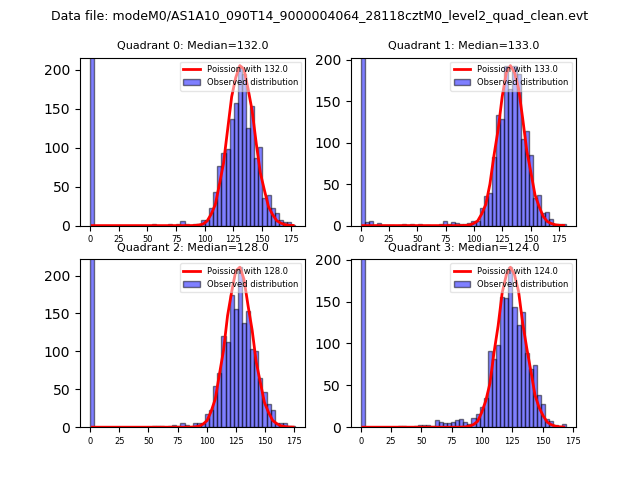
| Comparison with Poisson distribution Blue bars denote a histogram of data divided into 1 sec bins. Red curve is a Poisson curve with rate = median count rate of data. |
 |
 |
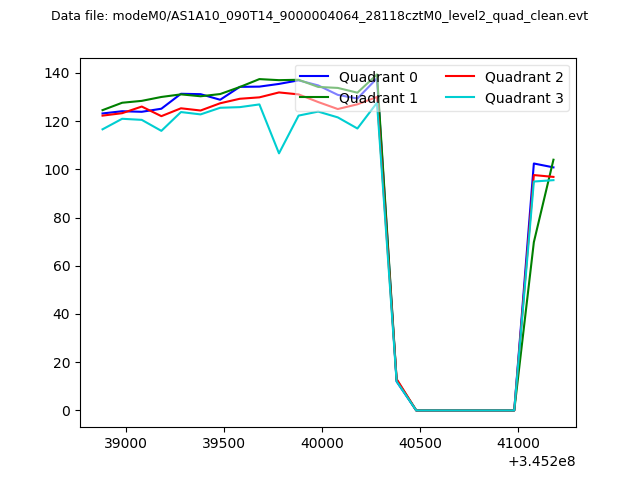
| Quadrant-wise count rates Data is divided into 100 sec bins |
 |
|
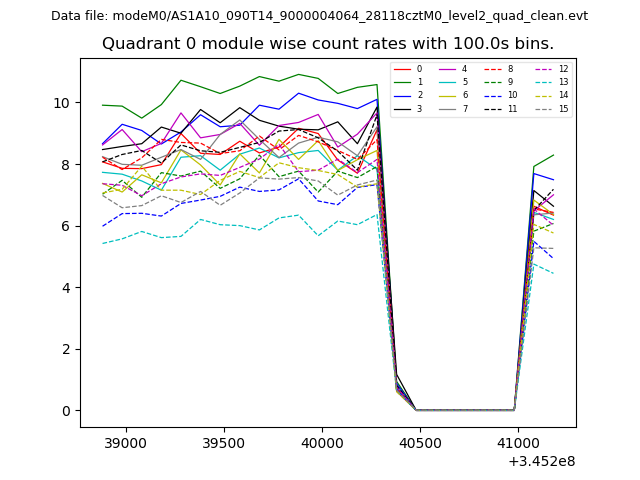
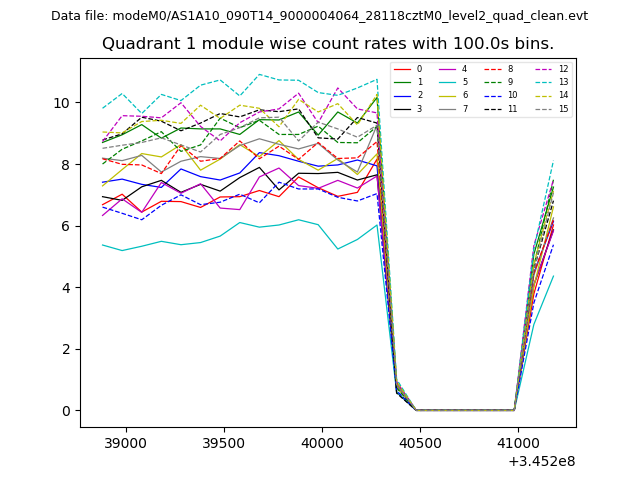
| Module-wise count rates for Quadrant A Data is divided into 100 sec bins |
 |
 |
| Module-wise count rates for Quadrant B Data is divided into 100 sec bins |
 |
 |
| Module-wise count rates for Quadrant C Data is divided into 100 sec bins |
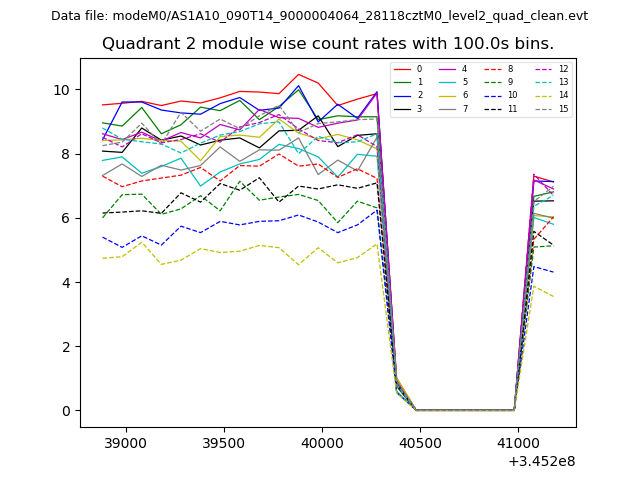 |
 |
| Module-wise count rates for Quadrant D Data is divided into 100 sec bins |
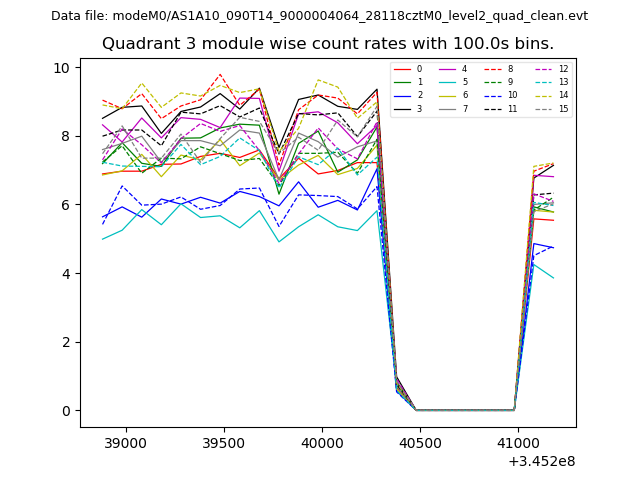 |
 |
| Parameter | Plot |
|---|---|
| CZT HV Monitor | 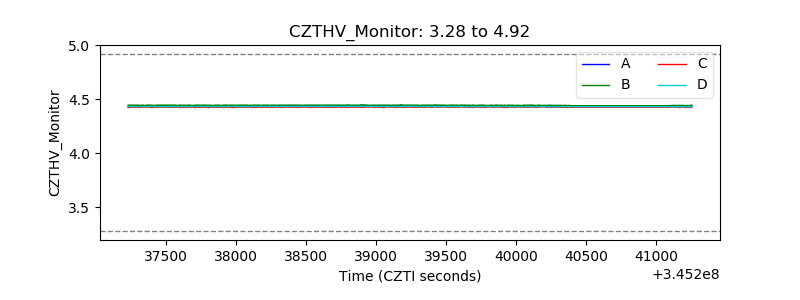 |
| D_VDD |  |
| Temperature 1 | 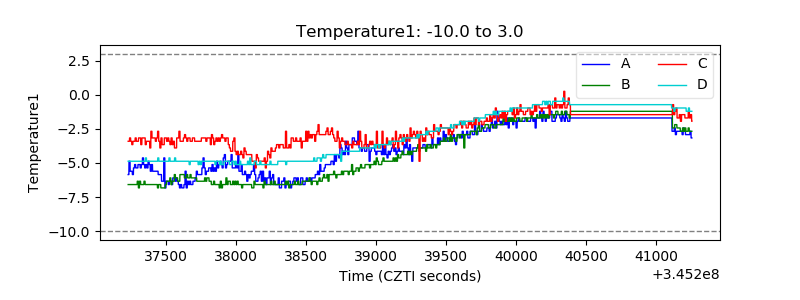 |
| Veto HV Monitor | 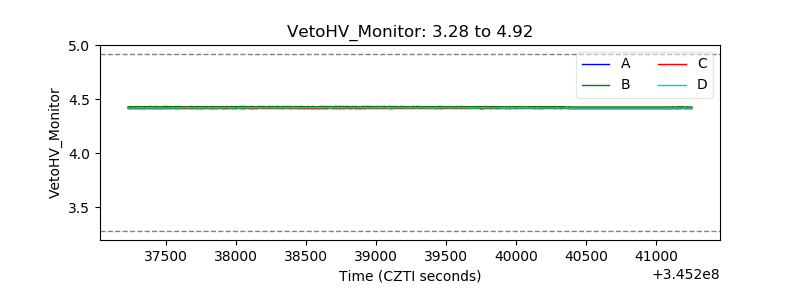 |
| Veto LLD | 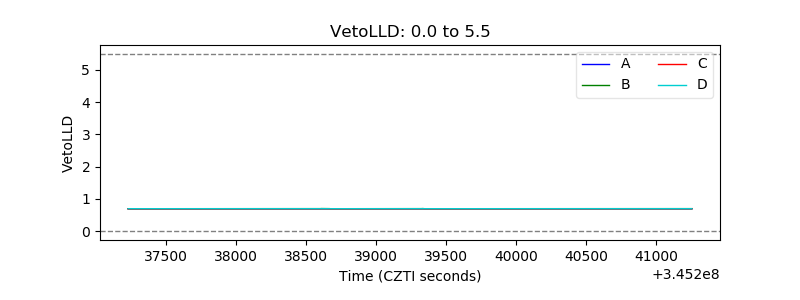 |
| Alpha Counter | 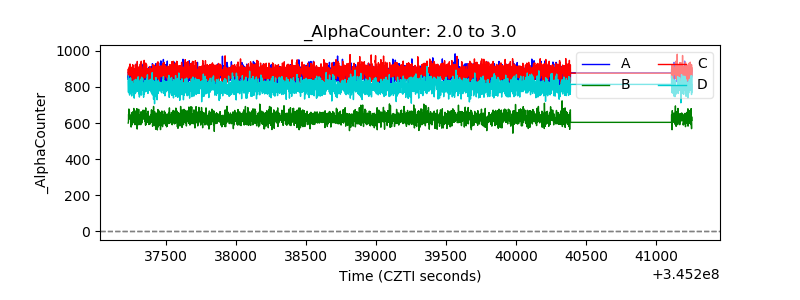 |
| _CPM_Rate | 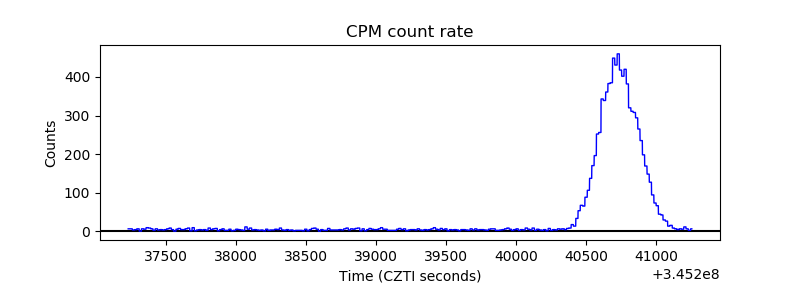 |
| CZT Counter | 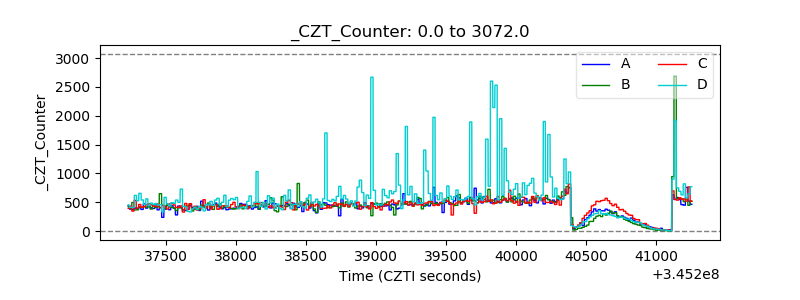 |
| +2.5 Volts monitor |  |
| +5 Volts monitor | 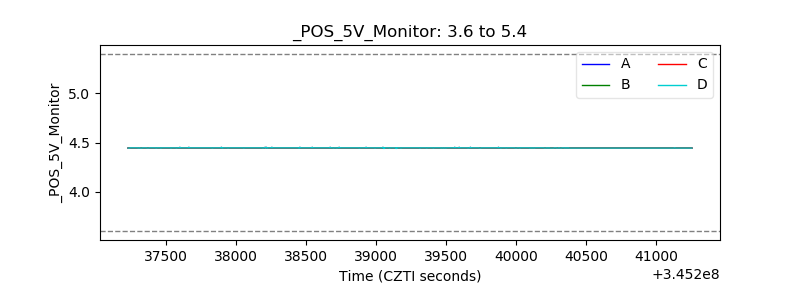 |
| _ROLL_ROT | 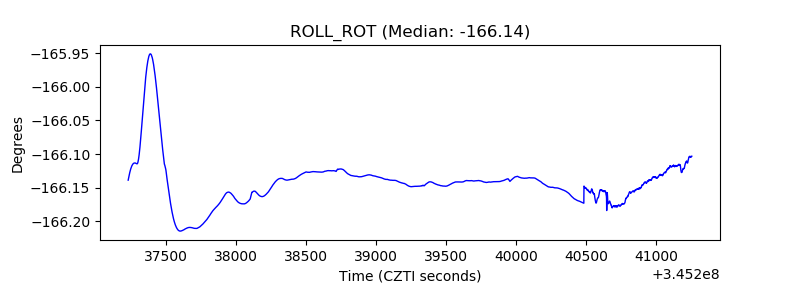 |
| _Roll_DEC | 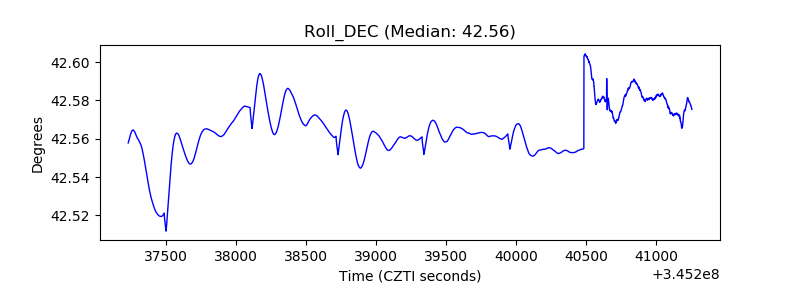 |
| _Roll_RA | 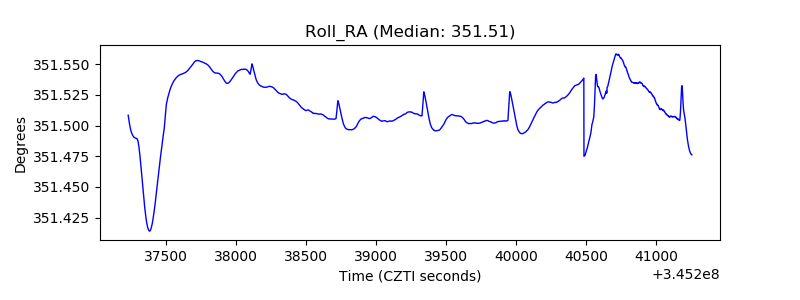 |
| Veto Counter | 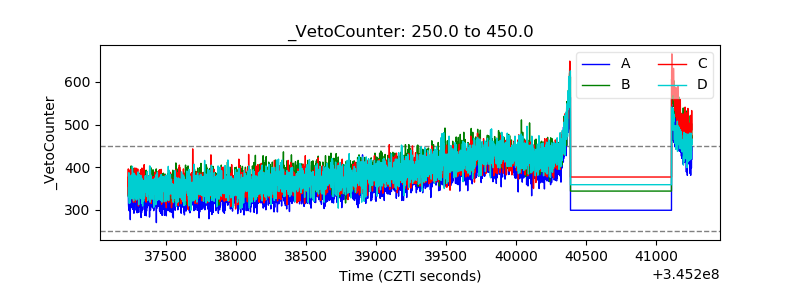 |