| Param | Original file | Final file |
|---|---|---|
| Filename | modeM0/AS1A10_090T14_9000004064_28119cztM0_level2.evt | modeM0/AS1A10_090T14_9000004064_28119cztM0_level2_quad_clean.evt |
| Size (bytes) | 606,905,280 | 91,356,480 |
| Size | 578.8 MB | 87.1 MB |
| Events in quadrant A | 3,209,751 | 595,287 |
| Events in quadrant B | 3,453,725 | 596,339 |
| Events in quadrant C | 3,312,718 | 571,793 |
| Events in quadrant D | 7,935,491 | 521,435 |
| Mode M9 | |||
|---|---|---|---|
| Quadrant | BADHDUFLAG | Total packets | Discarded packets |
| A | 0 | 13 | 0 |
| B | 0 | 14 | 0 |
| C | 0 | 14 | 0 |
| D | 0 | 14 | 0 |
| Mode M0 | |||
|---|---|---|---|
| Quadrant | BADHDUFLAG | Total packets | Discarded packets |
| A | 0 | 14052 | 0 |
| B | 0 | 14695 | 0 |
| C | 0 | 14224 | 0 |
| D | 0 | 28283 | 0 |
| Quadrant | Total seconds | Saturated seconds | Saturation percentage |
|---|---|---|---|
| A | 6912 | 23 | 0.332755% |
| B | 6912 | 71 | 1.027199% |
| C | 6912 | 83 | 1.200810% |
| D | 6911 | 1561 | 22.587180% |
Noise dominated data is calculated using 1-second bins in cleaned event files. If a bin has >2000 counts, and if more than 50% of those come from <1% of pixels, then it is considered to be noise-dominated and hence unusable.
| Quadrant | # 1 sec bins | Bins with >0 counts | Bins with >2000 counts | High rate bins dominated by noise | Noise dominated (total time) | Noise dominated (detector-on time) | Marked lightcurve |
|---|---|---|---|---|---|---|---|
| A | 7792 | 6913 | 0 | 0 | 0.00% | 0.00% | 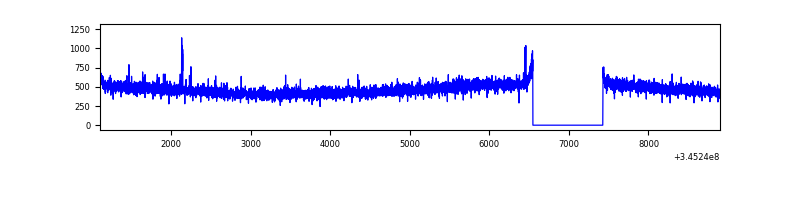 |
| B | 7792 | 6913 | 30 | 30 | 0.39% | 0.43% | 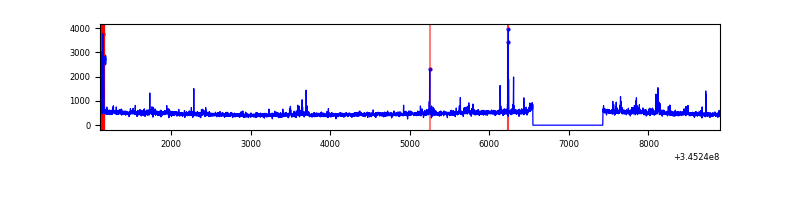 |
| C | 7792 | 6913 | 2 | 2 | 0.03% | 0.03% | 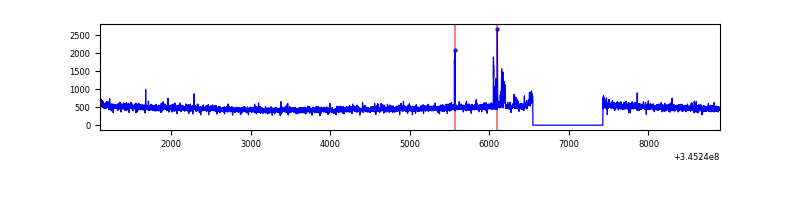 |
| D | 7791 | 6912 | 1356 | 1356 | 17.40% | 19.62% | 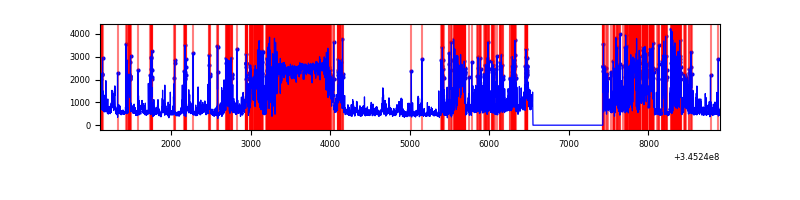 |
Top three noisy pixels from each quadrant. If the there are fewer than three noisy pixels in the level2.evt file, extra rows are filled as -1
| Pixel properties | Quadrant properties | ||||||
|---|---|---|---|---|---|---|---|
| Quadrant | DetID | PixID | Counts | Sigma | Mean | Median | Sigma |
| A | 13 | 254 | 12295 | 69.38 | 827 | 810 | 165.5 |
| A | 4 | 2 | 11307 | 63.41 | 827 | 810 | 165.5 |
| A | 3 | 137 | 7902 | 42.84 | 827 | 810 | 165.5 |
| B | 10 | 245 | 151268 | 963.3 | 818 | 795 | 156.2 |
| B | 4 | 200 | 24832 | 153.88 | 818 | 795 | 156.2 |
| B | 10 | 246 | 22811 | 140.94 | 818 | 795 | 156.2 |
| C | 14 | 238 | 128618 | 676.92 | 800 | 803 | 188.8 |
| C | 3 | 233 | 64617 | 337.97 | 800 | 803 | 188.8 |
| C | 13 | 61 | 5528 | 25.02 | 800 | 803 | 188.8 |
| D | 12 | 2 | 2822120 | 16396.68 | 715 | 695 | 172.1 |
| D | 1 | 52 | 1454725 | 8450.08 | 715 | 695 | 172.1 |
| D | 2 | 250 | 476358 | 2764.31 | 715 | 695 | 172.1 |
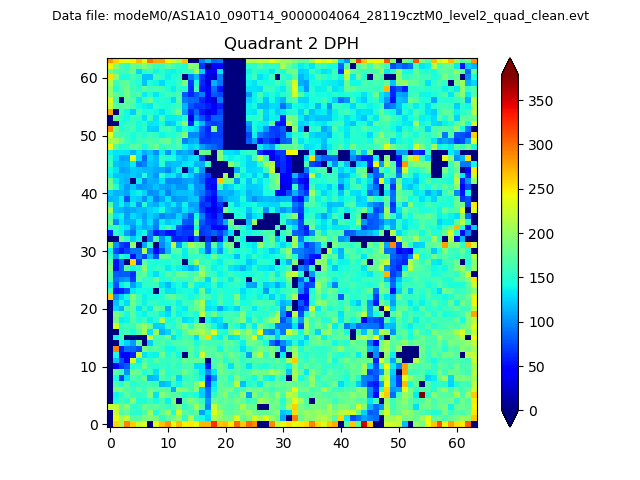
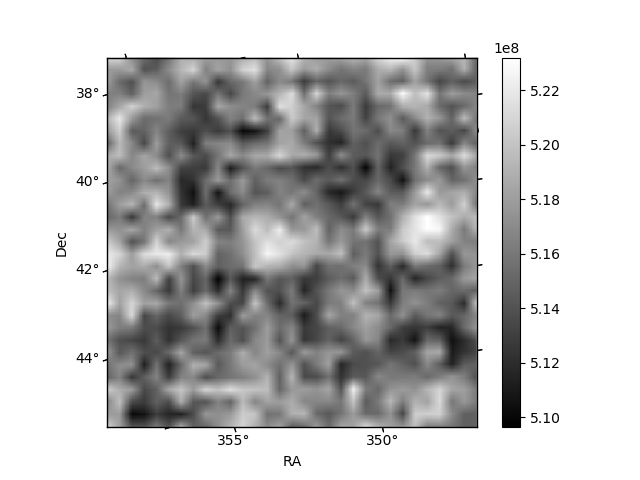
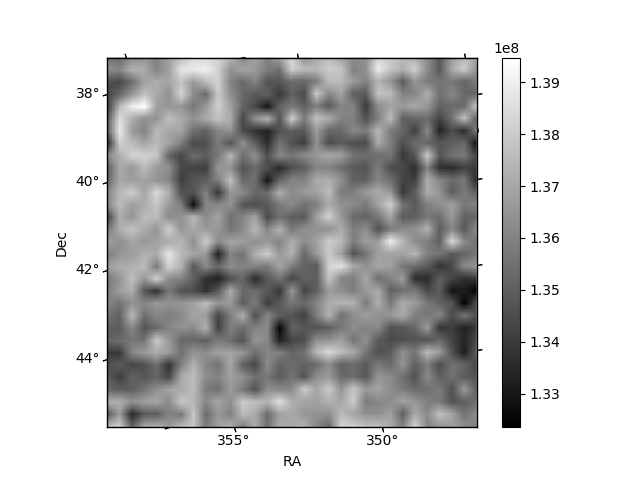
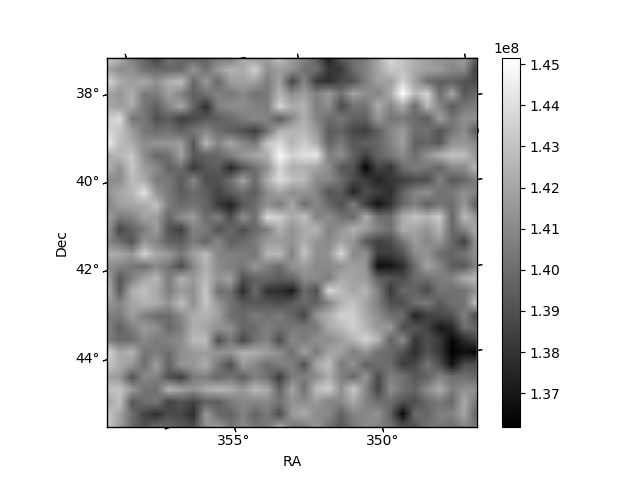
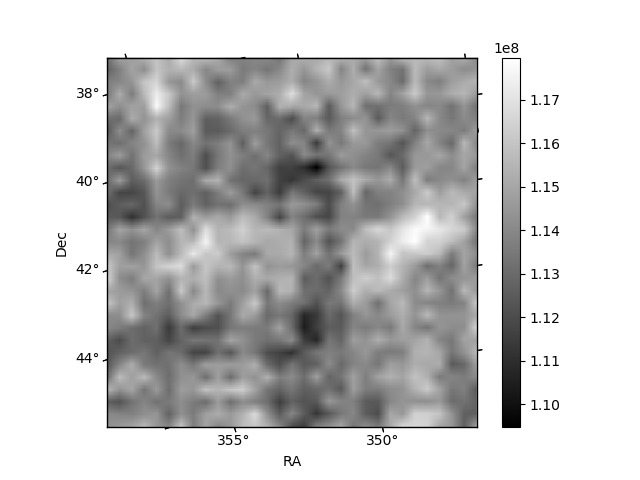
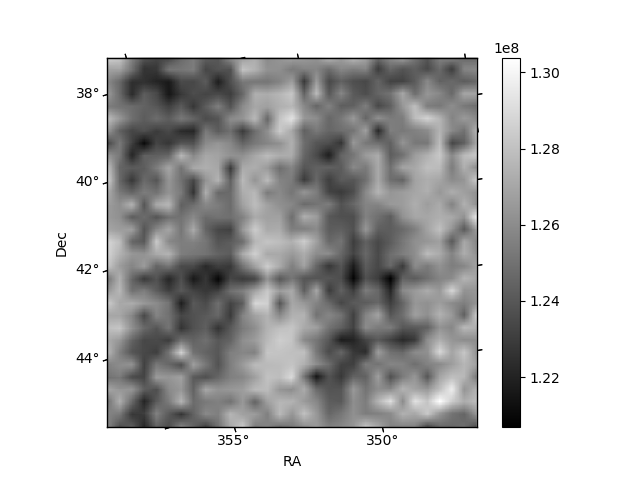
Histogram calculated using DETX and DETY for each event in the final _common_clean file
| Quadrant A | 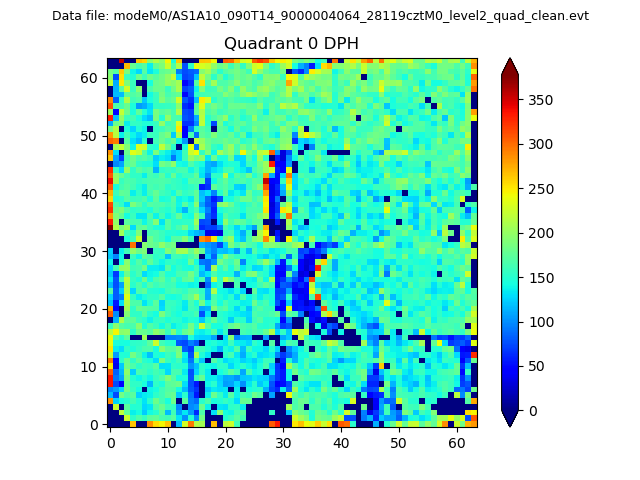 |
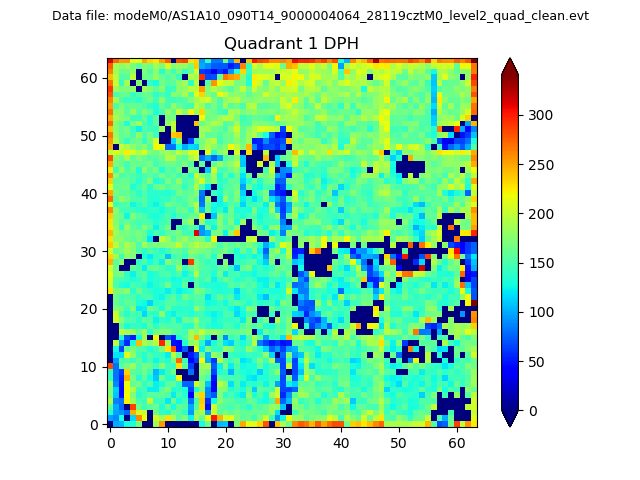 |
Quadrant B |
|---|---|---|---|
| Quadrant D | 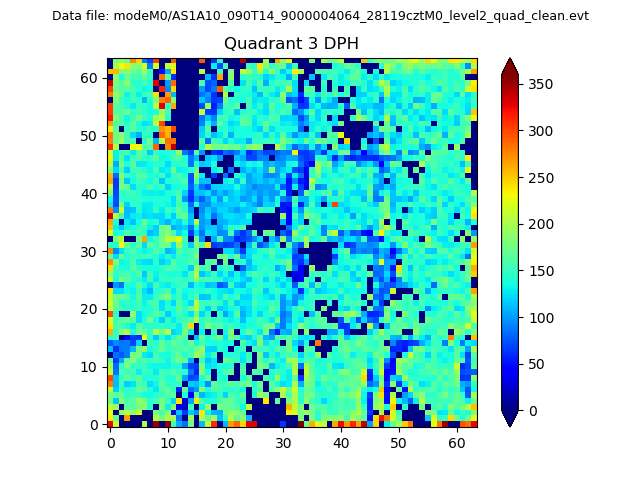 |
 |
Quadrant C |
| Plot type | Count rate plots | Images |
|---|---|---|
| Comparison with Poisson distribution Blue bars denote a histogram of data divided into 1 sec bins. Red curve is a Poisson curve with rate = median count rate of data. |
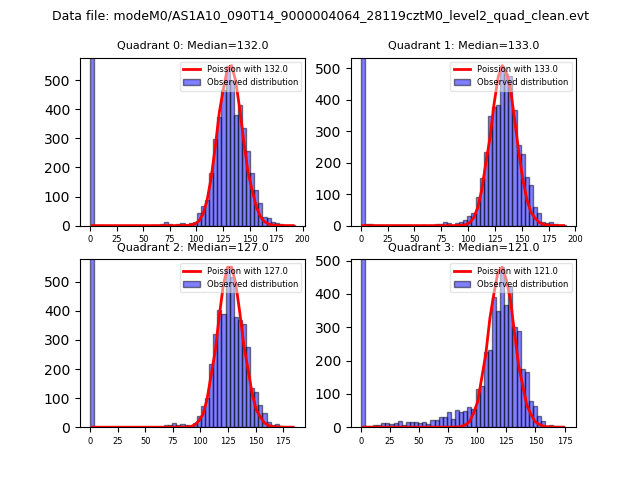 |
 |
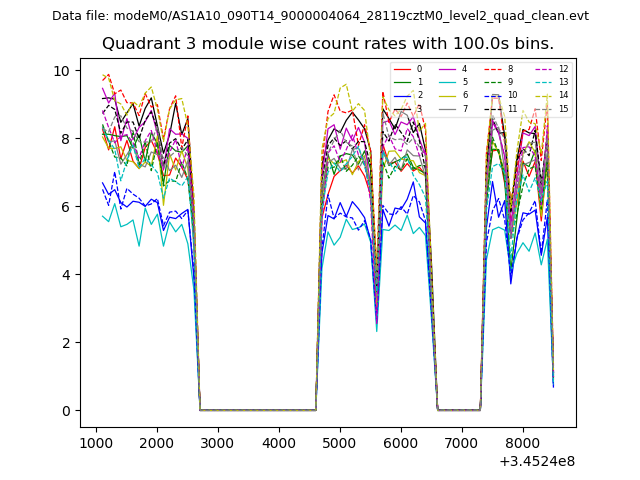
| Quadrant-wise count rates Data is divided into 100 sec bins |
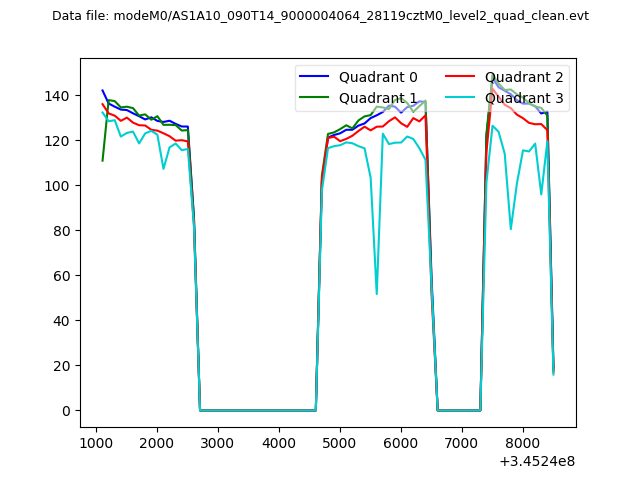 |
|
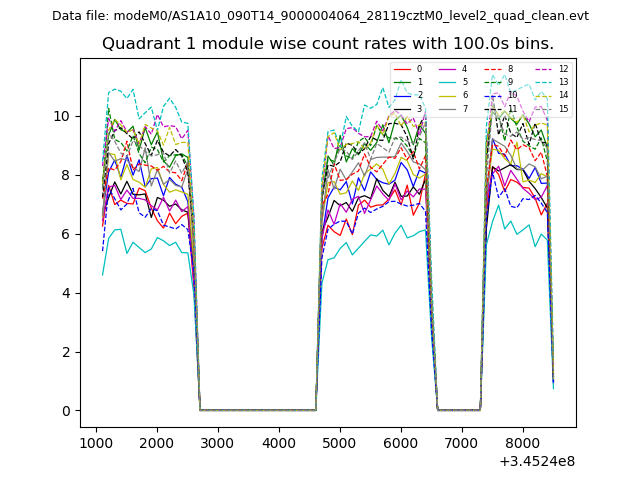
| Module-wise count rates for Quadrant A Data is divided into 100 sec bins |
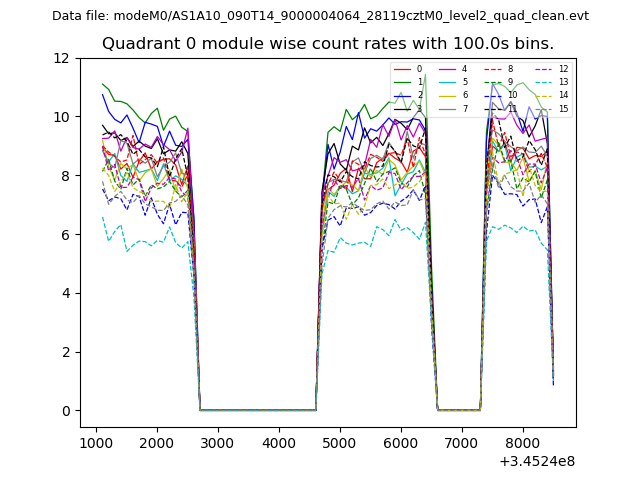 |
 |
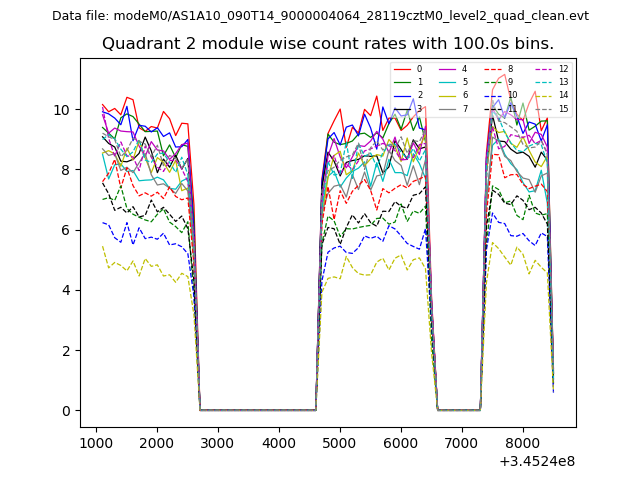
| Module-wise count rates for Quadrant B Data is divided into 100 sec bins |
 |
 |
| Module-wise count rates for Quadrant C Data is divided into 100 sec bins |
 |
 |
| Module-wise count rates for Quadrant D Data is divided into 100 sec bins |
 |
 |
| Parameter | Plot |
|---|---|
| CZT HV Monitor | 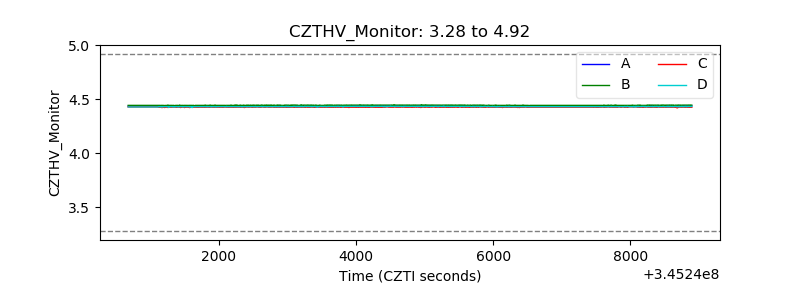 |
| D_VDD | 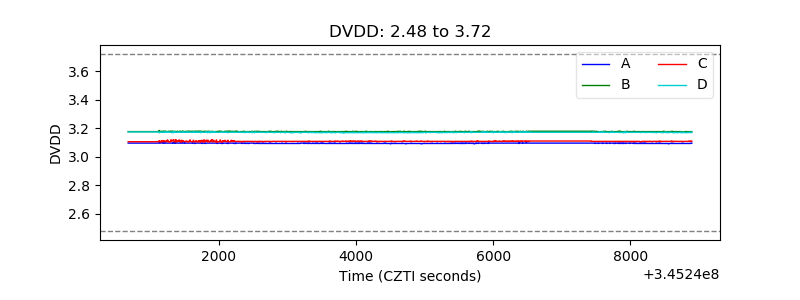 |
| Temperature 1 | 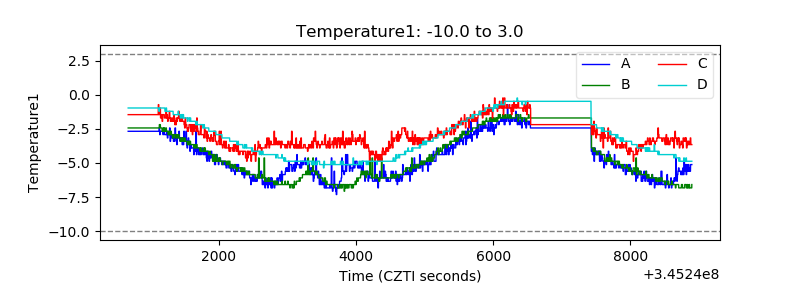 |
| Veto HV Monitor | 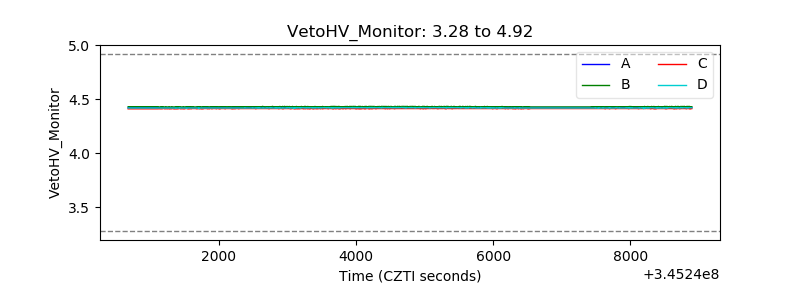 |
| Veto LLD | 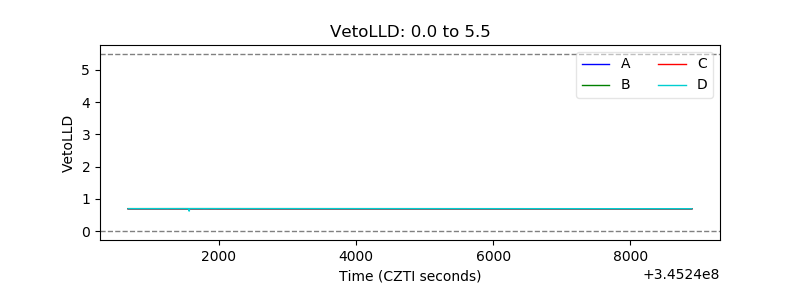 |
| Alpha Counter | 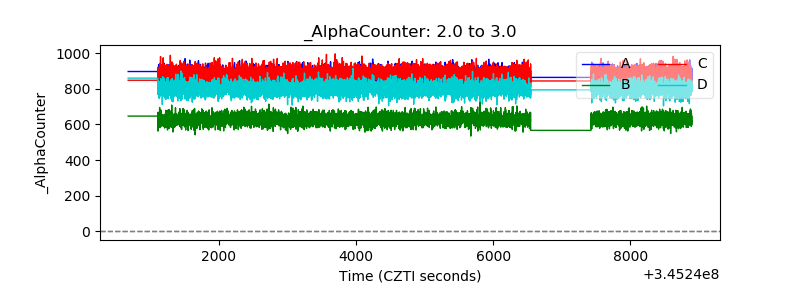 |
| _CPM_Rate | 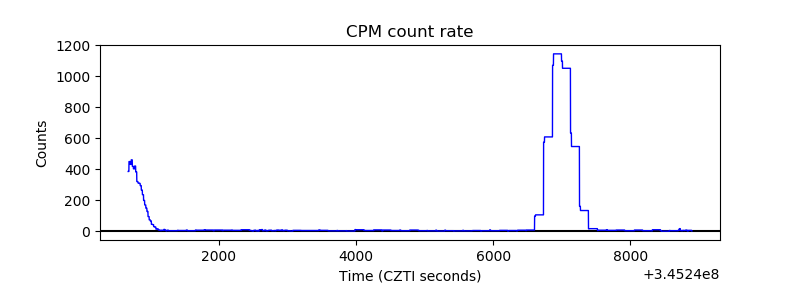 |
| CZT Counter | 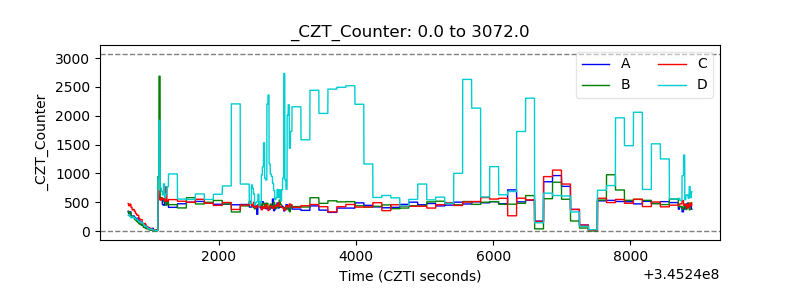 |
| +2.5 Volts monitor |  |
| +5 Volts monitor |  |
| _ROLL_ROT | 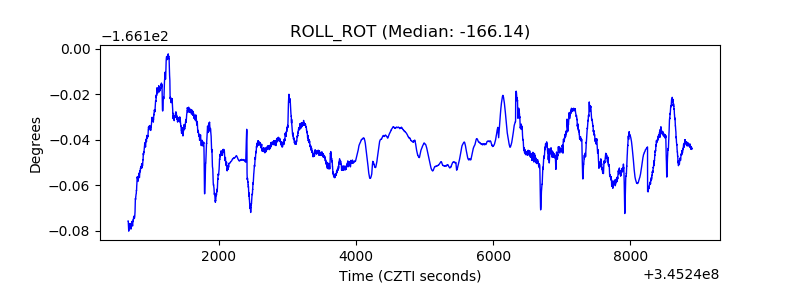 |
| _Roll_DEC | 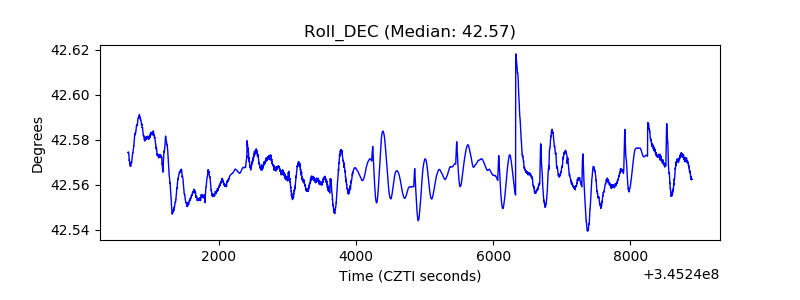 |
| _Roll_RA | 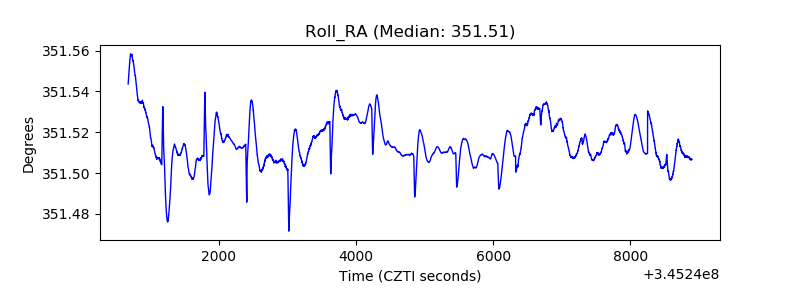 |
| Veto Counter | 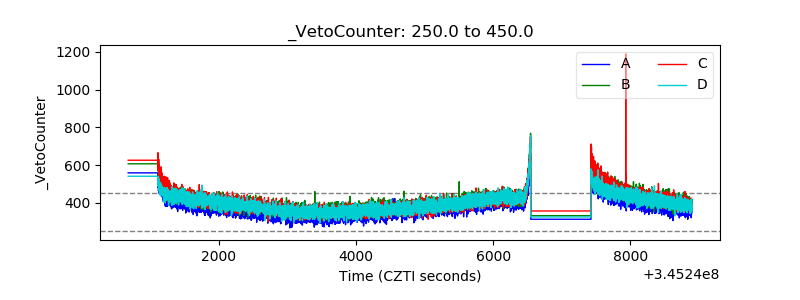 |