| Param | Original file | Final file |
|---|---|---|
| Filename | modeM0/AS1A10_090T14_9000004064_28120cztM0_level2.evt | modeM0/AS1A10_090T14_9000004064_28120cztM0_level2_quad_clean.evt |
| Size (bytes) | 610,326,720 | 82,566,720 |
| Size | 582.1 MB | 78.7 MB |
| Events in quadrant A | 3,227,722 | 531,971 |
| Events in quadrant B | 3,862,519 | 536,512 |
| Events in quadrant C | 3,284,514 | 512,546 |
| Events in quadrant D | 7,644,766 | 441,503 |
| Mode M9 | |||
|---|---|---|---|
| Quadrant | BADHDUFLAG | Total packets | Discarded packets |
| A | 0 | 15 | 0 |
| B | 0 | 16 | 0 |
| C | 0 | 16 | 0 |
| D | 0 | 16 | 0 |
| Mode M0 | |||
|---|---|---|---|
| Quadrant | BADHDUFLAG | Total packets | Discarded packets |
| A | 0 | 13966 | 0 |
| B | 0 | 15900 | 0 |
| C | 0 | 14062 | 0 |
| D | 0 | 27382 | 0 |
| Quadrant | Total seconds | Saturated seconds | Saturation percentage |
|---|---|---|---|
| A | 6855 | 16 | 0.233406% |
| B | 6854 | 123 | 1.794573% |
| C | 6854 | 69 | 1.006711% |
| D | 6854 | 1263 | 18.427196% |
Noise dominated data is calculated using 1-second bins in cleaned event files. If a bin has >2000 counts, and if more than 50% of those come from <1% of pixels, then it is considered to be noise-dominated and hence unusable.
| Quadrant | # 1 sec bins | Bins with >0 counts | Bins with >2000 counts | High rate bins dominated by noise | Noise dominated (total time) | Noise dominated (detector-on time) | Marked lightcurve |
|---|---|---|---|---|---|---|---|
| A | 7875 | 6856 | 0 | 0 | 0.00% | 0.00% | 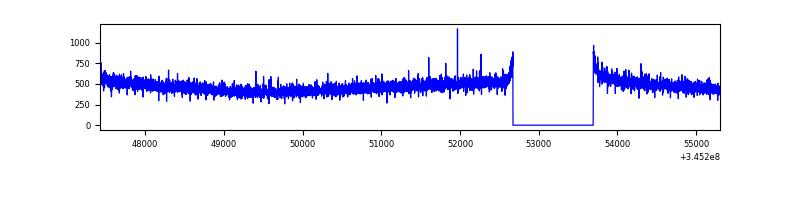 |
| B | 7874 | 6855 | 63 | 63 | 0.80% | 0.92% | 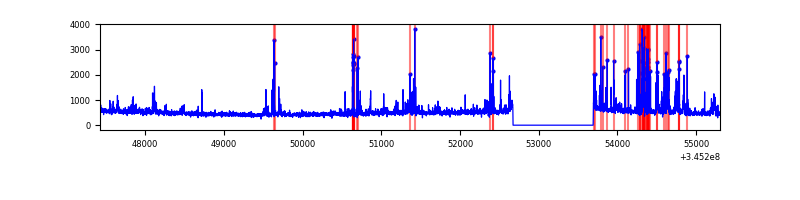 |
| C | 7874 | 6855 | 0 | 0 | 0.00% | 0.00% | 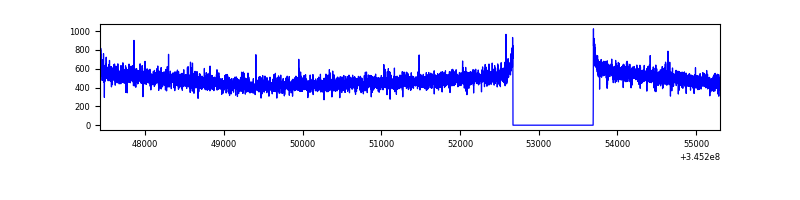 |
| D | 7874 | 6855 | 1014 | 1014 | 12.88% | 14.79% | 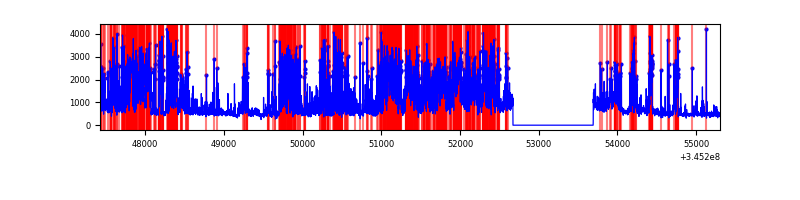 |
Top three noisy pixels from each quadrant. If the there are fewer than three noisy pixels in the level2.evt file, extra rows are filled as -1
| Pixel properties | Quadrant properties | ||||||
|---|---|---|---|---|---|---|---|
| Quadrant | DetID | PixID | Counts | Sigma | Mean | Median | Sigma |
| A | 13 | 254 | 12183 | 68.31 | 835 | 818 | 166.4 |
| A | 3 | 137 | 8083 | 43.66 | 835 | 818 | 166.4 |
| A | 0 | 226 | 7097 | 37.74 | 835 | 818 | 166.4 |
| B | 10 | 245 | 527420 | 3317.14 | 829 | 807 | 158.8 |
| B | 5 | 255 | 27841 | 170.29 | 829 | 807 | 158.8 |
| B | 12 | 111 | 19247 | 116.15 | 829 | 807 | 158.8 |
| C | 14 | 238 | 131303 | 687.42 | 806 | 813 | 189.8 |
| C | 3 | 233 | 8932 | 42.77 | 806 | 813 | 189.8 |
| C | 13 | 61 | 5351 | 23.91 | 806 | 813 | 189.8 |
| D | 1 | 52 | 2580114 | 14260.1 | 754 | 734 | 180.9 |
| D | 12 | 2 | 1164634 | 6434.62 | 754 | 734 | 180.9 |
| D | 2 | 250 | 450347 | 2485.68 | 754 | 734 | 180.9 |
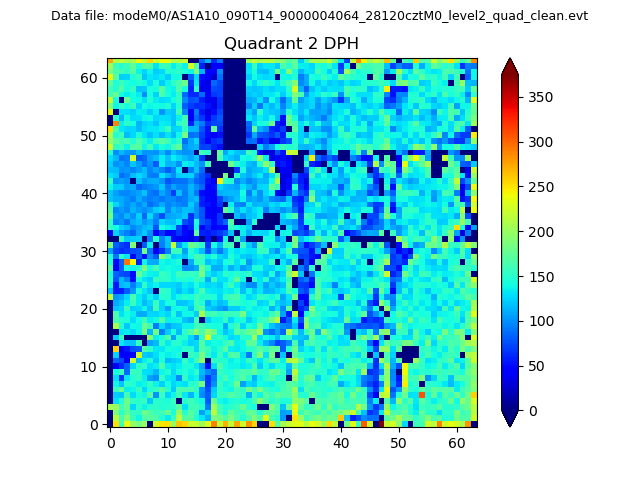
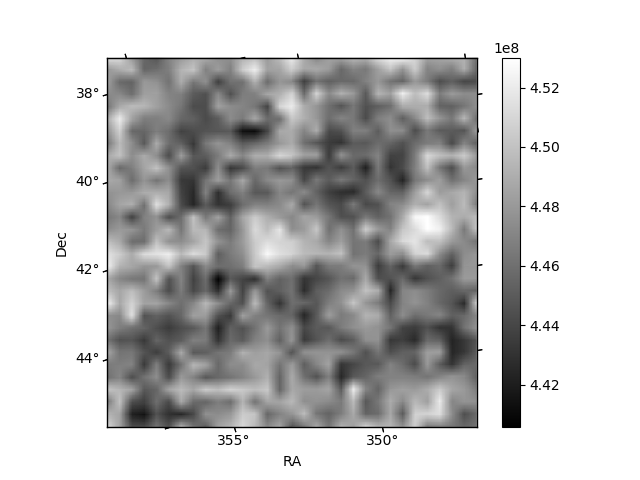
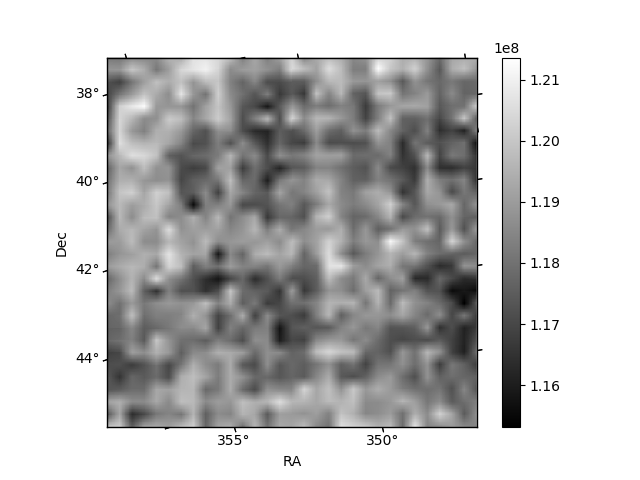
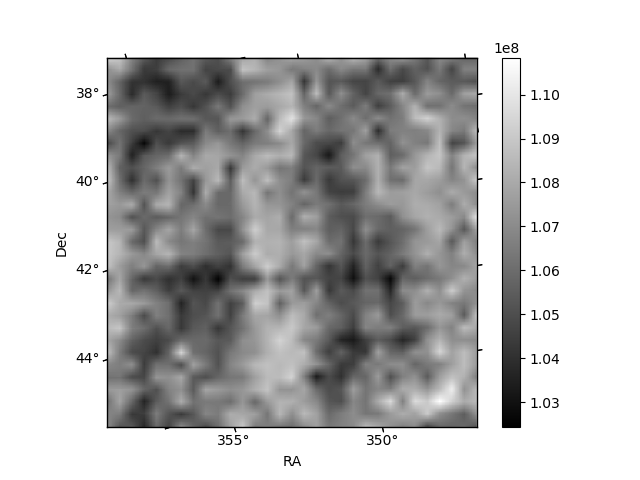
Histogram calculated using DETX and DETY for each event in the final _common_clean file
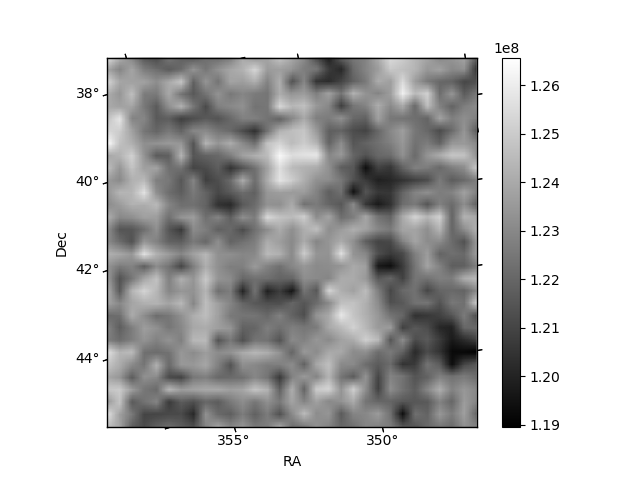
| Quadrant A | 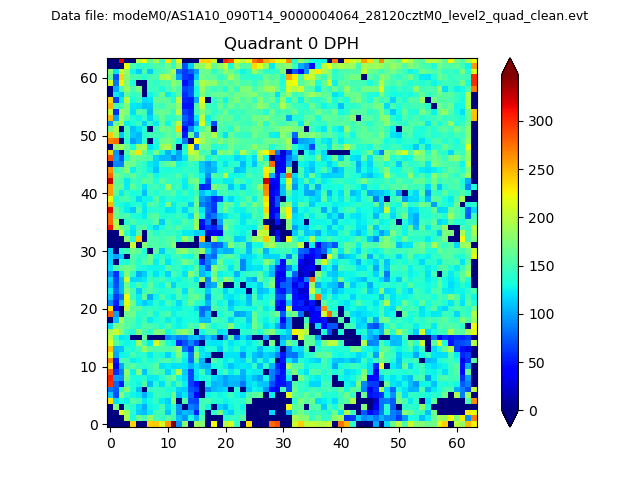 |
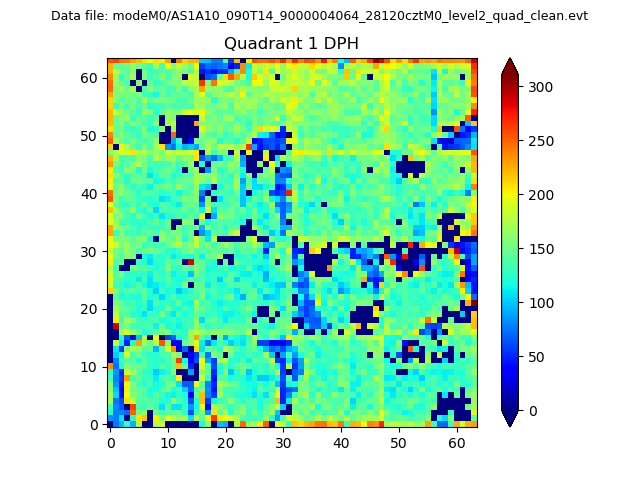 |
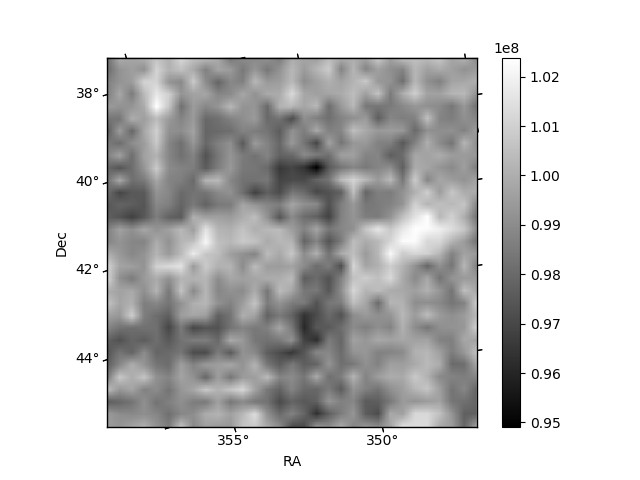
Quadrant B |
|---|---|---|---|
| Quadrant D | 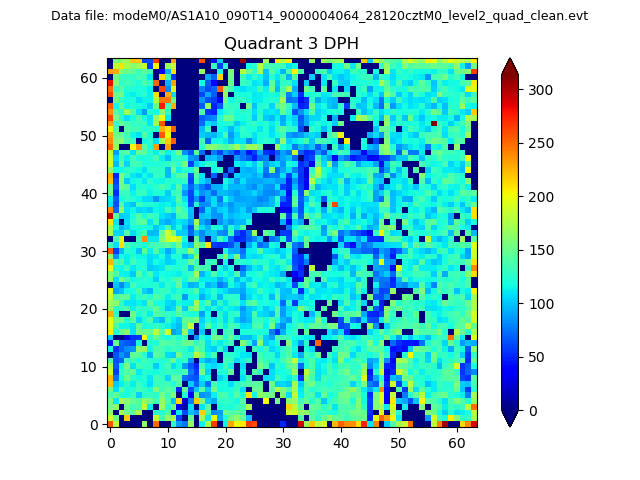 |
 |
Quadrant C |
| Plot type | Count rate plots | Images |
|---|---|---|
| Comparison with Poisson distribution Blue bars denote a histogram of data divided into 1 sec bins. Red curve is a Poisson curve with rate = median count rate of data. |
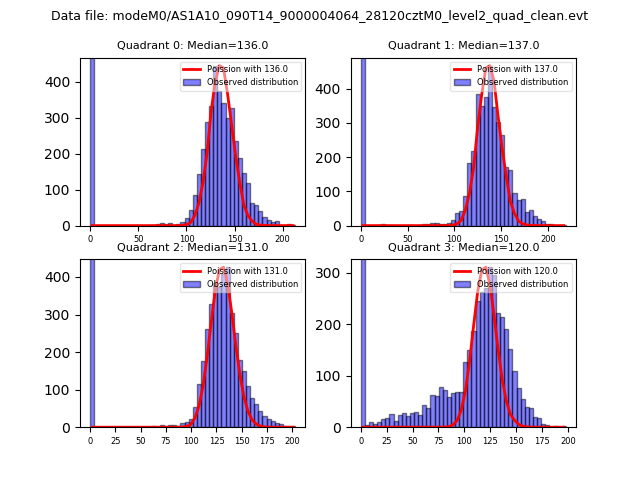 |
 |
| Quadrant-wise count rates Data is divided into 100 sec bins |
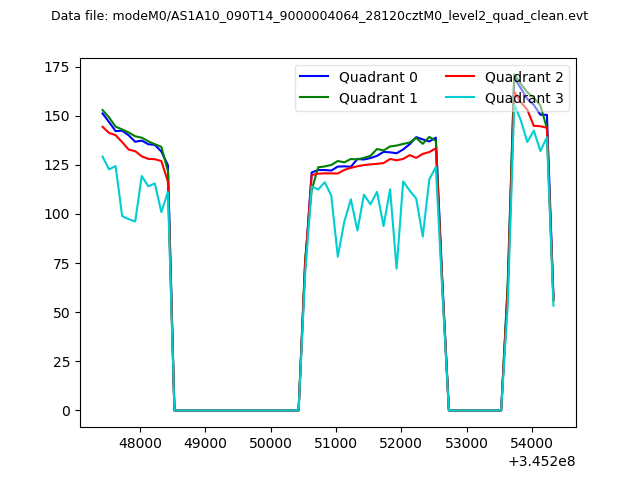 |
|
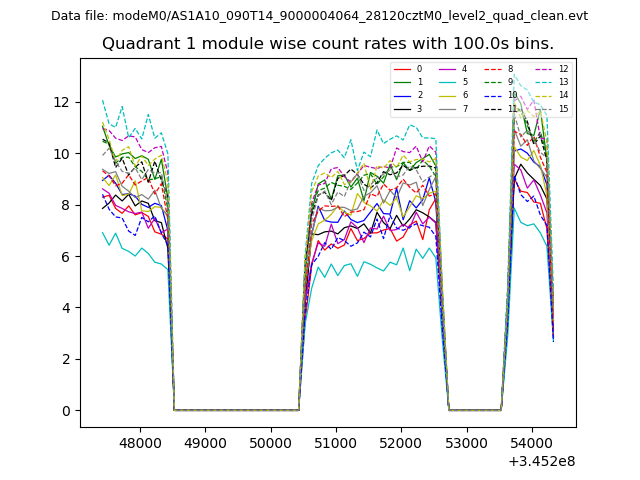
| Module-wise count rates for Quadrant A Data is divided into 100 sec bins |
 |
 |
| Module-wise count rates for Quadrant B Data is divided into 100 sec bins |
 |
 |
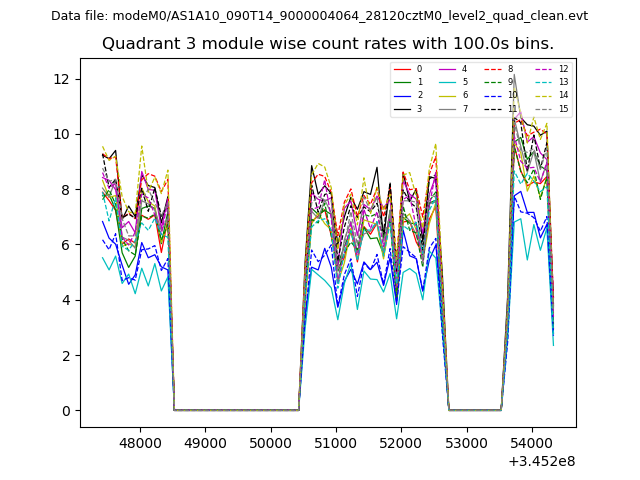
| Module-wise count rates for Quadrant C Data is divided into 100 sec bins |
 |
 |
| Module-wise count rates for Quadrant D Data is divided into 100 sec bins |
 |
 |
| Parameter | Plot |
|---|---|
| CZT HV Monitor | 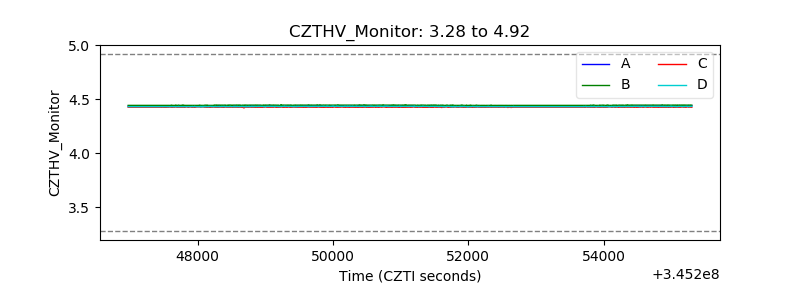 |
| D_VDD | 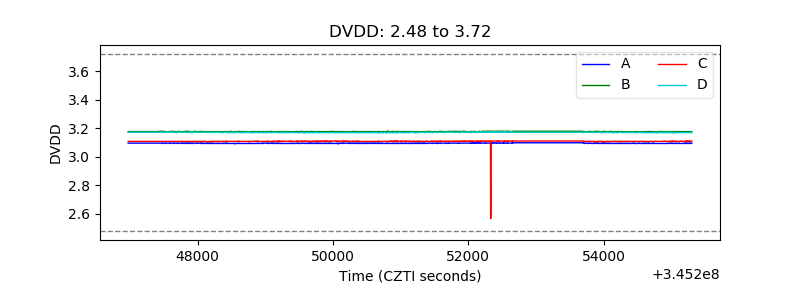 |
| Temperature 1 | 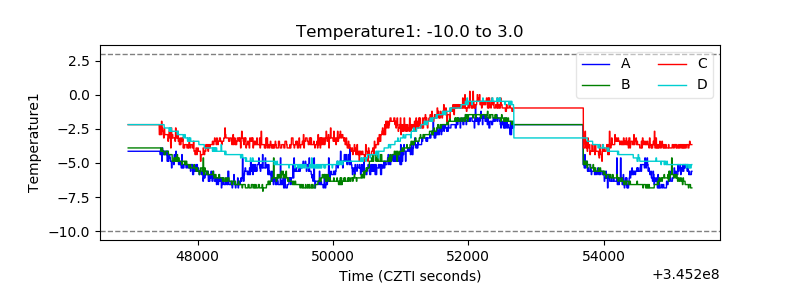 |
| Veto HV Monitor | 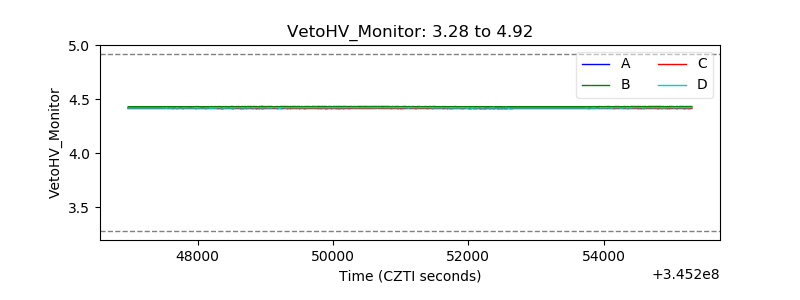 |
| Veto LLD |  |
| Alpha Counter | 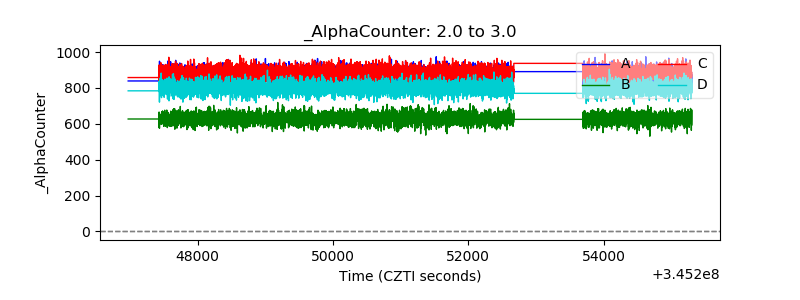 |
| _CPM_Rate | 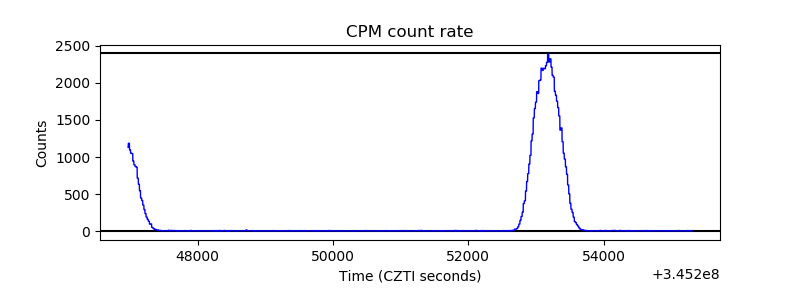 |
| CZT Counter | 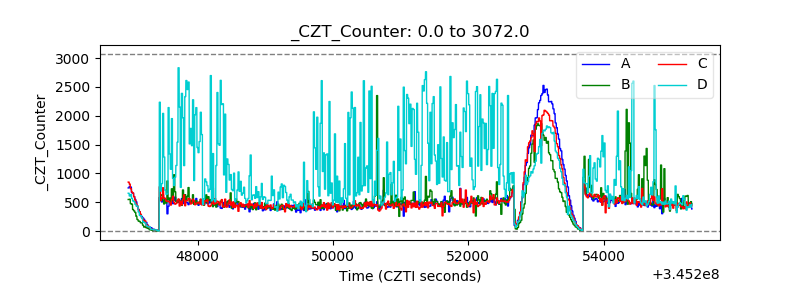 |
| +2.5 Volts monitor |  |
| +5 Volts monitor | 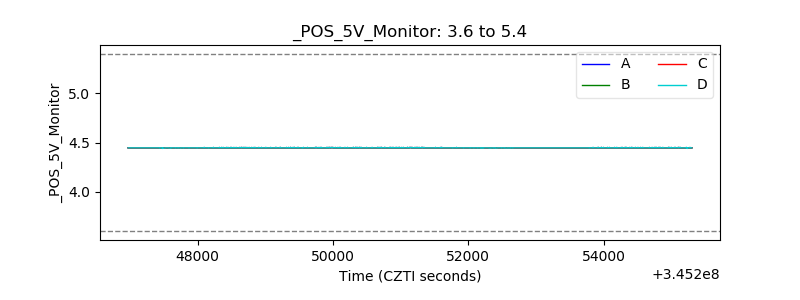 |
| _ROLL_ROT |  |
| _Roll_DEC | 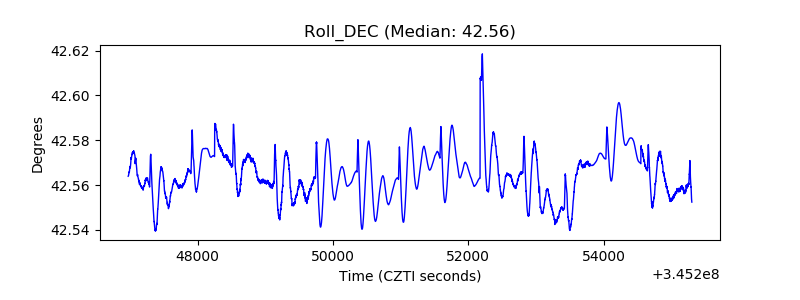 |
| _Roll_RA | 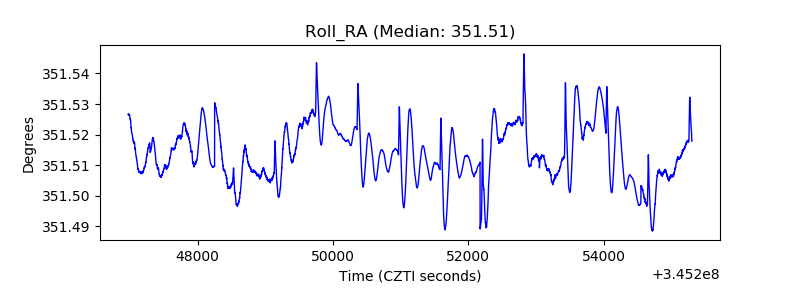 |
| Veto Counter | 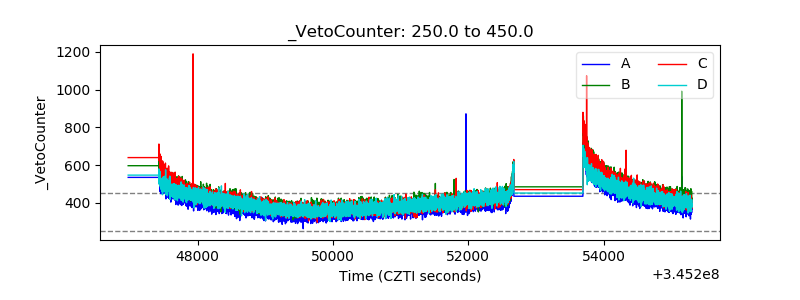 |