| Param | Original file | Final file |
|---|---|---|
| Filename | modeM0/AS1A10_090T14_9000004064_28122cztM0_level2.evt | modeM0/AS1A10_090T14_9000004064_28122cztM0_level2_quad_clean.evt |
| Size (bytes) | 553,924,800 | 75,087,360 |
| Size | 528.3 MB | 71.6 MB |
| Events in quadrant A | 3,226,533 | 468,122 |
| Events in quadrant B | 3,910,367 | 472,963 |
| Events in quadrant C | 3,298,043 | 449,692 |
| Events in quadrant D | 5,894,351 | 423,741 |
| Mode M9 | |||
|---|---|---|---|
| Quadrant | BADHDUFLAG | Total packets | Discarded packets |
| A | 0 | 18 | 0 |
| B | 0 | 19 | 0 |
| C | 0 | 19 | 0 |
| D | 0 | 19 | 0 |
| Mode M0 | |||
|---|---|---|---|
| Quadrant | BADHDUFLAG | Total packets | Discarded packets |
| A | 0 | 13691 | 0 |
| B | 0 | 15764 | 0 |
| C | 0 | 13895 | 0 |
| D | 0 | 22017 | 0 |
| Quadrant | Total seconds | Saturated seconds | Saturation percentage |
|---|---|---|---|
| A | 6589 | 10 | 0.151768% |
| B | 6588 | 143 | 2.170613% |
| C | 6588 | 50 | 0.758956% |
| D | 6588 | 688 | 10.443230% |
Noise dominated data is calculated using 1-second bins in cleaned event files. If a bin has >2000 counts, and if more than 50% of those come from <1% of pixels, then it is considered to be noise-dominated and hence unusable.
| Quadrant | # 1 sec bins | Bins with >0 counts | Bins with >2000 counts | High rate bins dominated by noise | Noise dominated (total time) | Noise dominated (detector-on time) | Marked lightcurve |
|---|---|---|---|---|---|---|---|
| A | 7759 | 6590 | 0 | 0 | 0.00% | 0.00% | 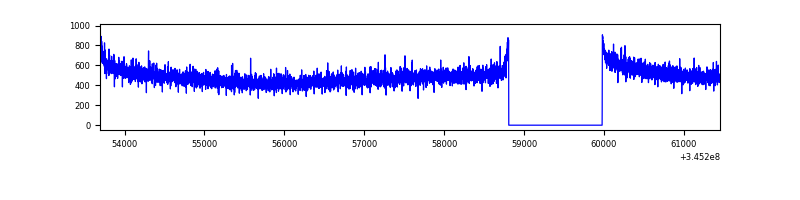 |
| B | 7758 | 6589 | 86 | 86 | 1.11% | 1.31% | 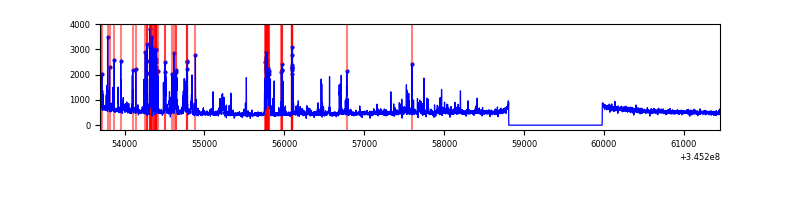 |
| C | 7758 | 6589 | 0 | 0 | 0.00% | 0.00% | 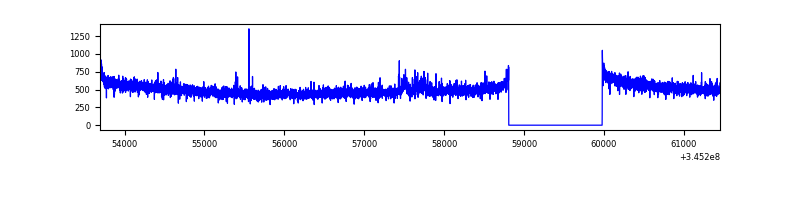 |
| D | 7758 | 6589 | 555 | 555 | 7.15% | 8.42% | 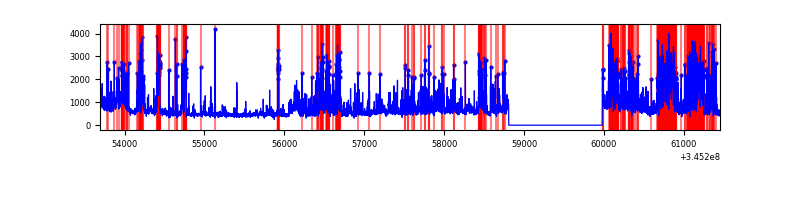 |
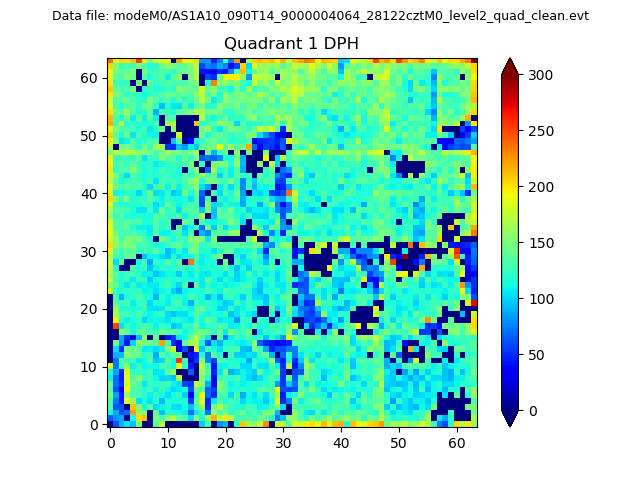
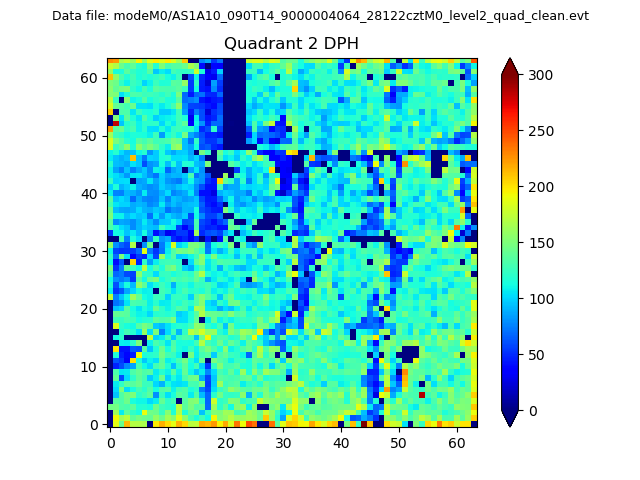
Top three noisy pixels from each quadrant. If the there are fewer than three noisy pixels in the level2.evt file, extra rows are filled as -1
| Pixel properties | Quadrant properties | ||||||
|---|---|---|---|---|---|---|---|
| Quadrant | DetID | PixID | Counts | Sigma | Mean | Median | Sigma |
| A | 13 | 254 | 10748 | 59.67 | 835 | 820 | 166.4 |
| A | 3 | 137 | 7690 | 41.29 | 835 | 820 | 166.4 |
| A | 0 | 226 | 7150 | 38.04 | 835 | 820 | 166.4 |
| B | 10 | 245 | 474477 | 3051.01 | 830 | 811 | 155.2 |
| B | 10 | 246 | 134333 | 860.05 | 830 | 811 | 155.2 |
| B | 5 | 255 | 27566 | 172.34 | 830 | 811 | 155.2 |
| C | 14 | 238 | 129960 | 689.74 | 801 | 808 | 187.2 |
| C | 3 | 233 | 39202 | 205.05 | 801 | 808 | 187.2 |
| C | 13 | 61 | 5317 | 24.08 | 801 | 808 | 187.2 |
| D | 12 | 2 | 1590030 | 8718.46 | 764 | 745 | 182.3 |
| D | 1 | 52 | 545072 | 2986.05 | 764 | 745 | 182.3 |
| D | 8 | 195 | 274353 | 1500.95 | 764 | 745 | 182.3 |
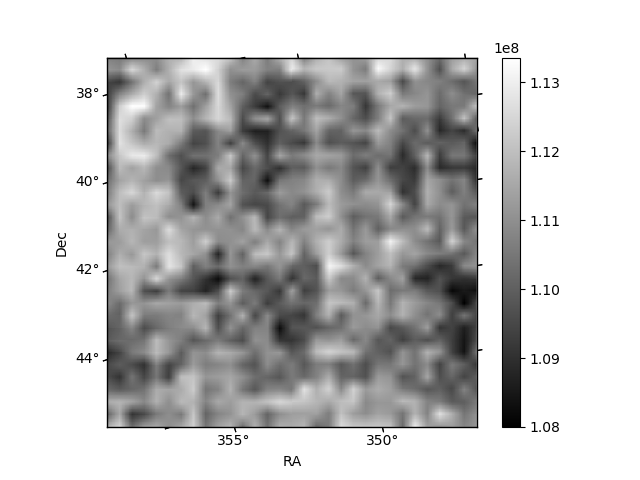
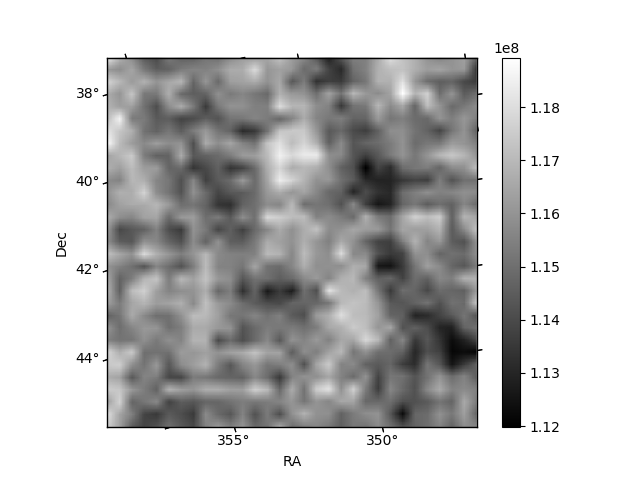
Histogram calculated using DETX and DETY for each event in the final _common_clean file
| Quadrant A | 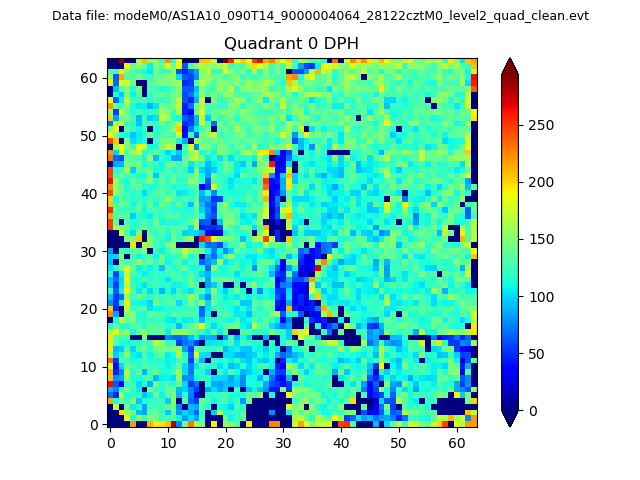 |
 |
Quadrant B |
|---|---|---|---|
| Quadrant D | 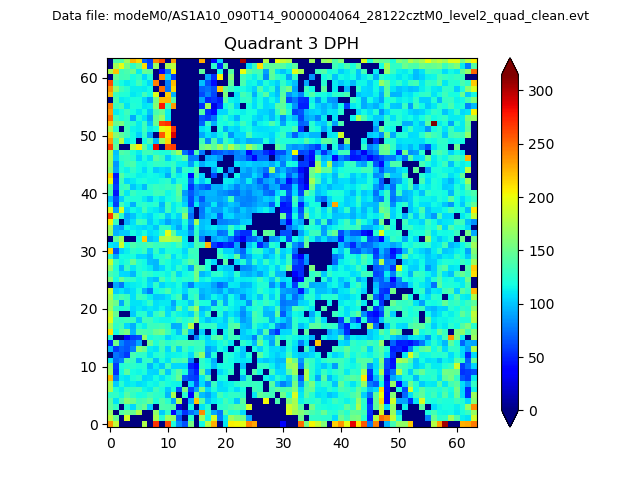 |
 |
Quadrant C |
| Plot type | Count rate plots | Images |
|---|---|---|
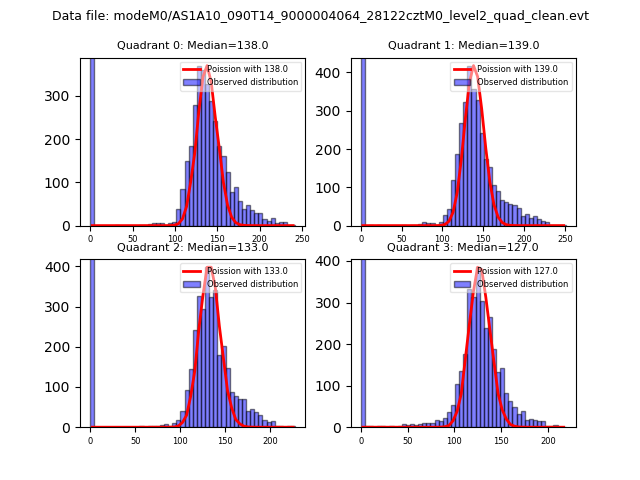
| Comparison with Poisson distribution Blue bars denote a histogram of data divided into 1 sec bins. Red curve is a Poisson curve with rate = median count rate of data. |
 |
 |
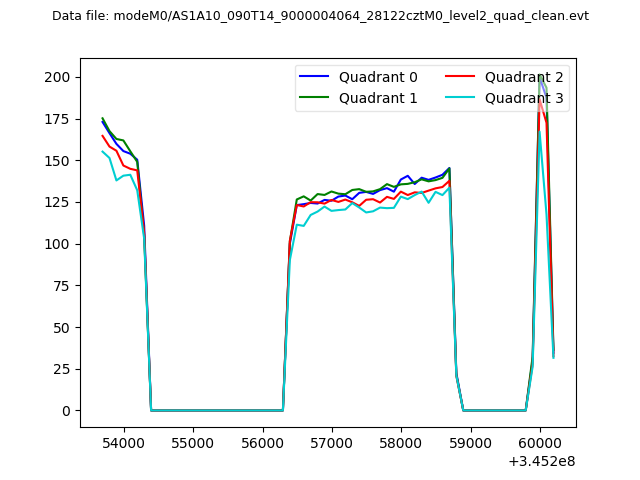
| Quadrant-wise count rates Data is divided into 100 sec bins |
 |
|
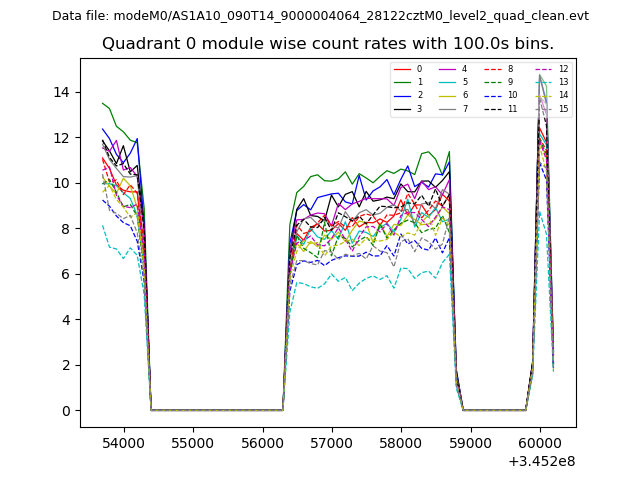
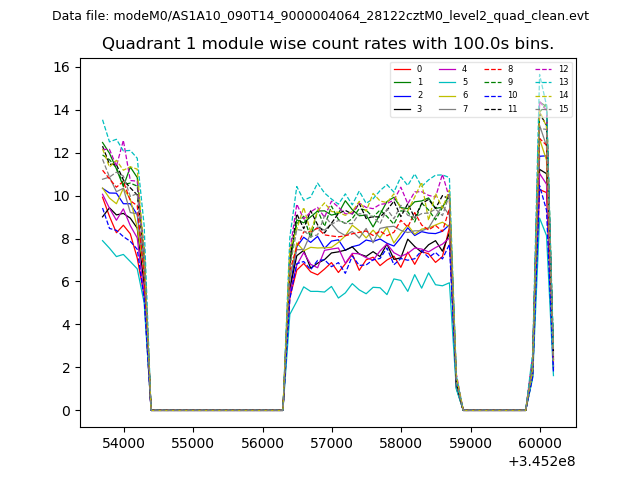
| Module-wise count rates for Quadrant A Data is divided into 100 sec bins |
 |
 |
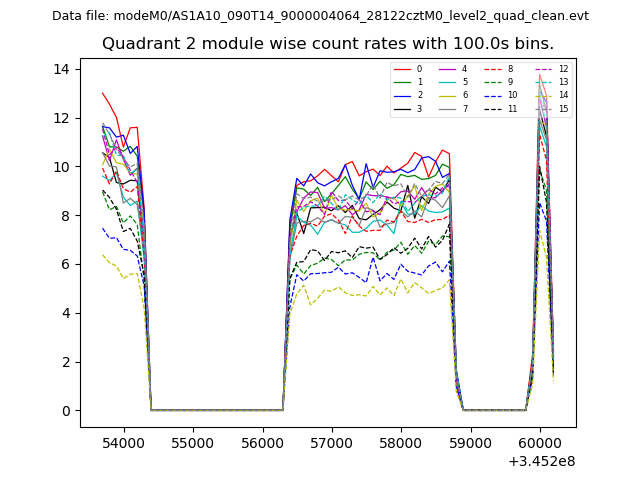
| Module-wise count rates for Quadrant B Data is divided into 100 sec bins |
 |
 |
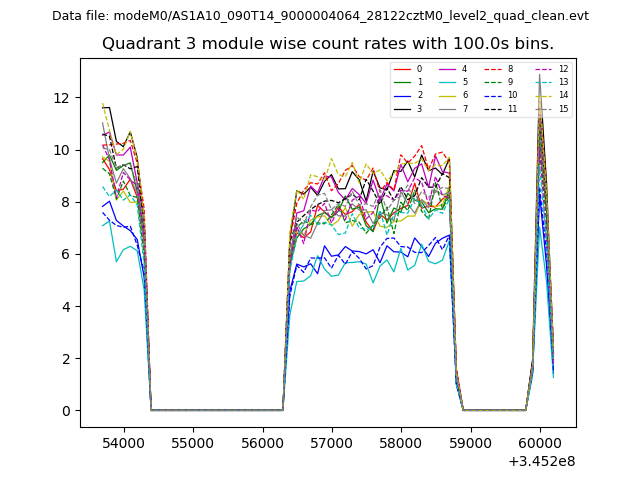
| Module-wise count rates for Quadrant C Data is divided into 100 sec bins |
 |
 |
| Module-wise count rates for Quadrant D Data is divided into 100 sec bins |
 |
 |
| Parameter | Plot |
|---|---|
| CZT HV Monitor | 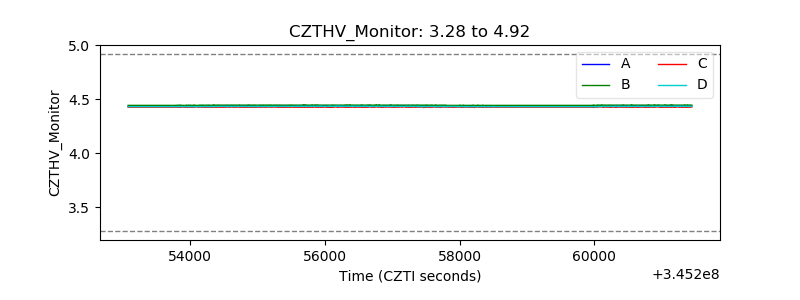 |
| D_VDD |  |
| Temperature 1 | 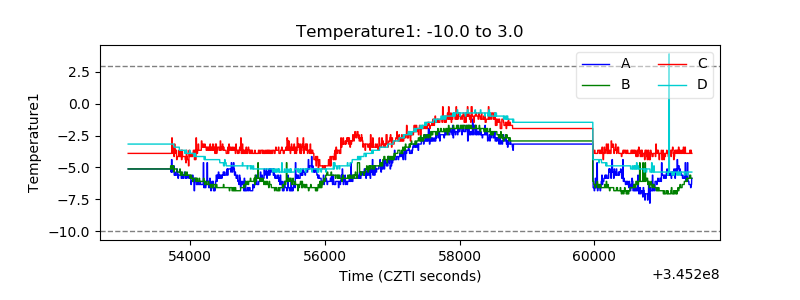 |
| Veto HV Monitor | 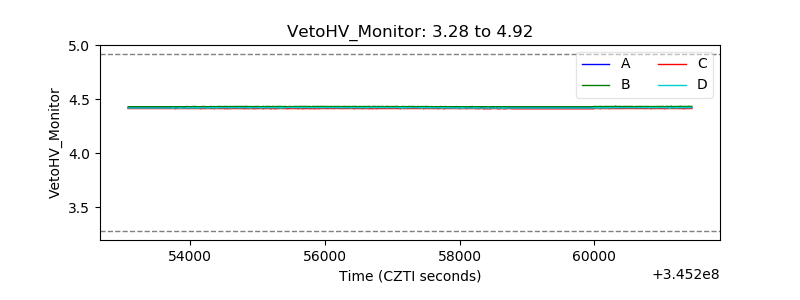 |
| Veto LLD | 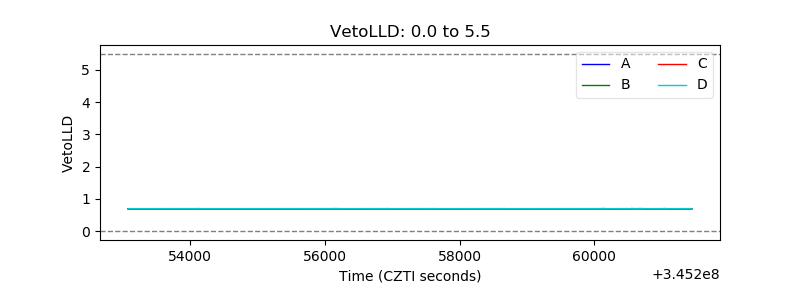 |
| Alpha Counter | 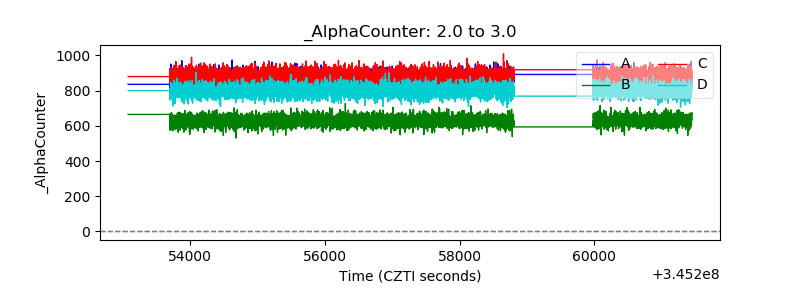 |
| _CPM_Rate | 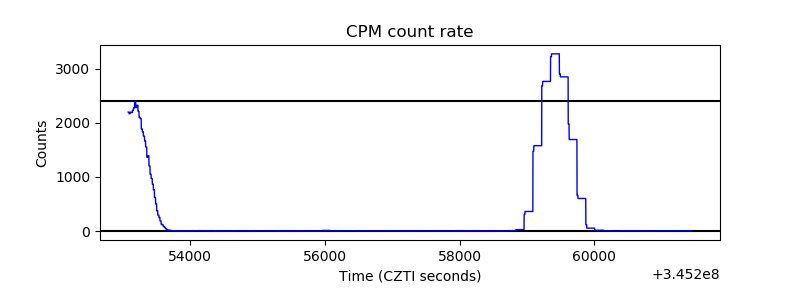 |
| CZT Counter | 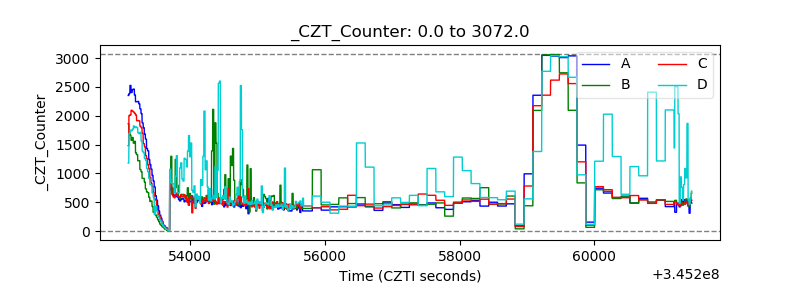 |
| +2.5 Volts monitor |  |
| +5 Volts monitor |  |
| _ROLL_ROT | 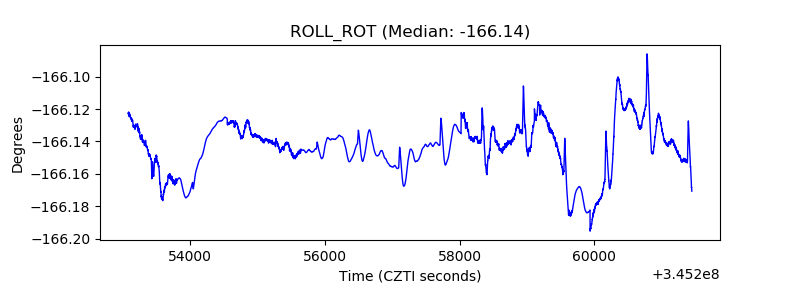 |
| _Roll_DEC | 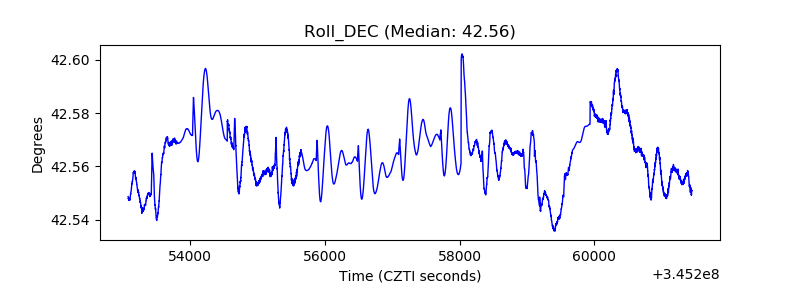 |
| _Roll_RA | 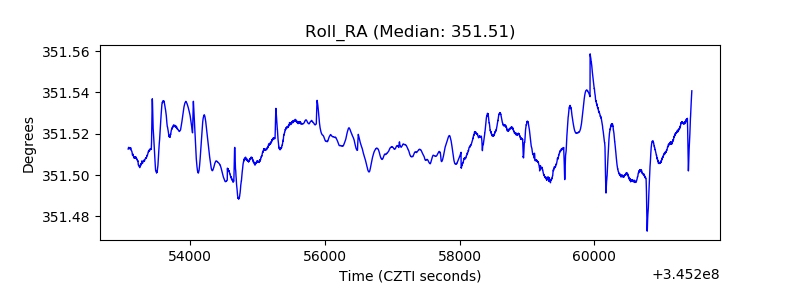 |
| Veto Counter | 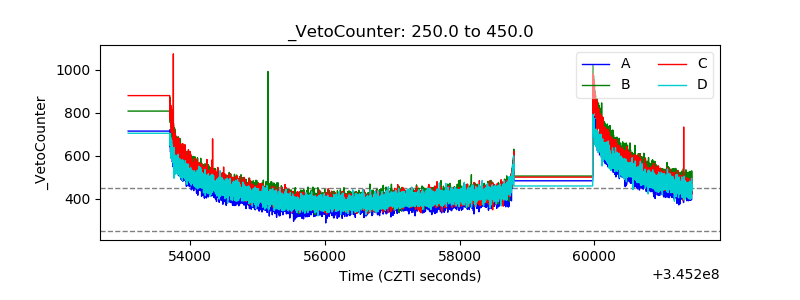 |