| Param | Original file | Final file |
|---|---|---|
| Filename | modeM0/AS1A10_090T14_9000004064_28123cztM0_level2.evt | modeM0/AS1A10_090T14_9000004064_28123cztM0_level2_quad_clean.evt |
| Size (bytes) | 579,864,960 | 66,830,400 |
| Size | 553.0 MB | 63.7 MB |
| Events in quadrant A | 3,296,299 | 417,715 |
| Events in quadrant B | 3,404,912 | 424,837 |
| Events in quadrant C | 3,319,145 | 400,573 |
| Events in quadrant D | 7,108,070 | 334,469 |
| Mode M9 | |||
|---|---|---|---|
| Quadrant | BADHDUFLAG | Total packets | Discarded packets |
| A | 0 | 20 | 0 |
| B | 0 | 21 | 0 |
| C | 0 | 21 | 0 |
| D | 0 | 21 | 0 |
| Mode M0 | |||
|---|---|---|---|
| Quadrant | BADHDUFLAG | Total packets | Discarded packets |
| A | 0 | 13720 | 0 |
| B | 0 | 14072 | 0 |
| C | 0 | 13826 | 0 |
| D | 0 | 25401 | 0 |
| Quadrant | Total seconds | Saturated seconds | Saturation percentage |
|---|---|---|---|
| A | 6392 | 29 | 0.453692% |
| B | 6392 | 32 | 0.500626% |
| C | 6392 | 74 | 1.157697% |
| D | 6391 | 1327 | 20.763574% |
Noise dominated data is calculated using 1-second bins in cleaned event files. If a bin has >2000 counts, and if more than 50% of those come from <1% of pixels, then it is considered to be noise-dominated and hence unusable.
| Quadrant | # 1 sec bins | Bins with >0 counts | Bins with >2000 counts | High rate bins dominated by noise | Noise dominated (total time) | Noise dominated (detector-on time) | Marked lightcurve |
|---|---|---|---|---|---|---|---|
| A | 7682 | 6393 | 0 | 0 | 0.00% | 0.00% | 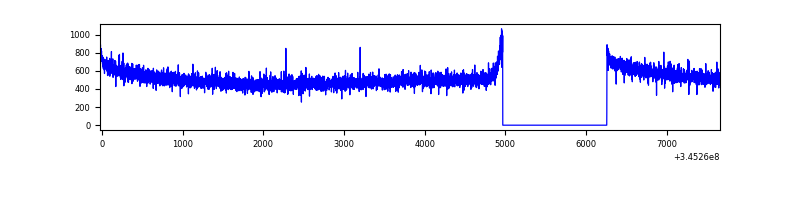 |
| B | 7682 | 6393 | 0 | 0 | 0.00% | 0.00% | 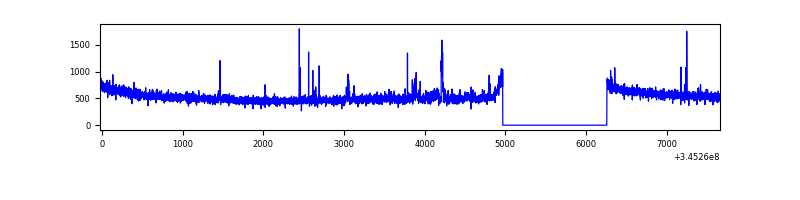 |
| C | 7682 | 6393 | 1 | 1 | 0.01% | 0.02% | 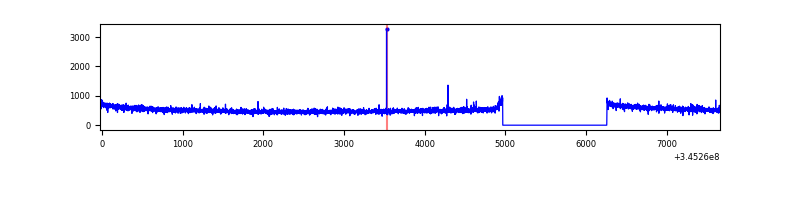 |
| D | 7681 | 6392 | 1153 | 1153 | 15.01% | 18.04% | 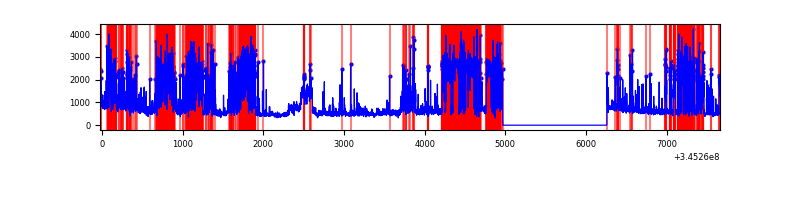 |
Top three noisy pixels from each quadrant. If the there are fewer than three noisy pixels in the level2.evt file, extra rows are filled as -1
| Pixel properties | Quadrant properties | ||||||
|---|---|---|---|---|---|---|---|
| Quadrant | DetID | PixID | Counts | Sigma | Mean | Median | Sigma |
| A | 13 | 254 | 9573 | 51.63 | 854 | 840 | 169.2 |
| A | 3 | 137 | 7641 | 40.21 | 854 | 840 | 169.2 |
| A | 0 | 226 | 7286 | 38.11 | 854 | 840 | 169.2 |
| B | 10 | 246 | 34023 | 209.3 | 851 | 830 | 158.6 |
| B | 10 | 245 | 24089 | 146.66 | 851 | 830 | 158.6 |
| B | 12 | 111 | 18917 | 114.05 | 851 | 830 | 158.6 |
| C | 14 | 238 | 134309 | 709.47 | 811 | 816 | 188.2 |
| C | 2 | 16 | 13302 | 66.36 | 811 | 816 | 188.2 |
| C | 3 | 233 | 7211 | 33.99 | 811 | 816 | 188.2 |
| D | 13 | 168 | 1808495 | 10551.2 | 725 | 709 | 171.3 |
| D | 12 | 2 | 1633824 | 9531.73 | 725 | 709 | 171.3 |
| D | 1 | 52 | 435232 | 2536.11 | 725 | 709 | 171.3 |
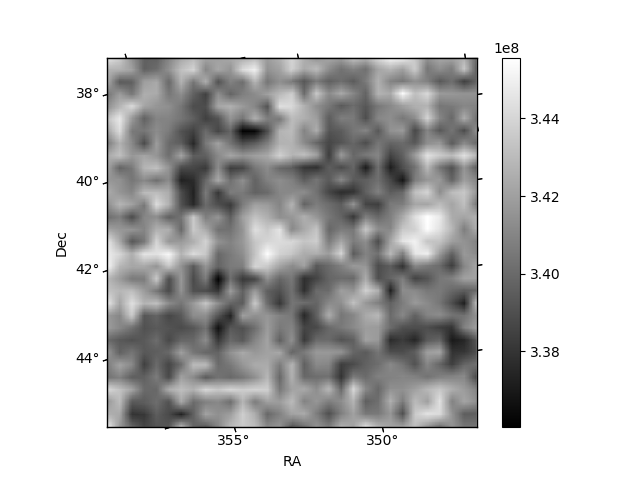
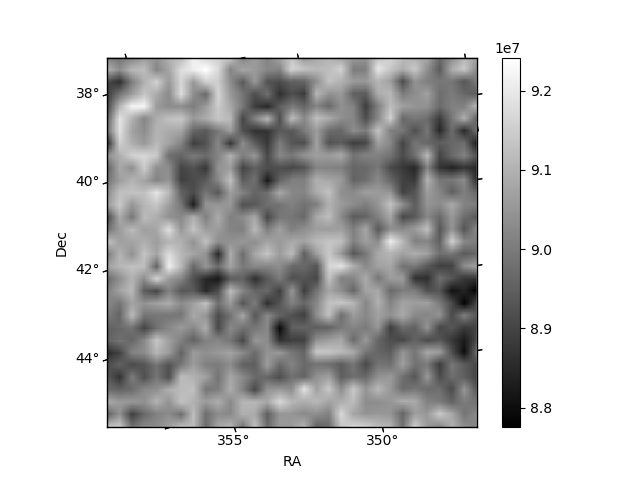
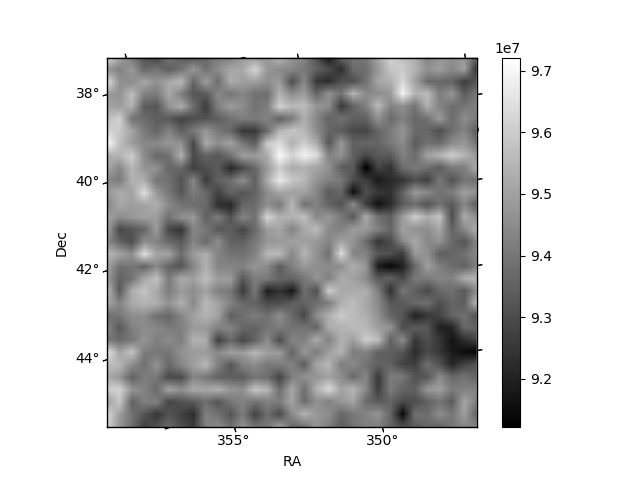
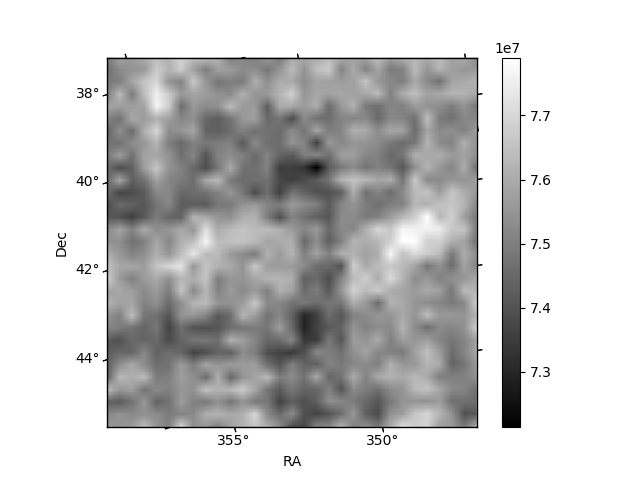
Histogram calculated using DETX and DETY for each event in the final _common_clean file
| Quadrant A | 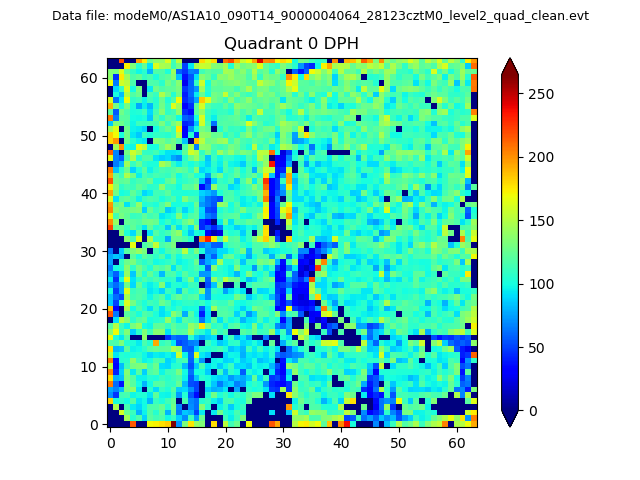 |
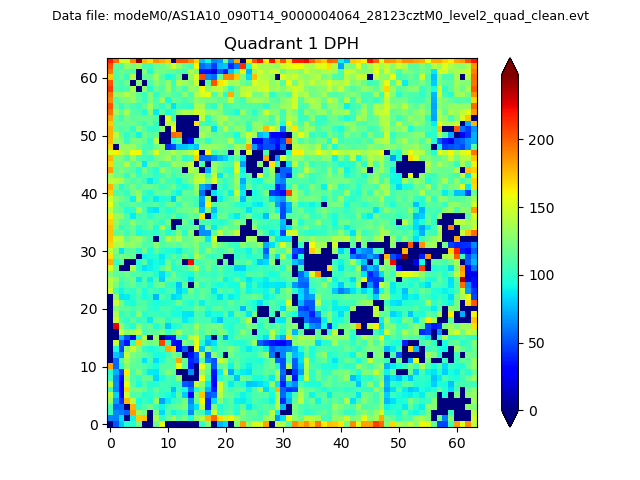 |
Quadrant B |
|---|---|---|---|
| Quadrant D |  |
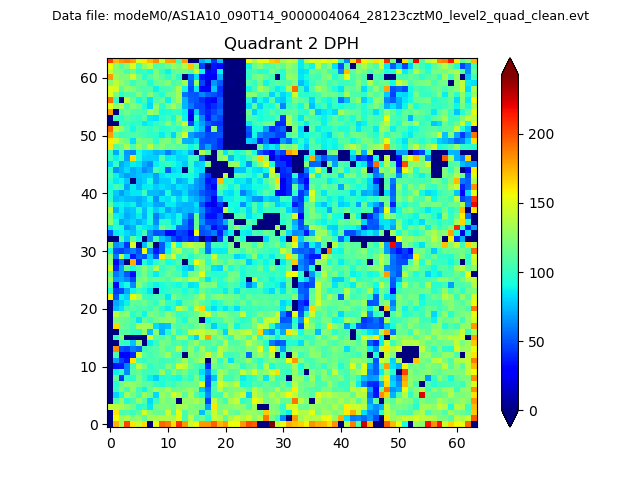 |
Quadrant C |
| Plot type | Count rate plots | Images |
|---|---|---|
| Comparison with Poisson distribution Blue bars denote a histogram of data divided into 1 sec bins. Red curve is a Poisson curve with rate = median count rate of data. |
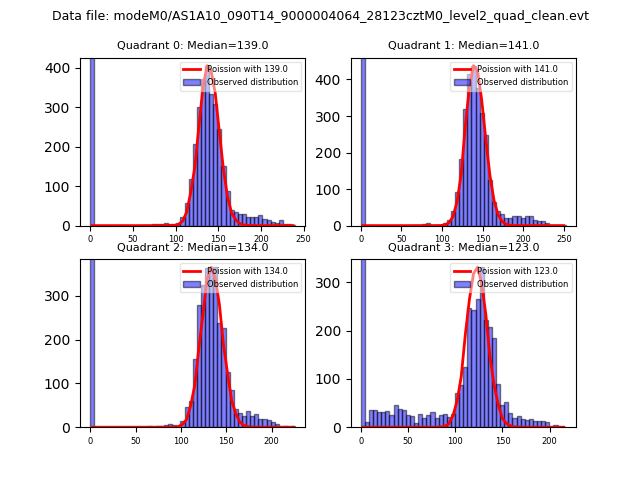 |
 |
| Quadrant-wise count rates Data is divided into 100 sec bins |
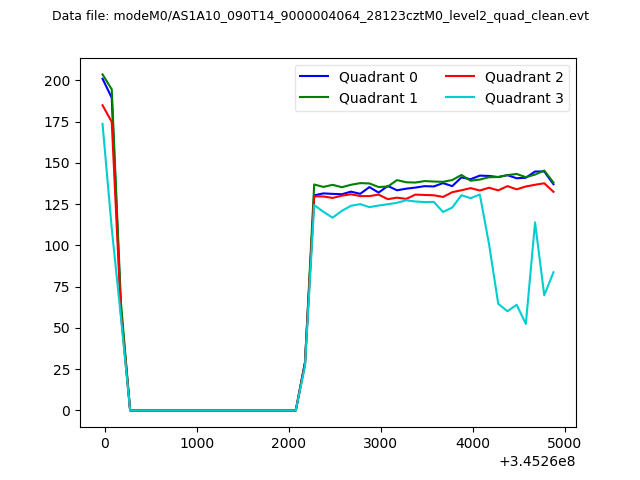 |
|
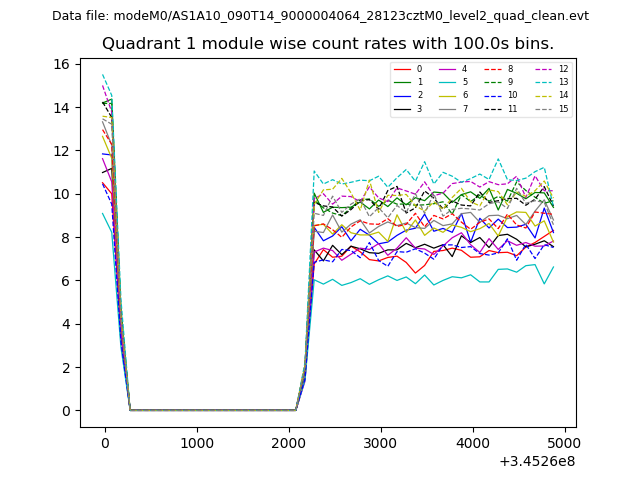
| Module-wise count rates for Quadrant A Data is divided into 100 sec bins |
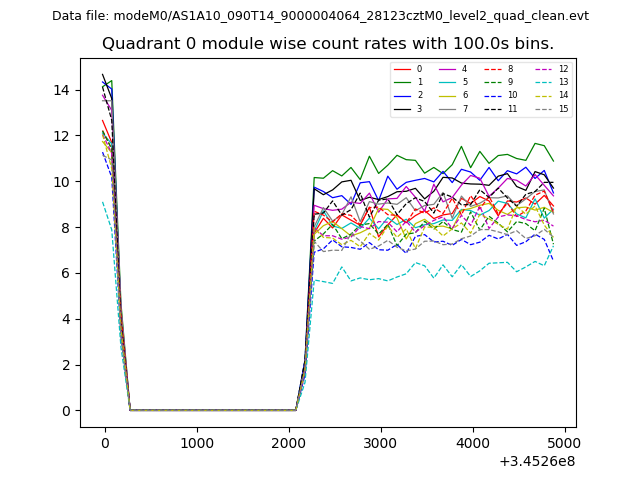 |
 |
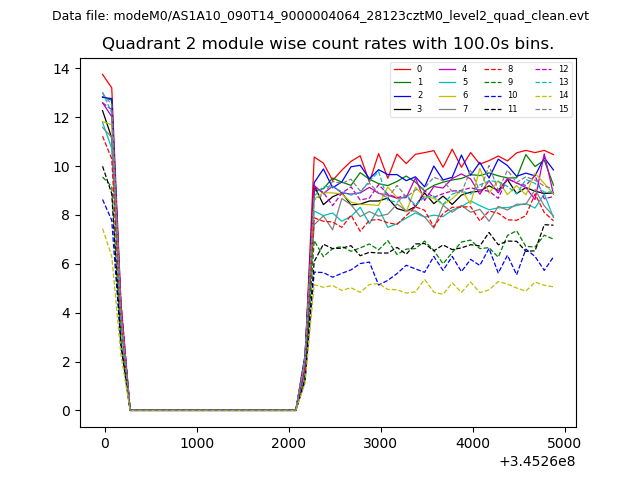
| Module-wise count rates for Quadrant B Data is divided into 100 sec bins |
 |
 |
| Module-wise count rates for Quadrant C Data is divided into 100 sec bins |
 |
 |
| Module-wise count rates for Quadrant D Data is divided into 100 sec bins |
 |
 |
| Parameter | Plot |
|---|---|
| CZT HV Monitor | 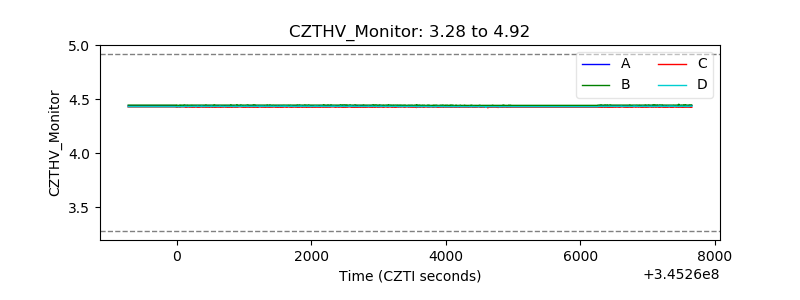 |
| D_VDD | 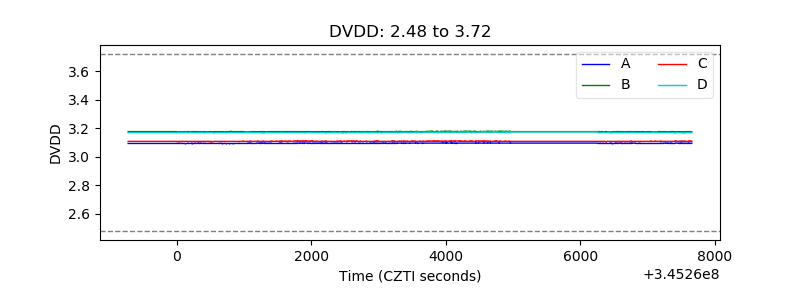 |
| Temperature 1 | 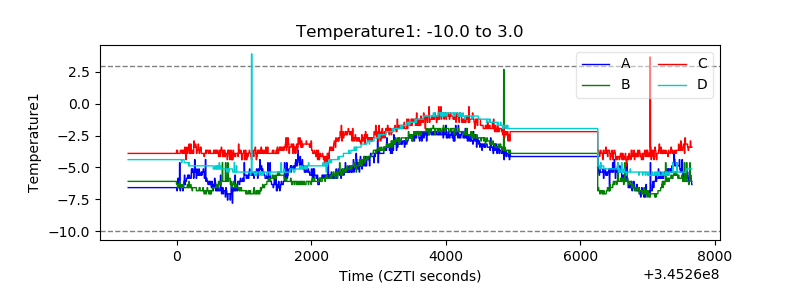 |
| Veto HV Monitor | 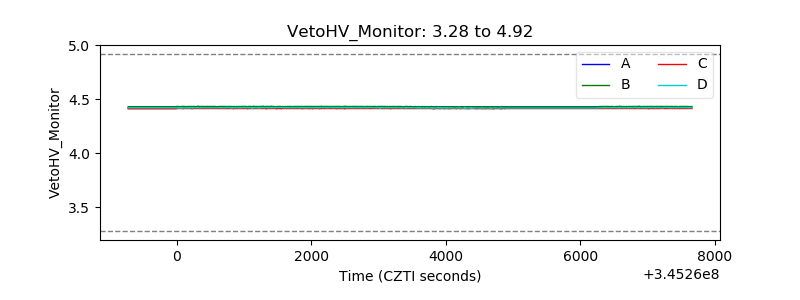 |
| Veto LLD | 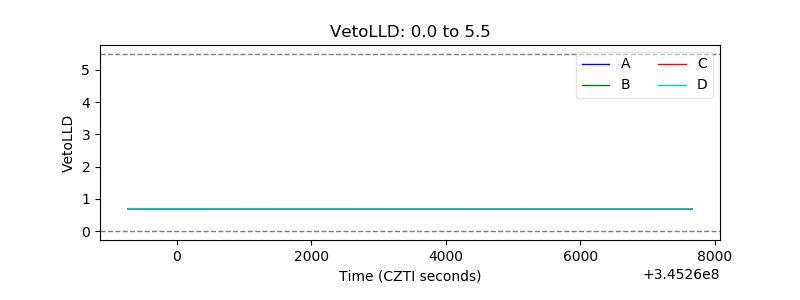 |
| Alpha Counter | 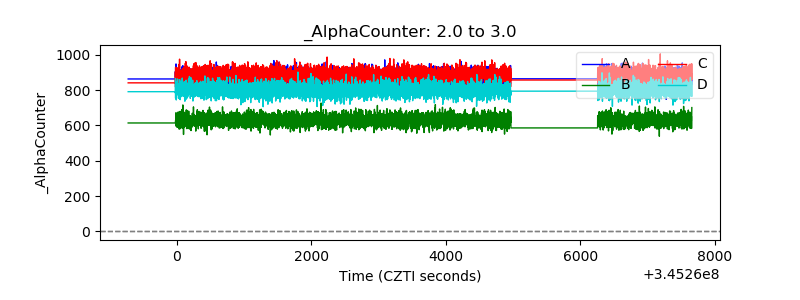 |
| _CPM_Rate | 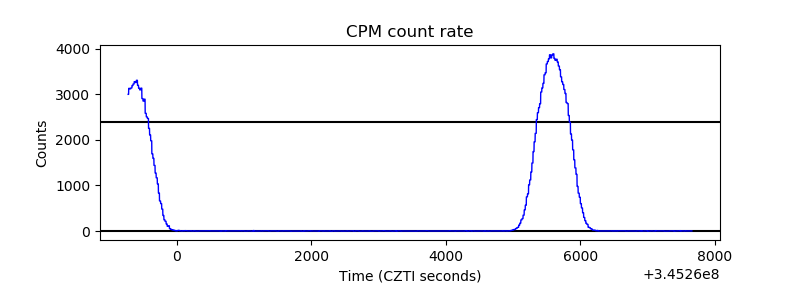 |
| CZT Counter | 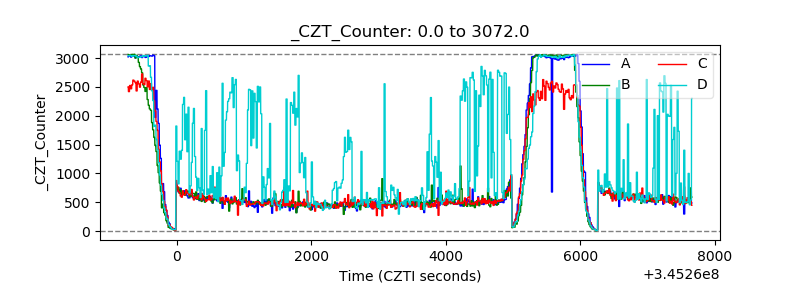 |
| +2.5 Volts monitor | 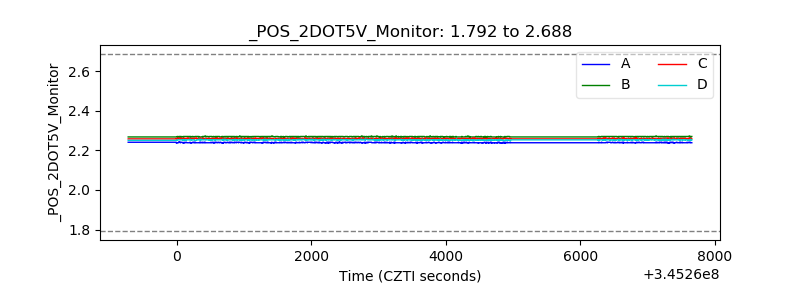 |
| +5 Volts monitor | 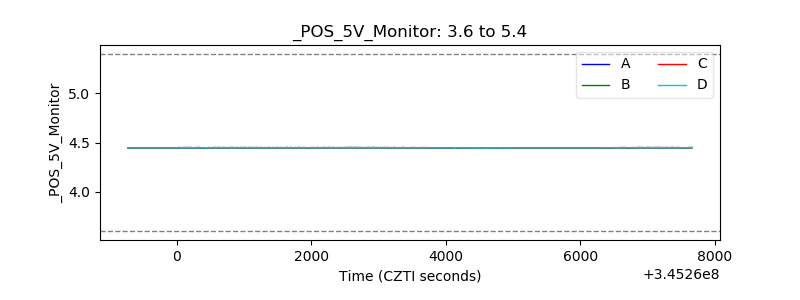 |
| _ROLL_ROT | 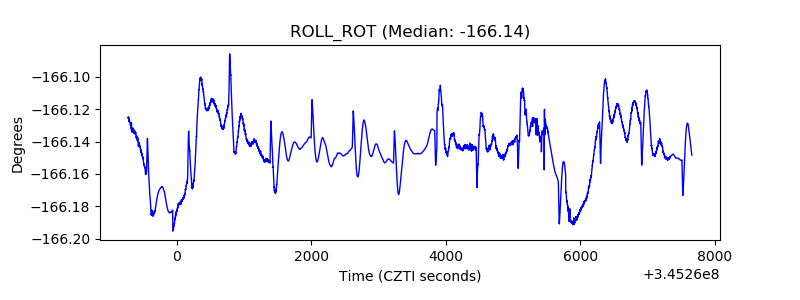 |
| _Roll_DEC | 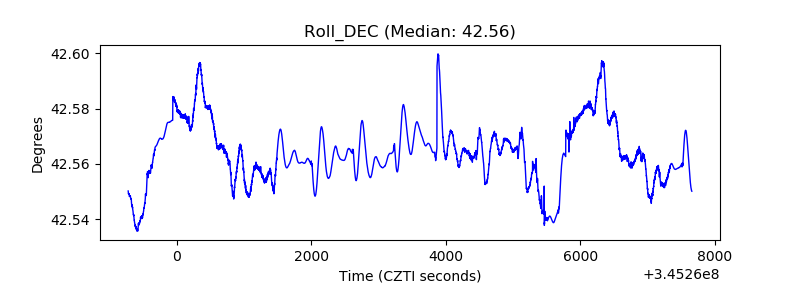 |
| _Roll_RA | 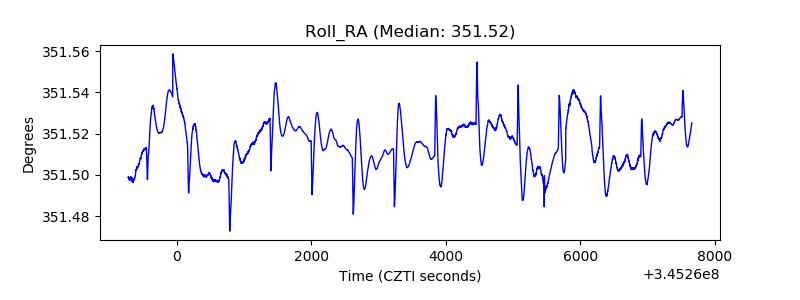 |
| Veto Counter | 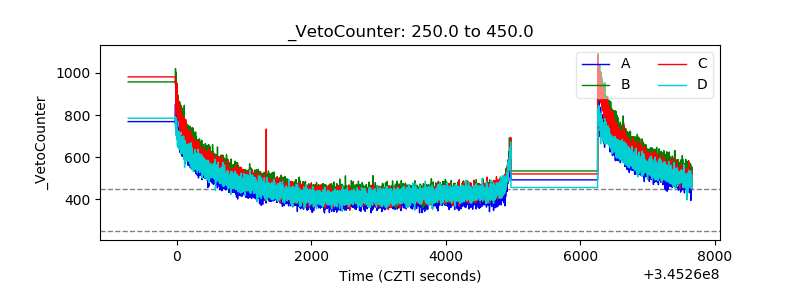 |