| Param | Original file | Final file |
|---|---|---|
| Filename | modeM0/AS1A10_090T14_9000004064_28124cztM0_level2.evt | modeM0/AS1A10_090T14_9000004064_28124cztM0_level2_quad_clean.evt |
| Size (bytes) | 497,111,040 | 70,940,160 |
| Size | 474.1 MB | 67.7 MB |
| Events in quadrant A | 3,252,309 | 446,483 |
| Events in quadrant B | 3,440,653 | 450,538 |
| Events in quadrant C | 3,232,727 | 423,859 |
| Events in quadrant D | 4,716,494 | 401,997 |
| Mode M9 | |||
|---|---|---|---|
| Quadrant | BADHDUFLAG | Total packets | Discarded packets |
| A | 0 | 14 | 0 |
| B | 0 | 14 | 0 |
| C | 0 | 14 | 0 |
| D | 0 | 14 | 0 |
| Mode M0 | |||
|---|---|---|---|
| Quadrant | BADHDUFLAG | Total packets | Discarded packets |
| A | 0 | 13273 | 0 |
| B | 0 | 13930 | 0 |
| C | 0 | 13259 | 0 |
| D | 0 | 17967 | 0 |
| Quadrant | Total seconds | Saturated seconds | Saturation percentage |
|---|---|---|---|
| A | 6092 | 57 | 0.935653% |
| B | 6093 | 75 | 1.230921% |
| C | 6093 | 85 | 1.395043% |
| D | 6093 | 364 | 5.974069% |
Noise dominated data is calculated using 1-second bins in cleaned event files. If a bin has >2000 counts, and if more than 50% of those come from <1% of pixels, then it is considered to be noise-dominated and hence unusable.
| Quadrant | # 1 sec bins | Bins with >0 counts | Bins with >2000 counts | High rate bins dominated by noise | Noise dominated (total time) | Noise dominated (detector-on time) | Marked lightcurve |
|---|---|---|---|---|---|---|---|
| A | 7427 | 6092 | 0 | 0 | 0.00% | 0.00% | 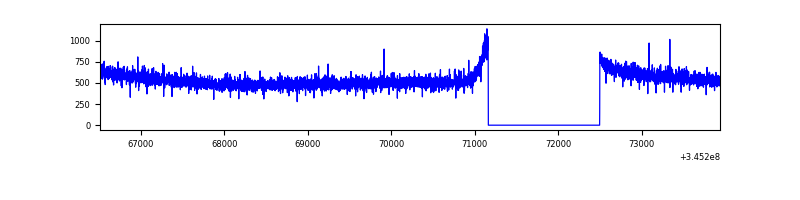 |
| B | 7428 | 6093 | 4 | 4 | 0.05% | 0.07% | 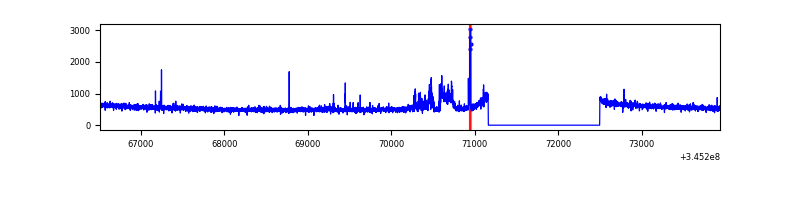 |
| C | 7428 | 6094 | 0 | 0 | 0.00% | 0.00% | 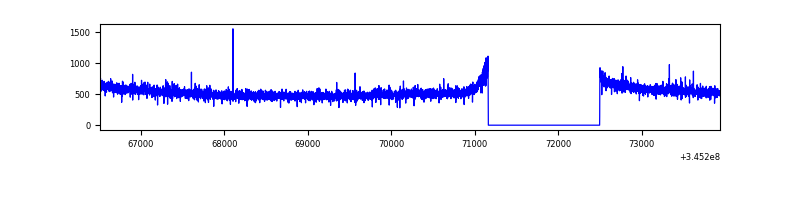 |
| D | 7428 | 6094 | 309 | 309 | 4.16% | 5.07% | 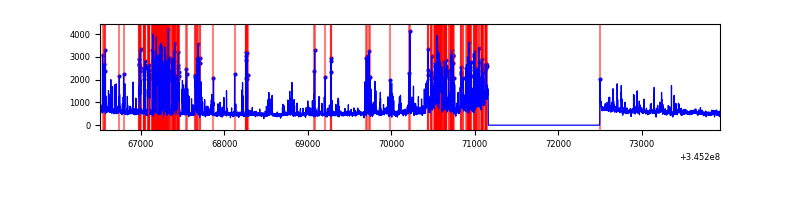 |
Top three noisy pixels from each quadrant. If the there are fewer than three noisy pixels in the level2.evt file, extra rows are filled as -1
| Pixel properties | Quadrant properties | ||||||
|---|---|---|---|---|---|---|---|
| Quadrant | DetID | PixID | Counts | Sigma | Mean | Median | Sigma |
| A | 13 | 254 | 8810 | 48.27 | 842 | 831 | 165.3 |
| A | 3 | 137 | 7433 | 39.94 | 842 | 831 | 165.3 |
| A | 0 | 226 | 7169 | 38.34 | 842 | 831 | 165.3 |
| B | 15 | 32 | 127541 | 815.46 | 837 | 820 | 155.4 |
| B | 5 | 255 | 24197 | 150.43 | 837 | 820 | 155.4 |
| B | 12 | 111 | 18289 | 112.41 | 837 | 820 | 155.4 |
| C | 14 | 238 | 131358 | 714.56 | 791 | 796 | 182.7 |
| C | 2 | 16 | 8937 | 44.56 | 791 | 796 | 182.7 |
| C | 3 | 233 | 7129 | 34.66 | 791 | 796 | 182.7 |
| D | 12 | 79 | 550946 | 2993.8 | 780 | 761 | 183.8 |
| D | 13 | 168 | 526997 | 2863.49 | 780 | 761 | 183.8 |
| D | 1 | 52 | 337922 | 1834.64 | 780 | 761 | 183.8 |
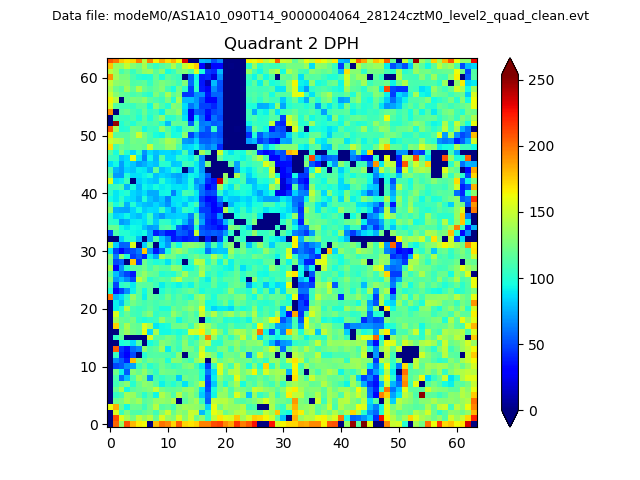
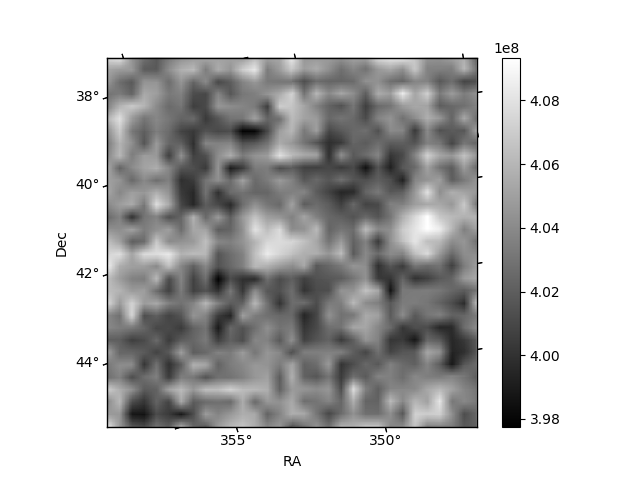
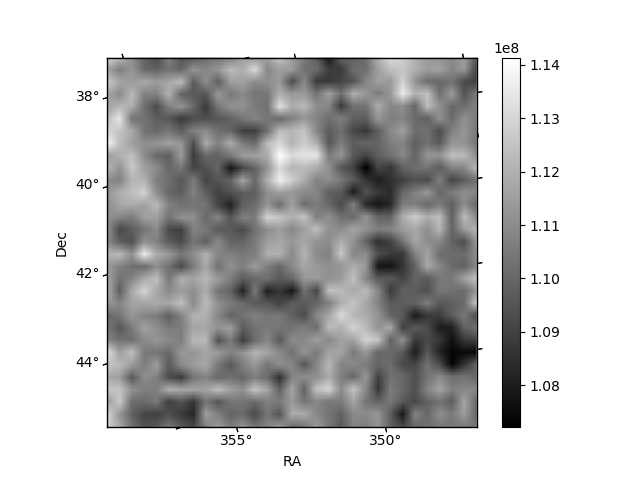
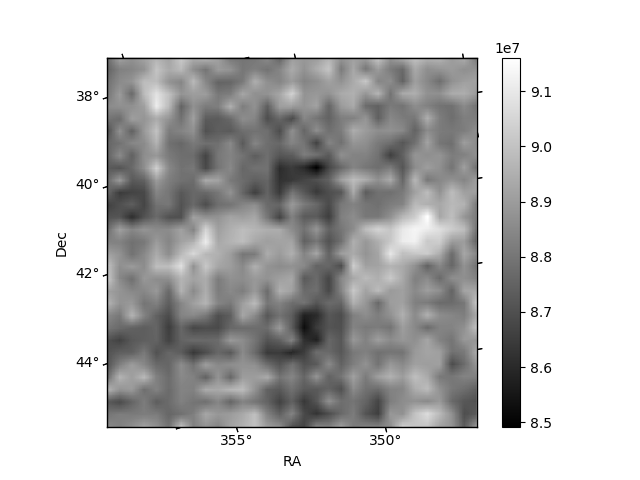
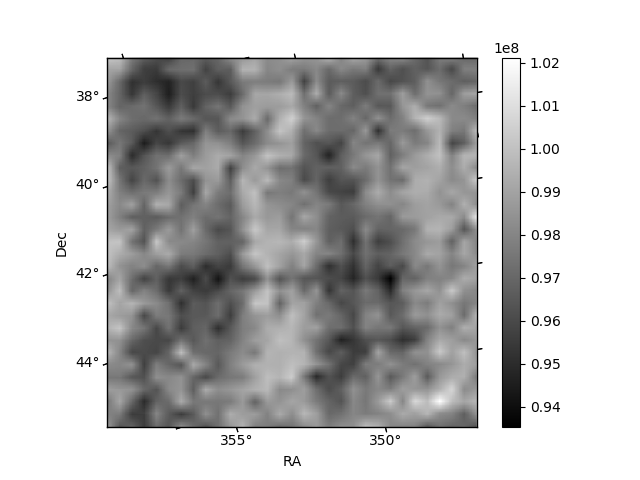
Histogram calculated using DETX and DETY for each event in the final _common_clean file
| Quadrant A | 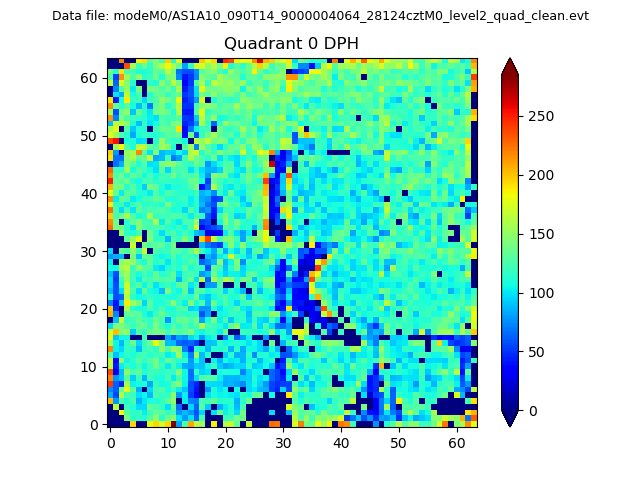 |
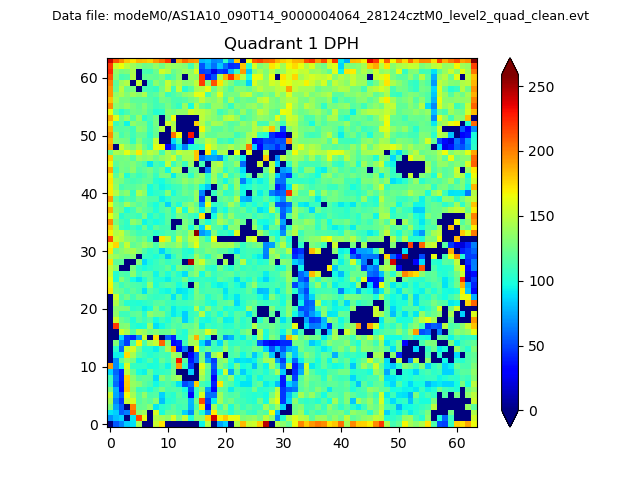 |
Quadrant B |
|---|---|---|---|
| Quadrant D | 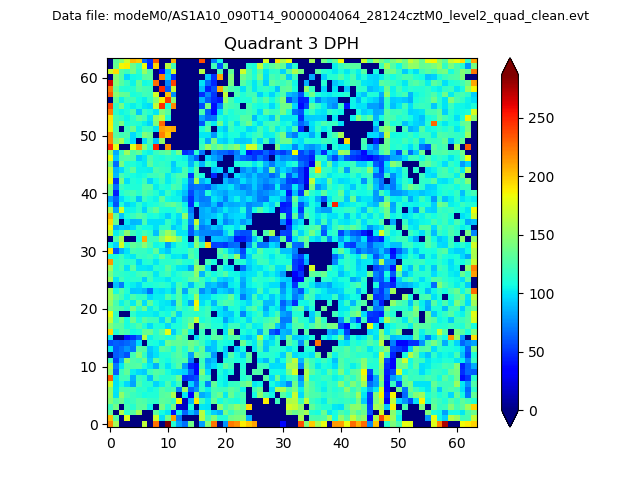 |
 |
Quadrant C |
| Plot type | Count rate plots | Images |
|---|---|---|
| Comparison with Poisson distribution Blue bars denote a histogram of data divided into 1 sec bins. Red curve is a Poisson curve with rate = median count rate of data. |
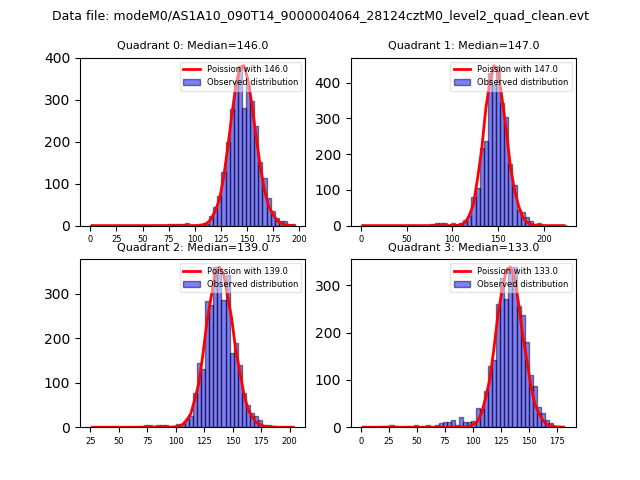 |
 |
| Quadrant-wise count rates Data is divided into 100 sec bins |
 |
|
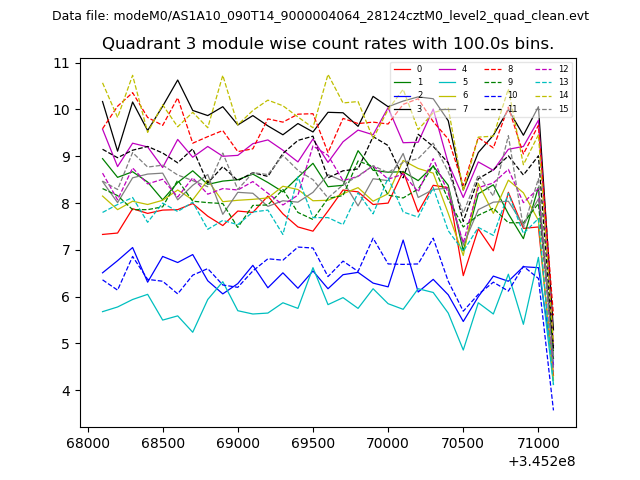
| Module-wise count rates for Quadrant A Data is divided into 100 sec bins |
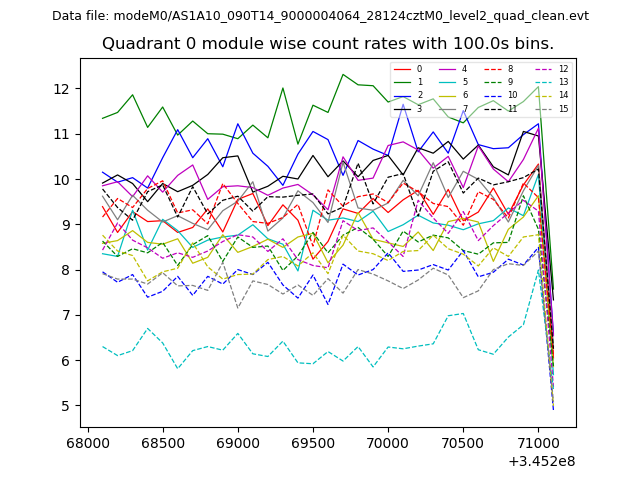 |
 |
| Module-wise count rates for Quadrant B Data is divided into 100 sec bins |
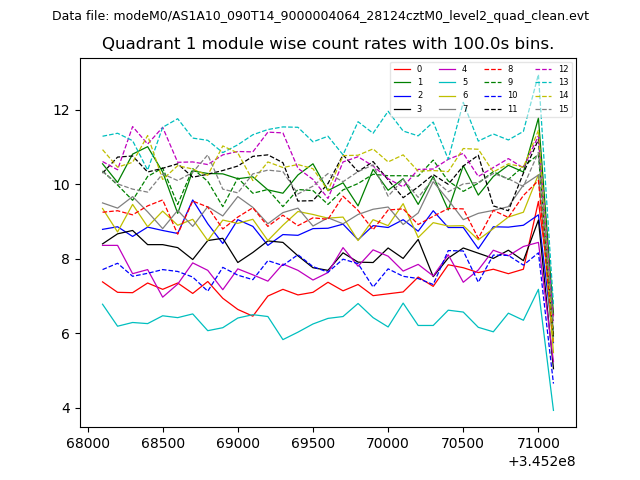 |
 |
| Module-wise count rates for Quadrant C Data is divided into 100 sec bins |
 |
 |
| Module-wise count rates for Quadrant D Data is divided into 100 sec bins |
 |
 |
| Parameter | Plot |
|---|---|
| CZT HV Monitor |  |
| D_VDD | 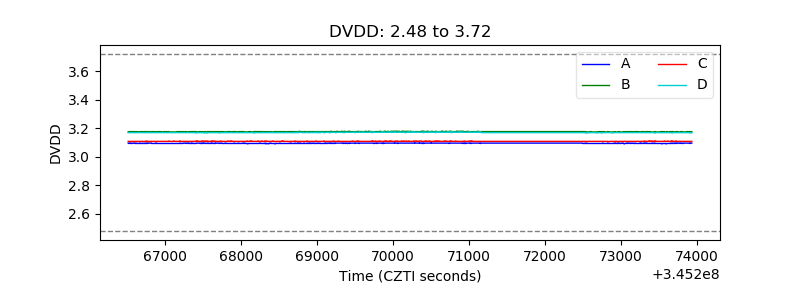 |
| Temperature 1 | 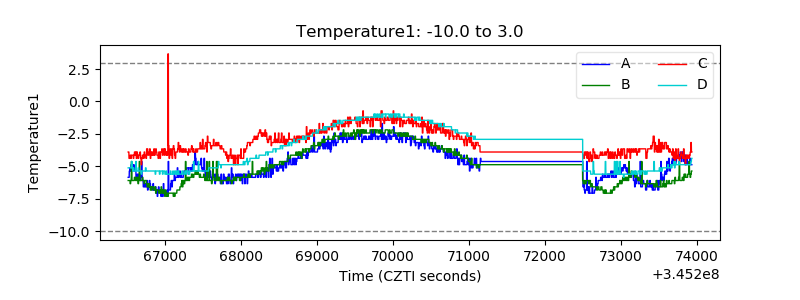 |
| Veto HV Monitor | 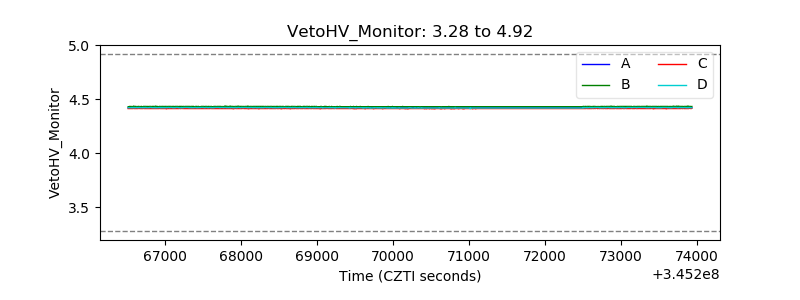 |
| Veto LLD | 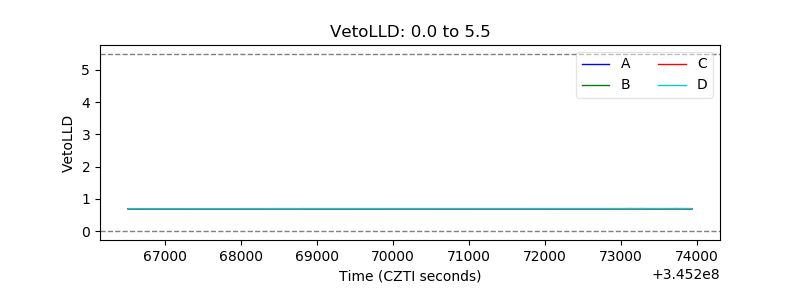 |
| Alpha Counter |  |
| _CPM_Rate | 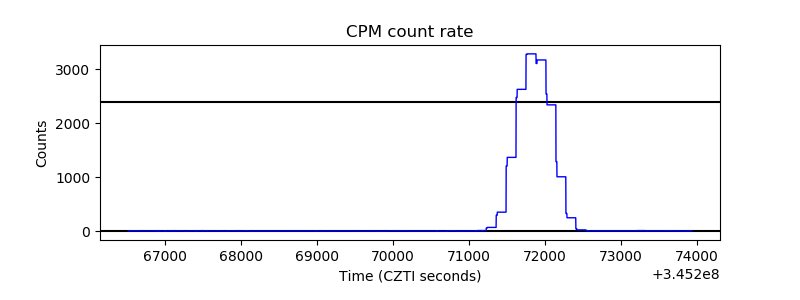 |
| CZT Counter | 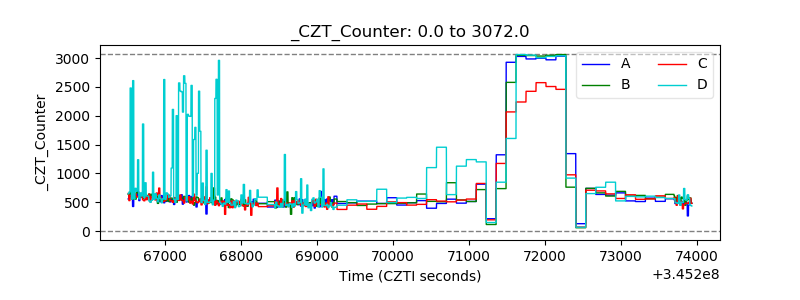 |
| +2.5 Volts monitor |  |
| +5 Volts monitor |  |
| _ROLL_ROT | 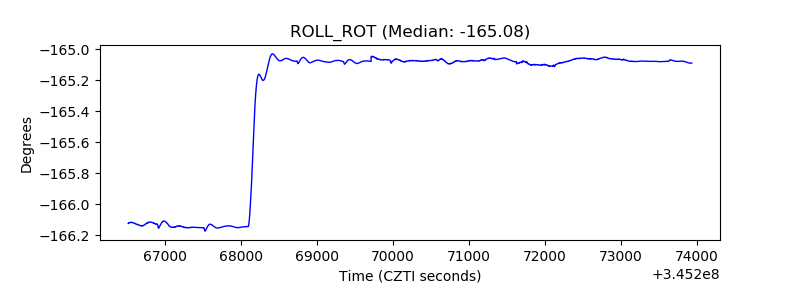 |
| _Roll_DEC | 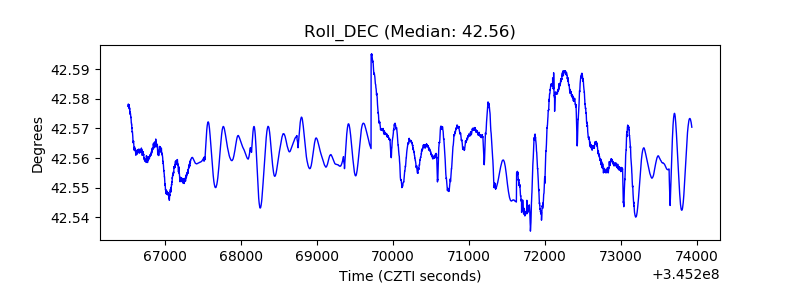 |
| _Roll_RA | 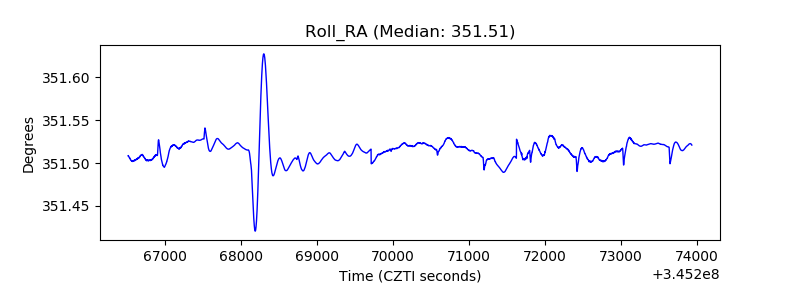 |
| Veto Counter | 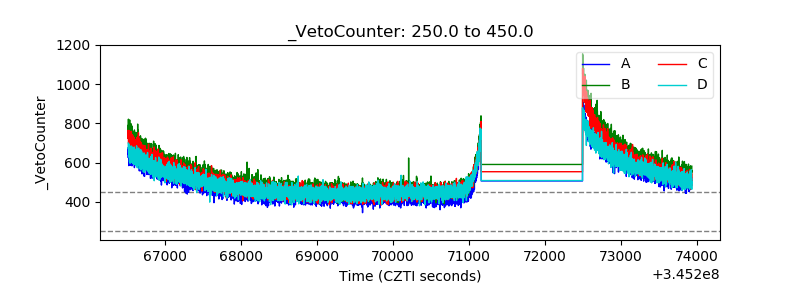 |