| Param | Original file | Final file |
|---|---|---|
| Filename | modeM0/AS1A10_090T14_9000004064_28125cztM0_level2.evt | modeM0/AS1A10_090T14_9000004064_28125cztM0_level2_quad_clean.evt |
| Size (bytes) | 506,229,120 | 85,305,600 |
| Size | 482.8 MB | 81.4 MB |
| Events in quadrant A | 3,582,839 | 556,369 |
| Events in quadrant B | 3,407,021 | 566,184 |
| Events in quadrant C | 3,360,559 | 524,951 |
| Events in quadrant D | 4,563,998 | 506,421 |
| Mode M9 | |||
|---|---|---|---|
| Quadrant | BADHDUFLAG | Total packets | Discarded packets |
| A | 0 | 13 | 0 |
| B | 0 | 13 | 0 |
| C | 0 | 13 | 0 |
| D | 0 | 13 | 0 |
| Mode M0 | |||
|---|---|---|---|
| Quadrant | BADHDUFLAG | Total packets | Discarded packets |
| A | 0 | 14310 | 0 |
| B | 0 | 13821 | 0 |
| C | 0 | 13687 | 0 |
| D | 0 | 17659 | 0 |
| Quadrant | Total seconds | Saturated seconds | Saturation percentage |
|---|---|---|---|
| A | 6150 | 177 | 2.878049% |
| B | 6150 | 104 | 1.691057% |
| C | 6151 | 127 | 2.064705% |
| D | 6151 | 205 | 3.332791% |
Noise dominated data is calculated using 1-second bins in cleaned event files. If a bin has >2000 counts, and if more than 50% of those come from <1% of pixels, then it is considered to be noise-dominated and hence unusable.
| Quadrant | # 1 sec bins | Bins with >0 counts | Bins with >2000 counts | High rate bins dominated by noise | Noise dominated (total time) | Noise dominated (detector-on time) | Marked lightcurve |
|---|---|---|---|---|---|---|---|
| A | 7465 | 6150 | 82 | 82 | 1.10% | 1.33% | 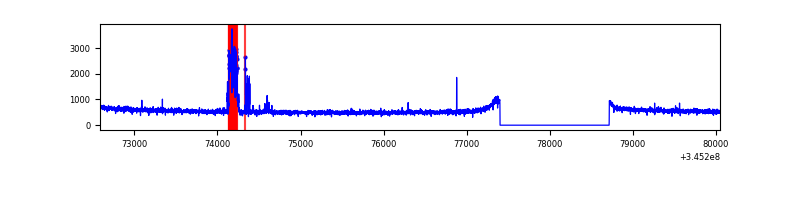 |
| B | 7465 | 6150 | 2 | 2 | 0.03% | 0.03% | 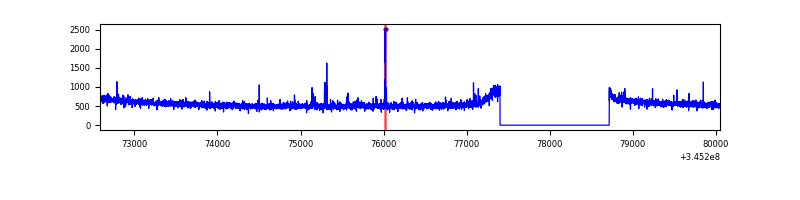 |
| C | 7466 | 6151 | 16 | 16 | 0.21% | 0.26% | 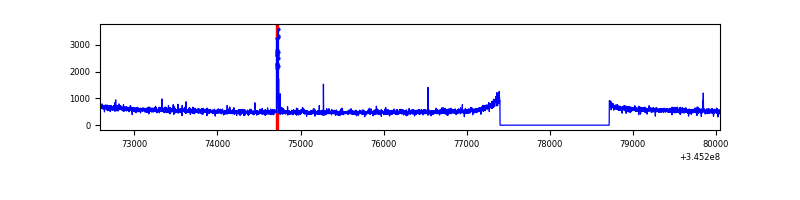 |
| D | 7466 | 6151 | 124 | 124 | 1.66% | 2.02% | 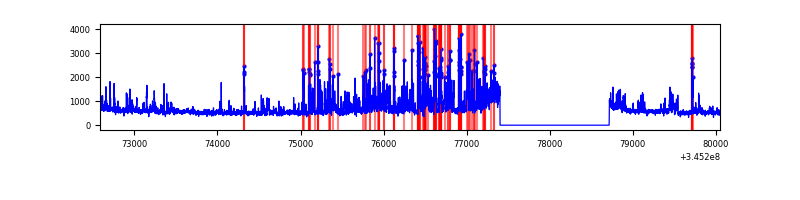 |
Top three noisy pixels from each quadrant. If the there are fewer than three noisy pixels in the level2.evt file, extra rows are filled as -1
| Pixel properties | Quadrant properties | ||||||
|---|---|---|---|---|---|---|---|
| Quadrant | DetID | PixID | Counts | Sigma | Mean | Median | Sigma |
| A | 15 | 174 | 263039 | 1560.42 | 860 | 847 | 168.0 |
| A | 13 | 254 | 8796 | 47.31 | 860 | 847 | 168.0 |
| A | 3 | 137 | 7494 | 39.56 | 860 | 847 | 168.0 |
| B | 10 | 245 | 22862 | 139.4 | 855 | 839 | 158.0 |
| B | 12 | 111 | 18680 | 112.93 | 855 | 839 | 158.0 |
| B | 11 | 111 | 17046 | 102.59 | 855 | 839 | 158.0 |
| C | 14 | 238 | 132921 | 703.62 | 805 | 812 | 187.8 |
| C | 2 | 16 | 67887 | 357.25 | 805 | 812 | 187.8 |
| C | 3 | 233 | 20125 | 102.86 | 805 | 812 | 187.8 |
| D | 1 | 52 | 564902 | 2966.16 | 810 | 791 | 190.2 |
| D | 12 | 79 | 551762 | 2897.07 | 810 | 791 | 190.2 |
| D | 7 | 223 | 118058 | 616.6 | 810 | 791 | 190.2 |
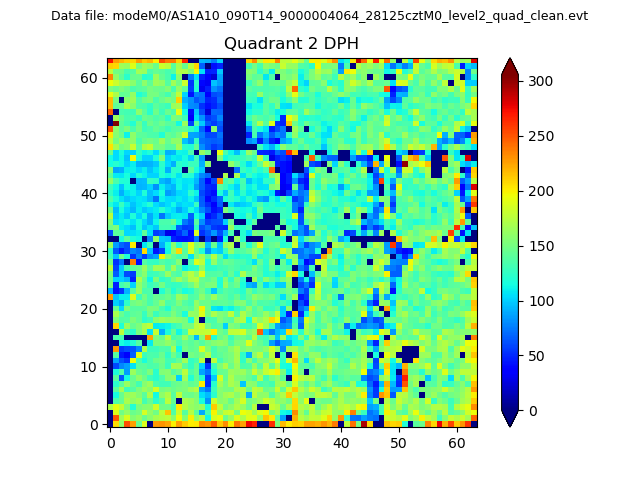
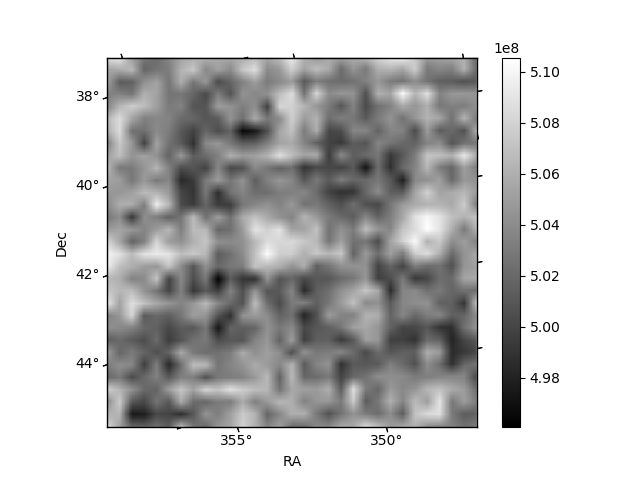
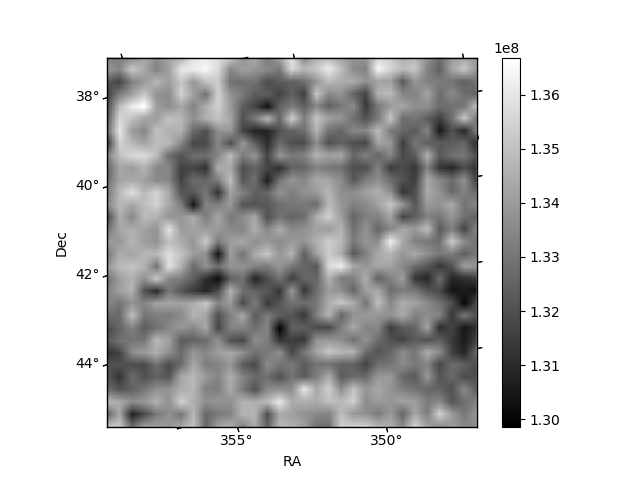
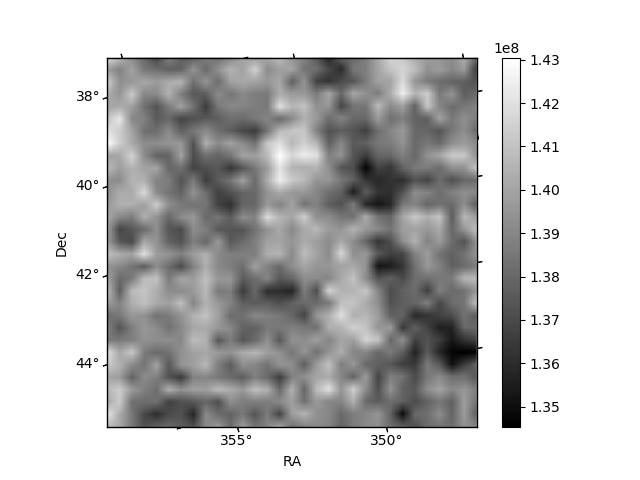
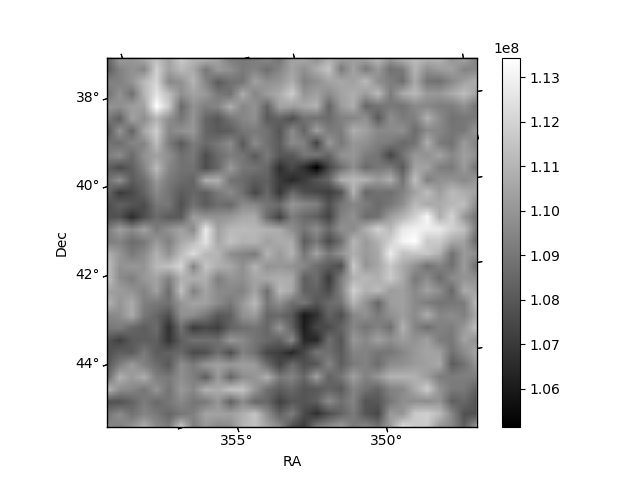
Histogram calculated using DETX and DETY for each event in the final _common_clean file
| Quadrant A | 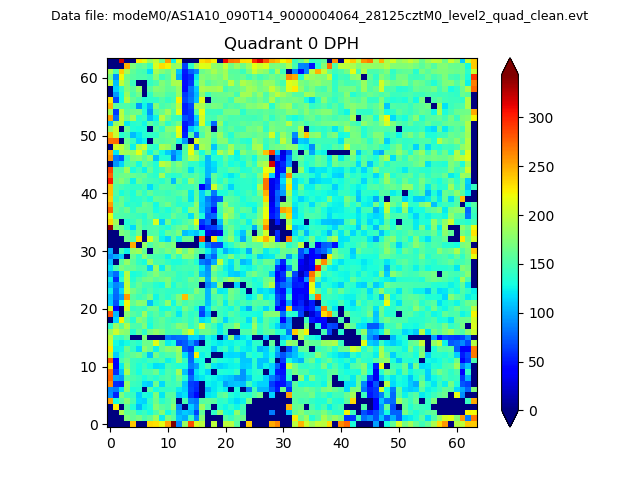 |
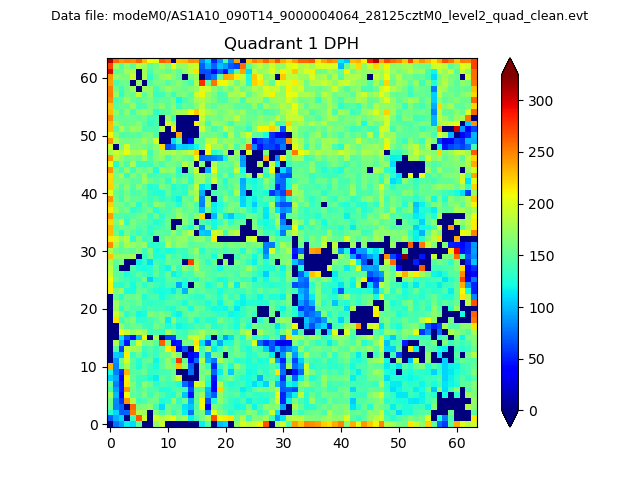 |
Quadrant B |
|---|---|---|---|
| Quadrant D | 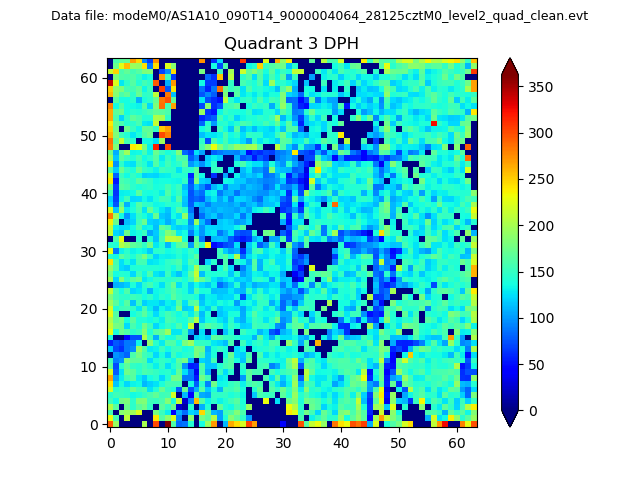 |
 |
Quadrant C |
| Plot type | Count rate plots | Images |
|---|---|---|
| Comparison with Poisson distribution Blue bars denote a histogram of data divided into 1 sec bins. Red curve is a Poisson curve with rate = median count rate of data. |
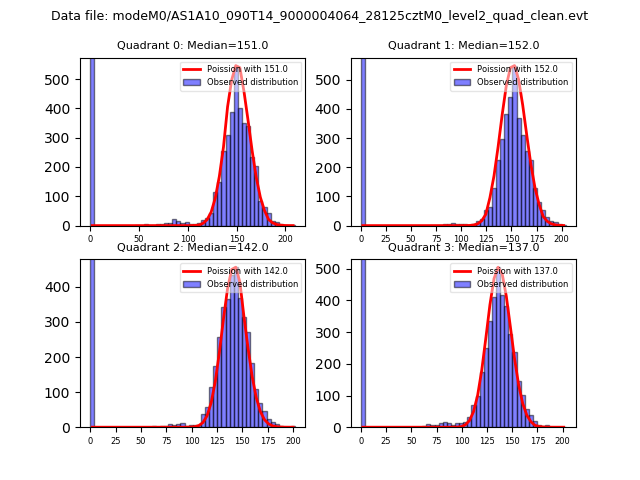 |
 |
| Quadrant-wise count rates Data is divided into 100 sec bins |
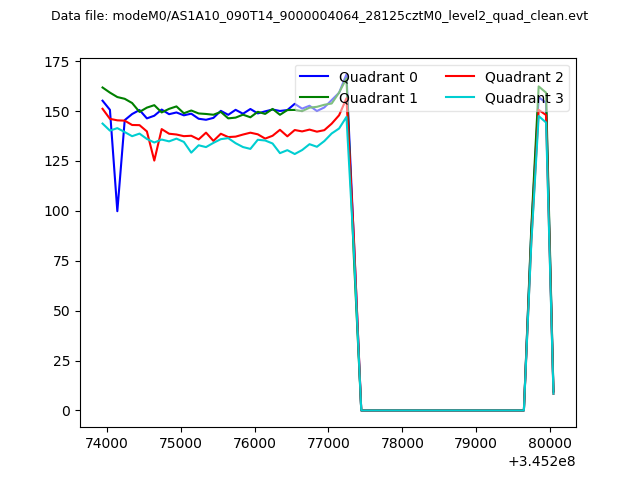 |
|
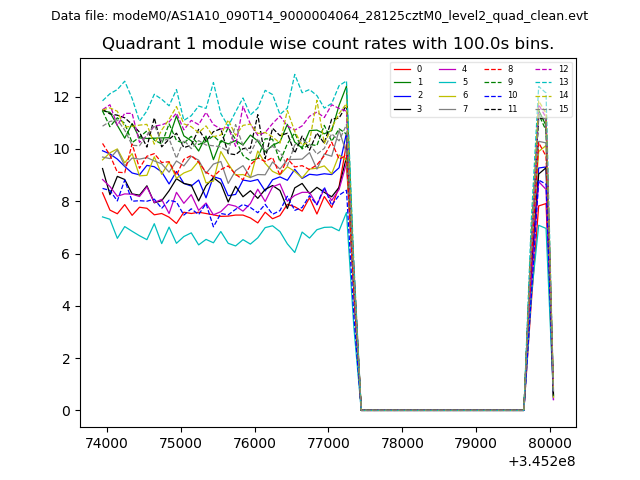
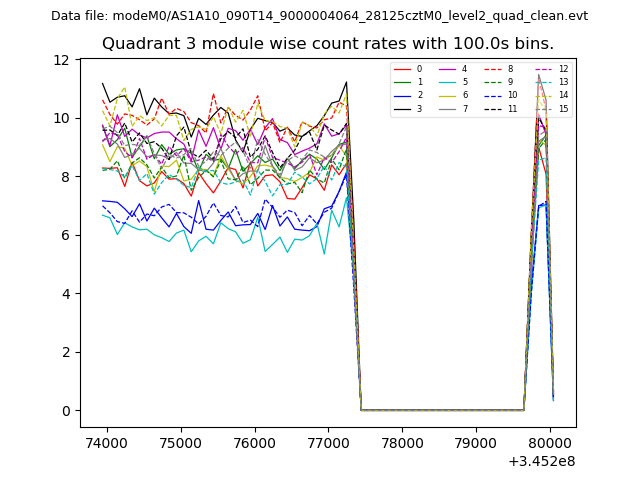
| Module-wise count rates for Quadrant A Data is divided into 100 sec bins |
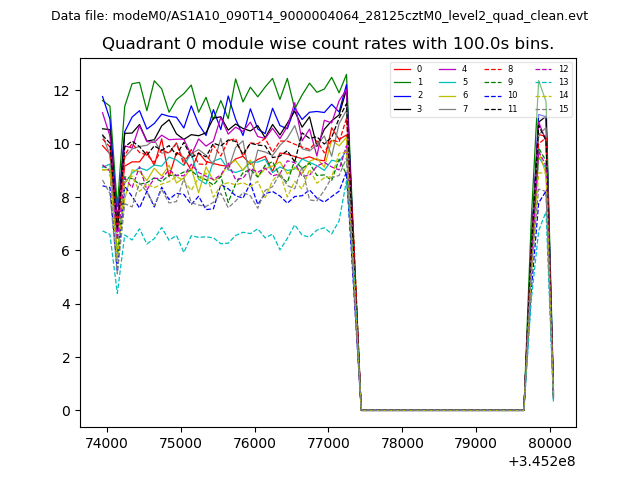 |
 |
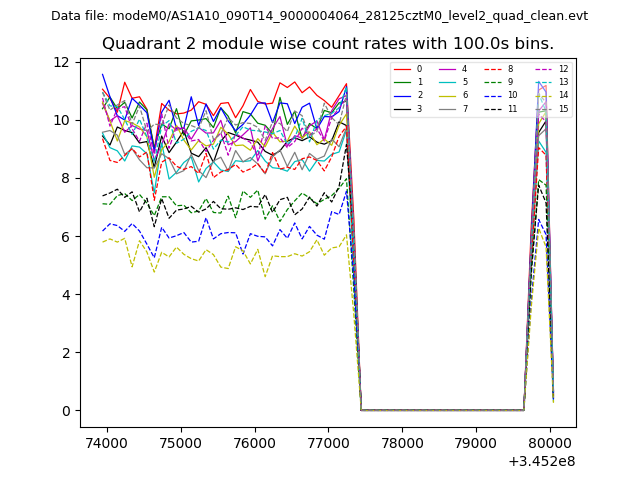
| Module-wise count rates for Quadrant B Data is divided into 100 sec bins |
 |
 |
| Module-wise count rates for Quadrant C Data is divided into 100 sec bins |
 |
 |
| Module-wise count rates for Quadrant D Data is divided into 100 sec bins |
 |
 |
| Parameter | Plot |
|---|---|
| CZT HV Monitor | 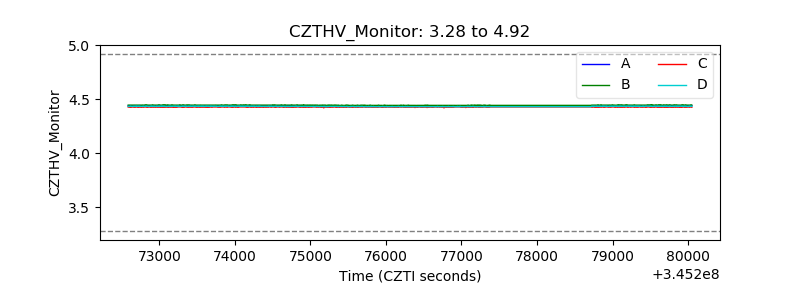 |
| D_VDD | 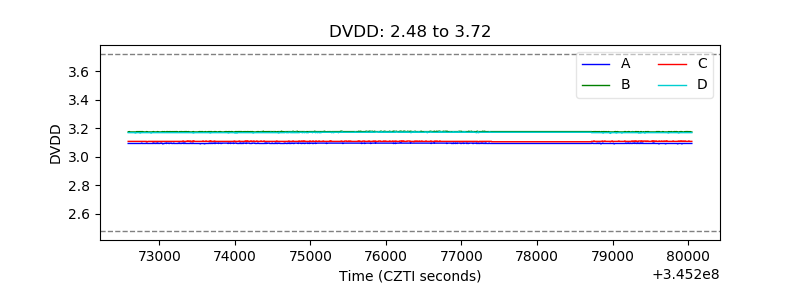 |
| Temperature 1 | 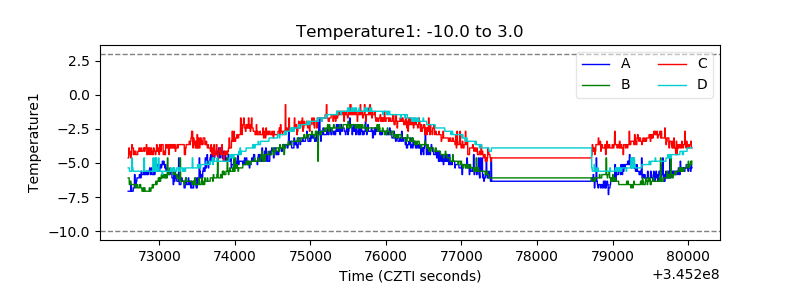 |
| Veto HV Monitor | 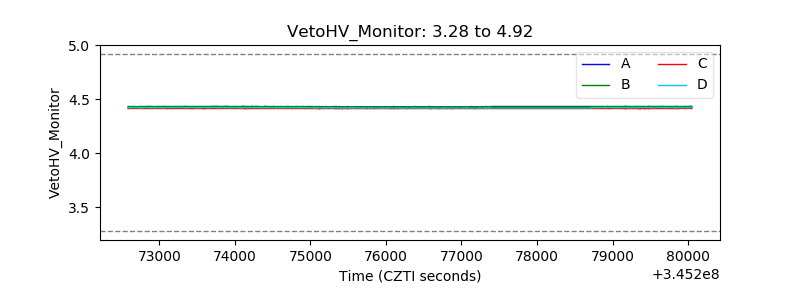 |
| Veto LLD | 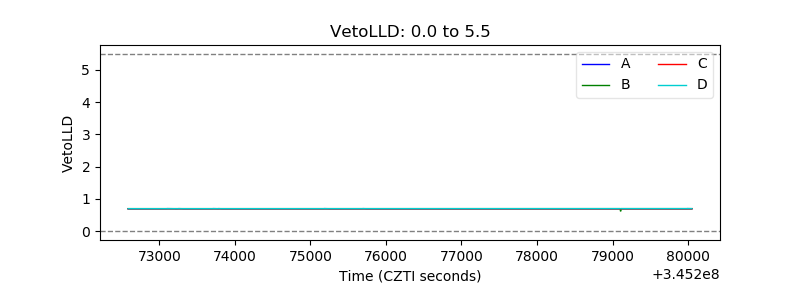 |
| Alpha Counter | 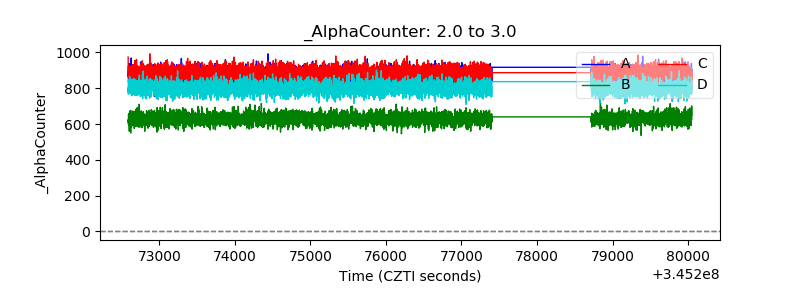 |
| _CPM_Rate | 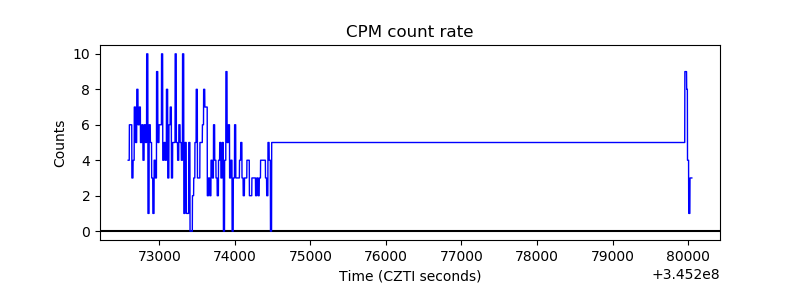 |
| CZT Counter | 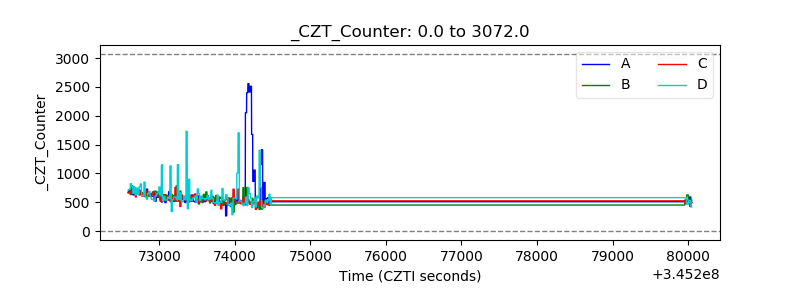 |
| +2.5 Volts monitor |  |
| +5 Volts monitor |  |
| _ROLL_ROT |  |
| _Roll_DEC |  |
| _Roll_RA | 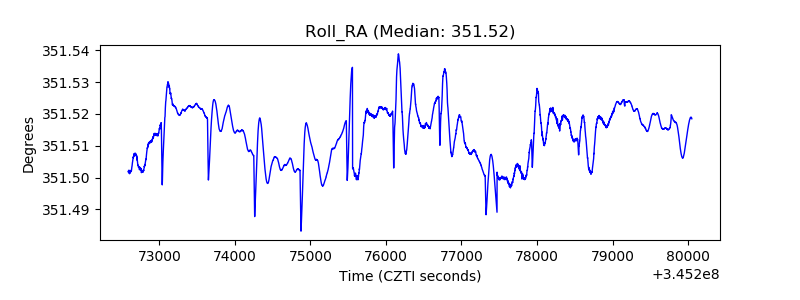 |
| Veto Counter | 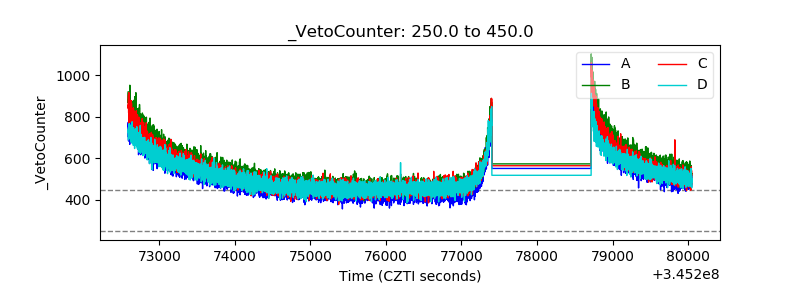 |