| Param | Original file | Final file |
|---|---|---|
| Filename | modeM0/AS1A10_090T14_9000004064_28126cztM0_level2.evt | modeM0/AS1A10_090T14_9000004064_28126cztM0_level2_quad_clean.evt |
| Size (bytes) | 543,366,720 | 99,921,600 |
| Size | 518.2 MB | 95.3 MB |
| Events in quadrant A | 3,381,130 | 672,297 |
| Events in quadrant B | 3,452,947 | 678,922 |
| Events in quadrant C | 3,384,500 | 632,327 |
| Events in quadrant D | 5,802,594 | 595,043 |
| Mode M9 | |||
|---|---|---|---|
| Quadrant | BADHDUFLAG | Total packets | Discarded packets |
| A | 0 | 14 | 0 |
| B | 0 | 15 | 0 |
| C | 0 | 15 | 0 |
| D | 0 | 15 | 0 |
| Mode M0 | |||
|---|---|---|---|
| Quadrant | BADHDUFLAG | Total packets | Discarded packets |
| A | 0 | 13762 | 0 |
| B | 0 | 14020 | 0 |
| C | 0 | 13868 | 0 |
| D | 0 | 21493 | 0 |
| Quadrant | Total seconds | Saturated seconds | Saturation percentage |
|---|---|---|---|
| A | 6414 | 95 | 1.481135% |
| B | 6414 | 140 | 2.182725% |
| C | 6414 | 121 | 1.886498% |
| D | 6413 | 449 | 7.001403% |
Noise dominated data is calculated using 1-second bins in cleaned event files. If a bin has >2000 counts, and if more than 50% of those come from <1% of pixels, then it is considered to be noise-dominated and hence unusable.
| Quadrant | # 1 sec bins | Bins with >0 counts | Bins with >2000 counts | High rate bins dominated by noise | Noise dominated (total time) | Noise dominated (detector-on time) | Marked lightcurve |
|---|---|---|---|---|---|---|---|
| A | 7654 | 6415 | 0 | 0 | 0.00% | 0.00% | 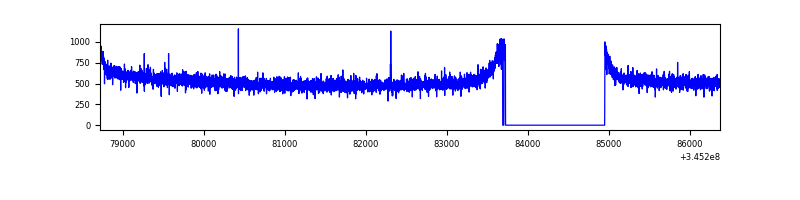 |
| B | 7654 | 6415 | 4 | 4 | 0.05% | 0.06% | 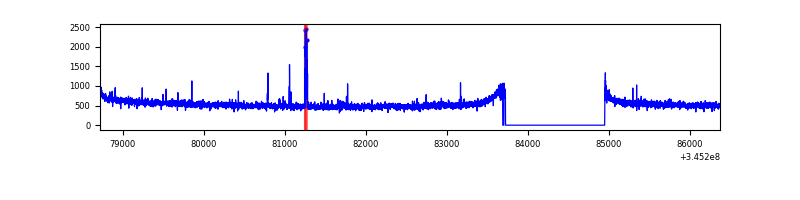 |
| C | 7654 | 6415 | 0 | 0 | 0.00% | 0.00% | 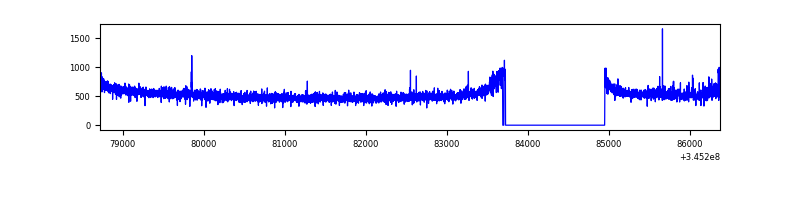 |
| D | 7653 | 6414 | 310 | 310 | 4.05% | 4.83% | 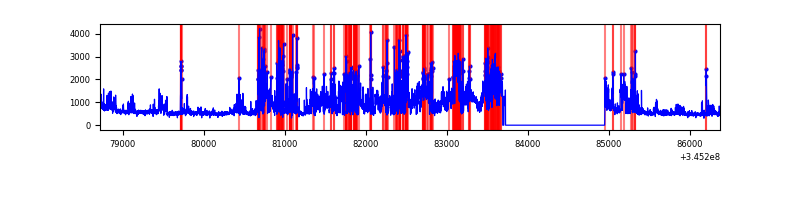 |
Top three noisy pixels from each quadrant. If the there are fewer than three noisy pixels in the level2.evt file, extra rows are filled as -1
| Pixel properties | Quadrant properties | ||||||
|---|---|---|---|---|---|---|---|
| Quadrant | DetID | PixID | Counts | Sigma | Mean | Median | Sigma |
| A | 13 | 254 | 9000 | 46.91 | 876 | 863 | 173.5 |
| A | 3 | 137 | 7832 | 40.17 | 876 | 863 | 173.5 |
| A | 0 | 226 | 7569 | 38.66 | 876 | 863 | 173.5 |
| B | 10 | 246 | 39291 | 236.87 | 864 | 846 | 162.3 |
| B | 12 | 111 | 19284 | 113.6 | 864 | 846 | 162.3 |
| B | 11 | 111 | 17720 | 103.97 | 864 | 846 | 162.3 |
| C | 14 | 238 | 134479 | 708.11 | 815 | 823 | 188.8 |
| C | 3 | 233 | 56908 | 297.14 | 815 | 823 | 188.8 |
| C | 15 | 208 | 10608 | 51.84 | 815 | 823 | 188.8 |
| D | 1 | 52 | 2153690 | 11227.28 | 811 | 793 | 191.8 |
| D | 2 | 250 | 206619 | 1073.38 | 811 | 793 | 191.8 |
| D | 12 | 79 | 111414 | 576.88 | 811 | 793 | 191.8 |
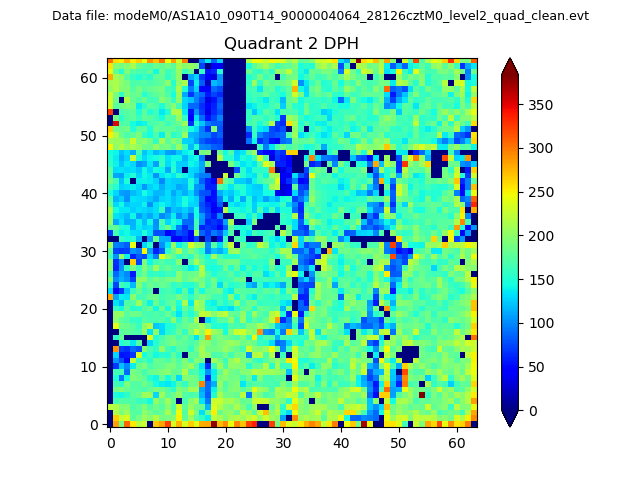
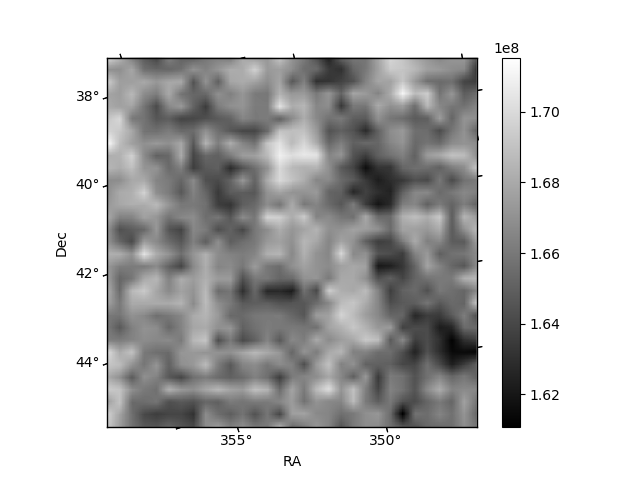
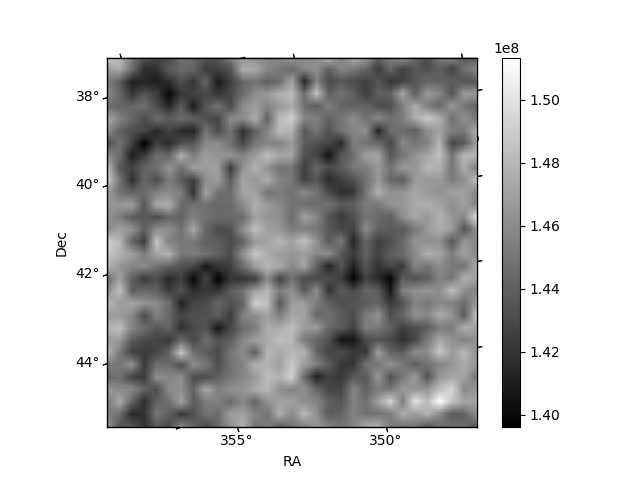
Histogram calculated using DETX and DETY for each event in the final _common_clean file
| Quadrant A | 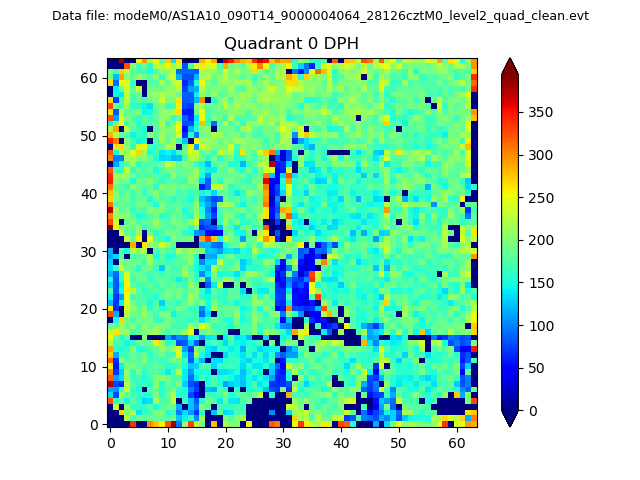 |
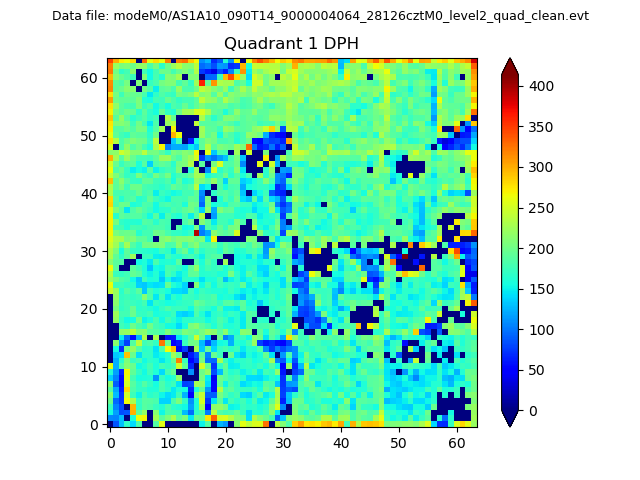 |
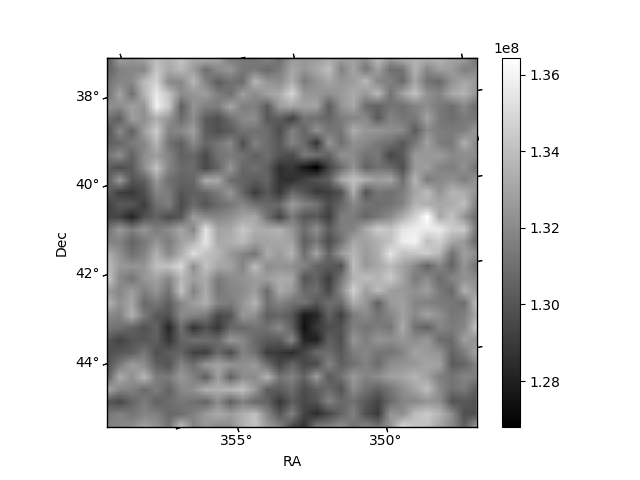
Quadrant B |
|---|---|---|---|
| Quadrant D | 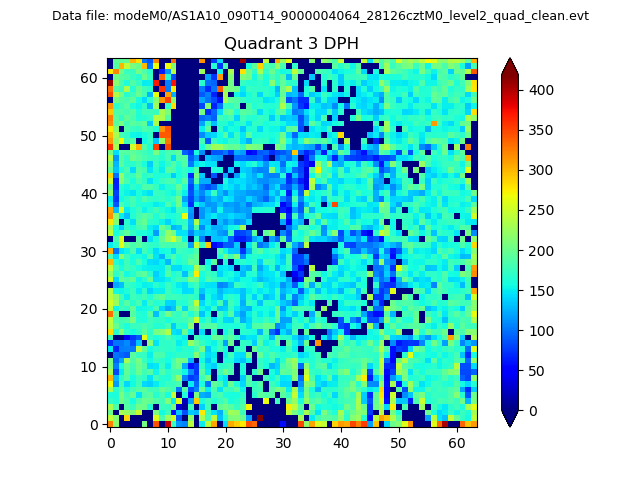 |
 |
Quadrant C |
| Plot type | Count rate plots | Images |
|---|---|---|
| Comparison with Poisson distribution Blue bars denote a histogram of data divided into 1 sec bins. Red curve is a Poisson curve with rate = median count rate of data. |
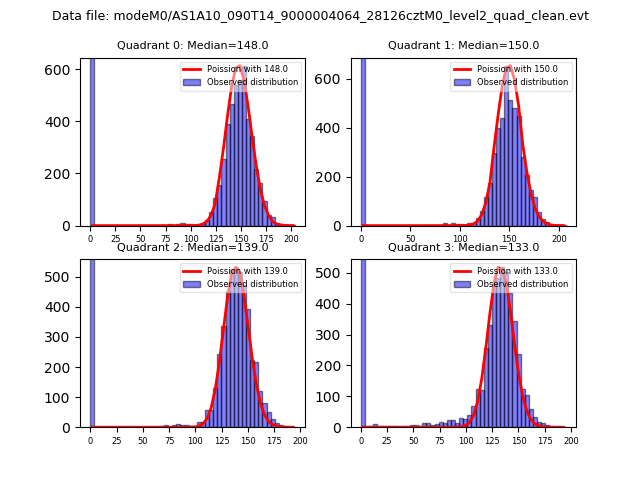 |
 |
| Quadrant-wise count rates Data is divided into 100 sec bins |
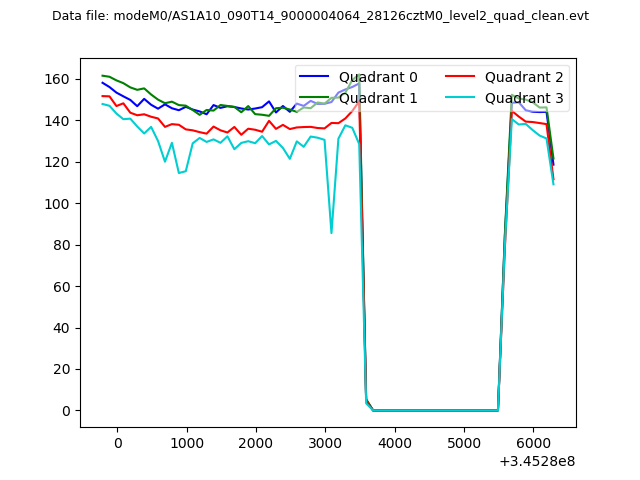 |
|
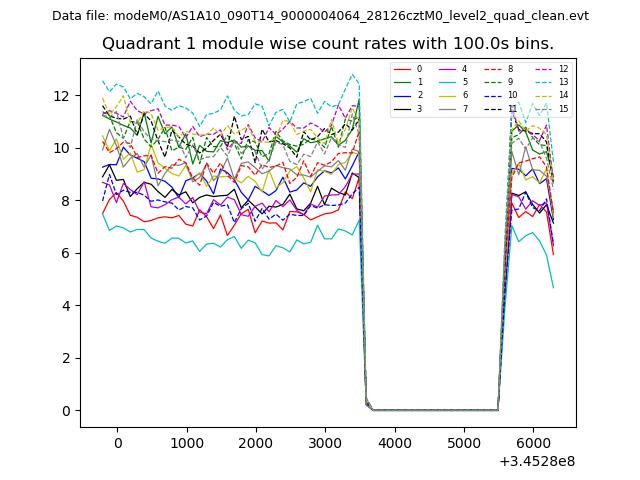
| Module-wise count rates for Quadrant A Data is divided into 100 sec bins |
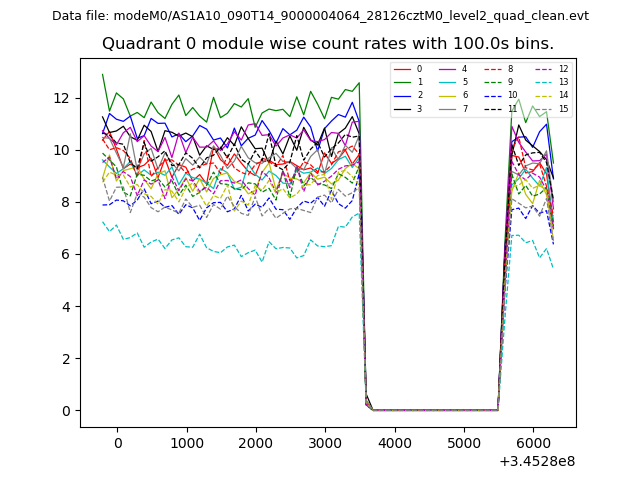 |
 |
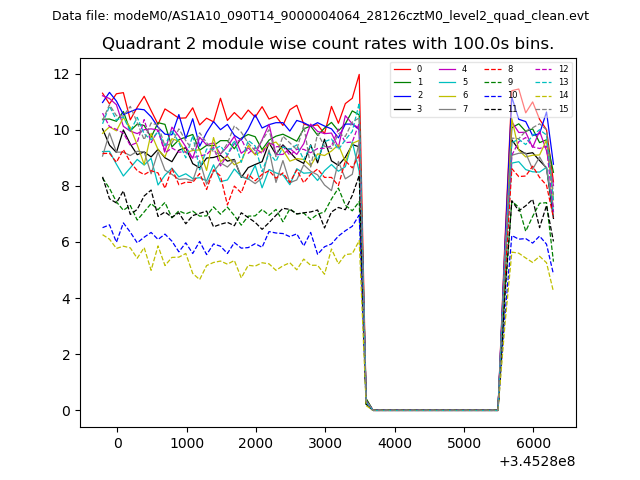
| Module-wise count rates for Quadrant B Data is divided into 100 sec bins |
 |
 |
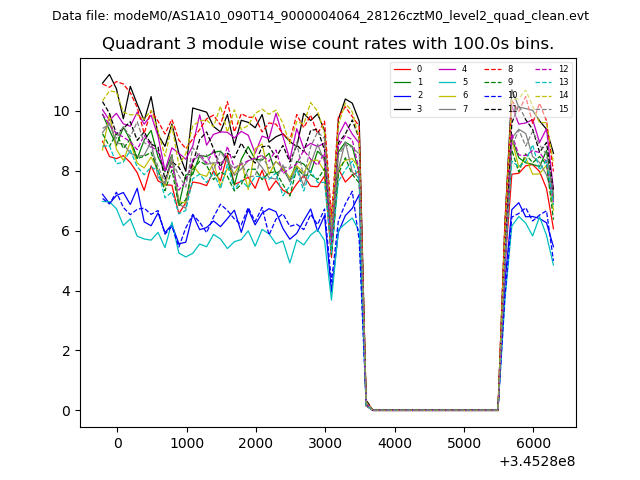
| Module-wise count rates for Quadrant C Data is divided into 100 sec bins |
 |
 |
| Module-wise count rates for Quadrant D Data is divided into 100 sec bins |
 |
 |
| Parameter | Plot |
|---|---|
| CZT HV Monitor | 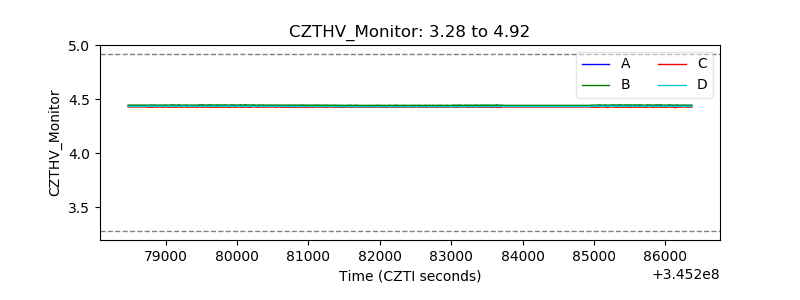 |
| D_VDD | 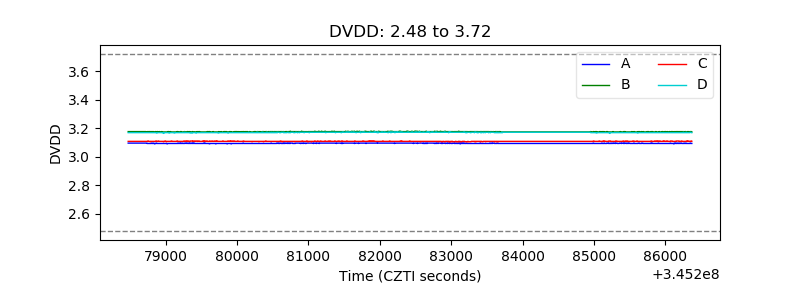 |
| Temperature 1 | 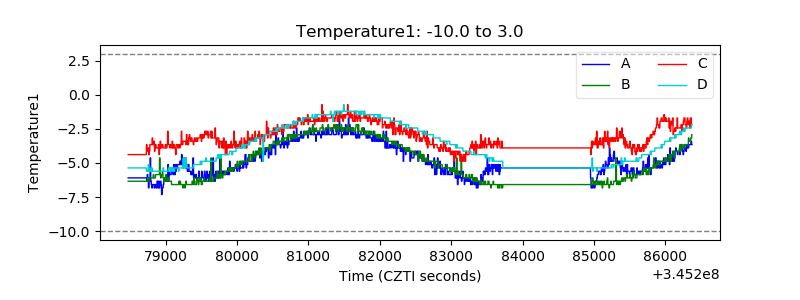 |
| Veto HV Monitor | 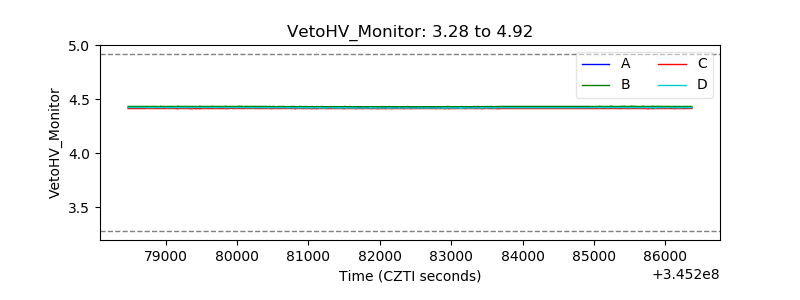 |
| Veto LLD | 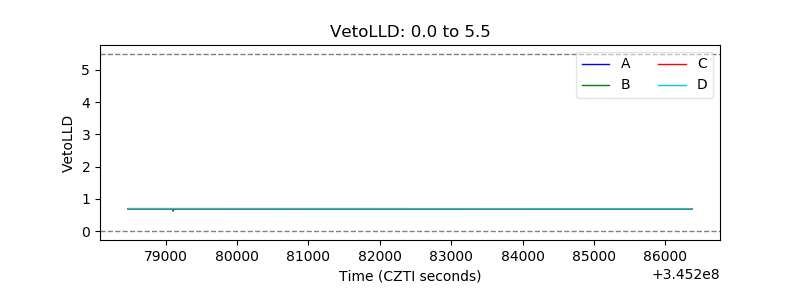 |
| Alpha Counter | 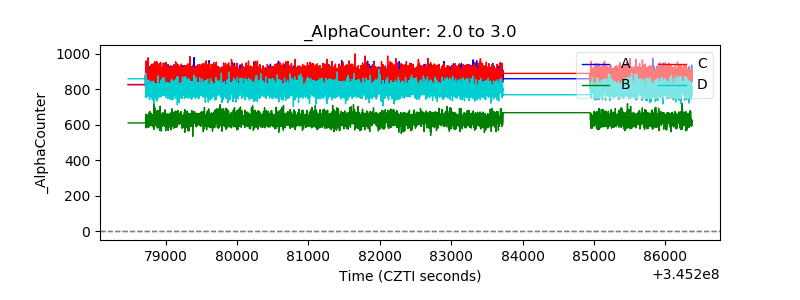 |
| _CPM_Rate | 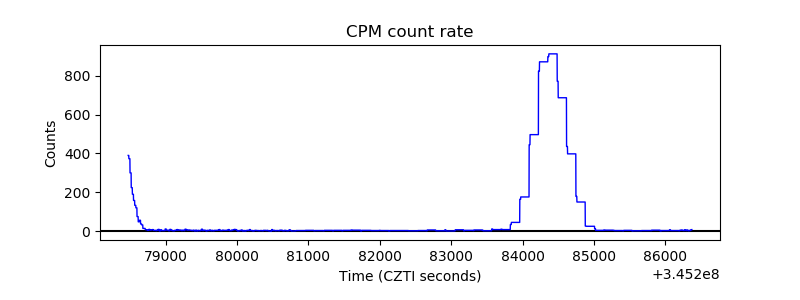 |
| CZT Counter | 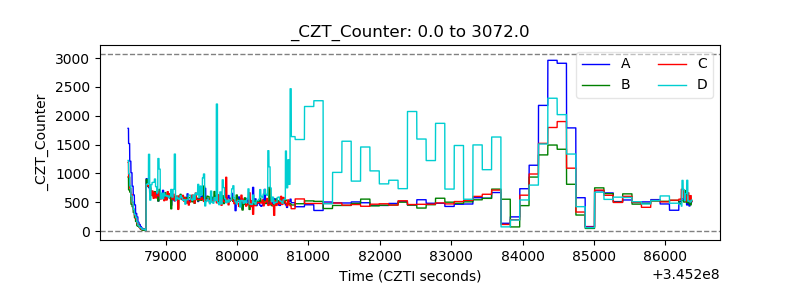 |
| +2.5 Volts monitor |  |
| +5 Volts monitor |  |
| _ROLL_ROT | 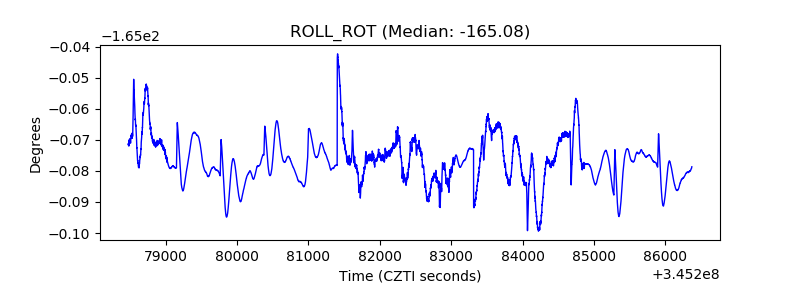 |
| _Roll_DEC | 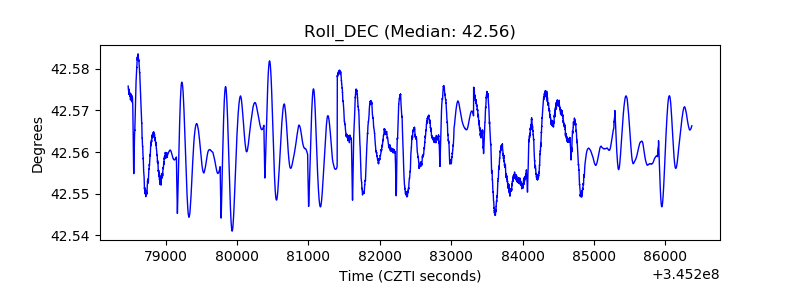 |
| _Roll_RA |  |
| Veto Counter | 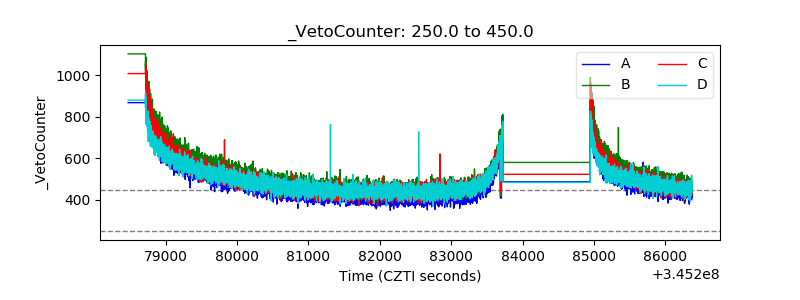 |