| Param | Original file | Final file |
|---|---|---|
| Filename | modeM0/AS1A10_090T14_9000004064_28127cztM0_level2.evt | modeM0/AS1A10_090T14_9000004064_28127cztM0_level2_quad_clean.evt |
| Size (bytes) | 529,954,560 | 103,173,120 |
| Size | 505.4 MB | 98.4 MB |
| Events in quadrant A | 3,339,631 | 691,677 |
| Events in quadrant B | 3,420,095 | 693,938 |
| Events in quadrant C | 3,473,793 | 649,815 |
| Events in quadrant D | 5,361,967 | 622,271 |
| Mode M9 | |||
|---|---|---|---|
| Quadrant | BADHDUFLAG | Total packets | Discarded packets |
| A | 0 | 14 | 0 |
| B | 0 | 15 | 0 |
| C | 0 | 15 | 0 |
| D | 0 | 15 | 0 |
| Mode M0 | |||
|---|---|---|---|
| Quadrant | BADHDUFLAG | Total packets | Discarded packets |
| A | 0 | 13913 | 0 |
| B | 0 | 14157 | 0 |
| C | 0 | 14384 | 0 |
| D | 0 | 20355 | 0 |
| Quadrant | Total seconds | Saturated seconds | Saturation percentage |
|---|---|---|---|
| A | 6696 | 109 | 1.627838% |
| B | 6695 | 140 | 2.091113% |
| C | 6695 | 135 | 2.016430% |
| D | 6695 | 427 | 6.377894% |
Noise dominated data is calculated using 1-second bins in cleaned event files. If a bin has >2000 counts, and if more than 50% of those come from <1% of pixels, then it is considered to be noise-dominated and hence unusable.
| Quadrant | # 1 sec bins | Bins with >0 counts | Bins with >2000 counts | High rate bins dominated by noise | Noise dominated (total time) | Noise dominated (detector-on time) | Marked lightcurve |
|---|---|---|---|---|---|---|---|
| A | 7671 | 6696 | 1 | 1 | 0.01% | 0.01% | 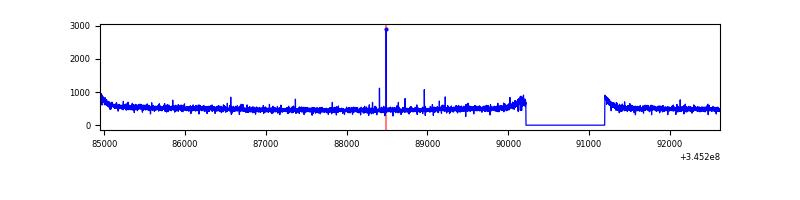 |
| B | 7670 | 6696 | 3 | 3 | 0.04% | 0.04% | 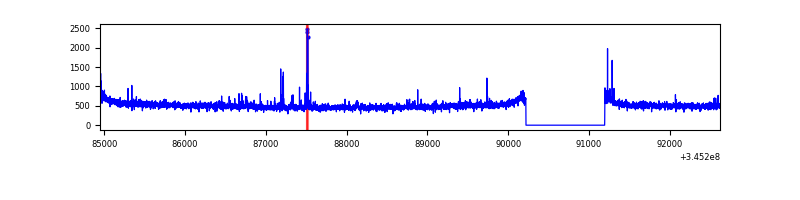 |
| C | 7670 | 6696 | 4 | 4 | 0.05% | 0.06% | 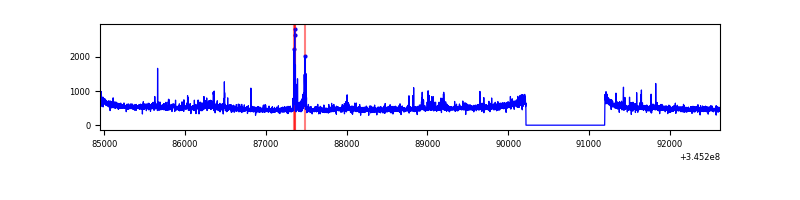 |
| D | 7670 | 6696 | 311 | 311 | 4.05% | 4.64% | 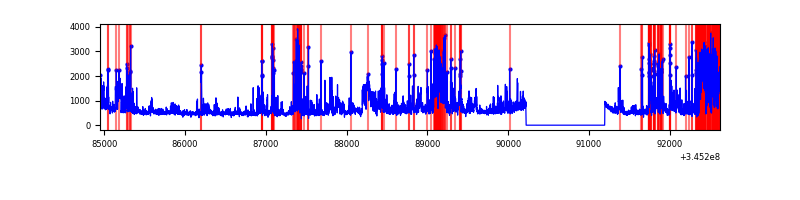 |
Top three noisy pixels from each quadrant. If the there are fewer than three noisy pixels in the level2.evt file, extra rows are filled as -1
| Pixel properties | Quadrant properties | ||||||
|---|---|---|---|---|---|---|---|
| Quadrant | DetID | PixID | Counts | Sigma | Mean | Median | Sigma |
| A | 1 | 113 | 9957 | 52.82 | 863 | 849 | 172.4 |
| A | 13 | 254 | 9915 | 52.57 | 863 | 849 | 172.4 |
| A | 3 | 137 | 8116 | 42.14 | 863 | 849 | 172.4 |
| B | 10 | 246 | 50693 | 311.97 | 849 | 830 | 159.8 |
| B | 12 | 111 | 19727 | 118.23 | 849 | 830 | 159.8 |
| B | 11 | 111 | 17946 | 107.09 | 849 | 830 | 159.8 |
| C | 14 | 238 | 134088 | 713.04 | 811 | 815 | 186.9 |
| C | 3 | 233 | 125497 | 667.08 | 811 | 815 | 186.9 |
| C | 15 | 208 | 49661 | 261.34 | 811 | 815 | 186.9 |
| D | 1 | 52 | 1718794 | 8967.85 | 812 | 790 | 191.6 |
| D | 2 | 250 | 246510 | 1282.64 | 812 | 790 | 191.6 |
| D | 5 | 222 | 112351 | 582.34 | 812 | 790 | 191.6 |
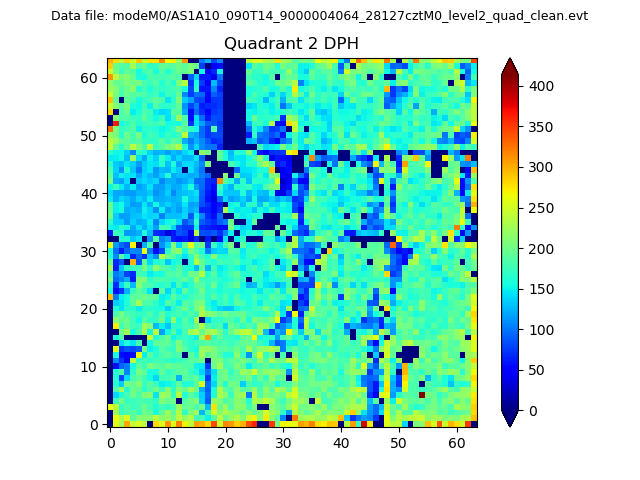
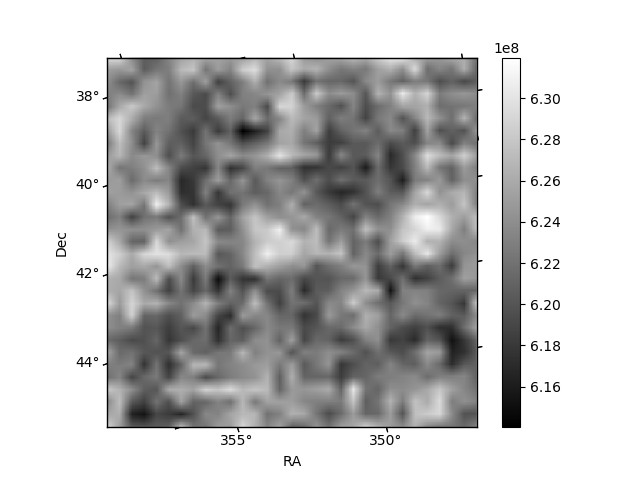
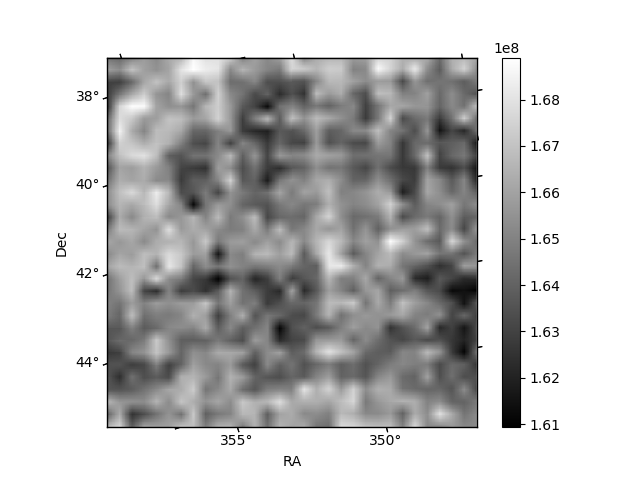
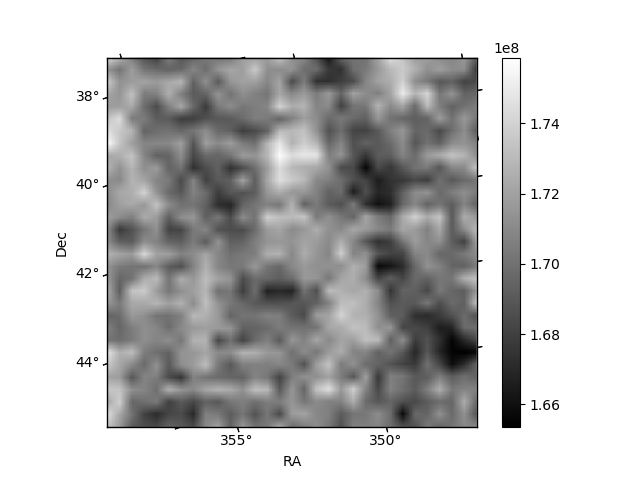
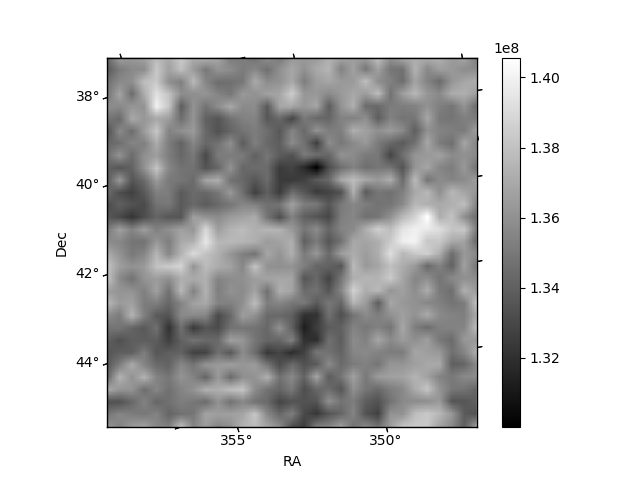
Histogram calculated using DETX and DETY for each event in the final _common_clean file
| Quadrant A | 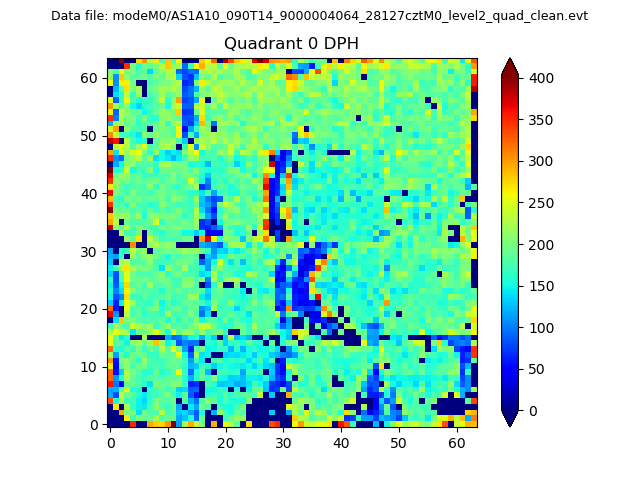 |
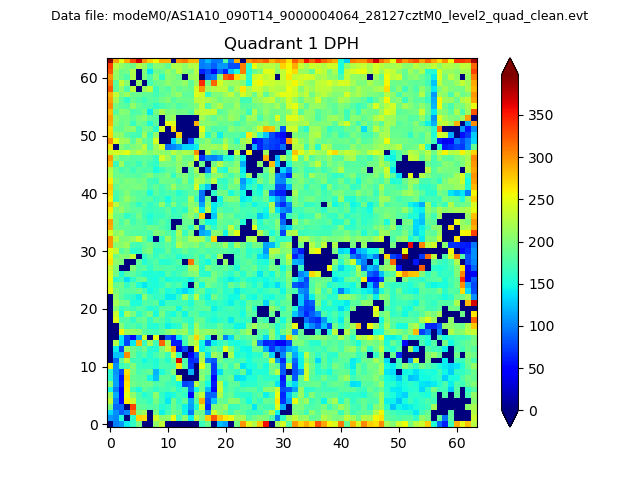 |
Quadrant B |
|---|---|---|---|
| Quadrant D | 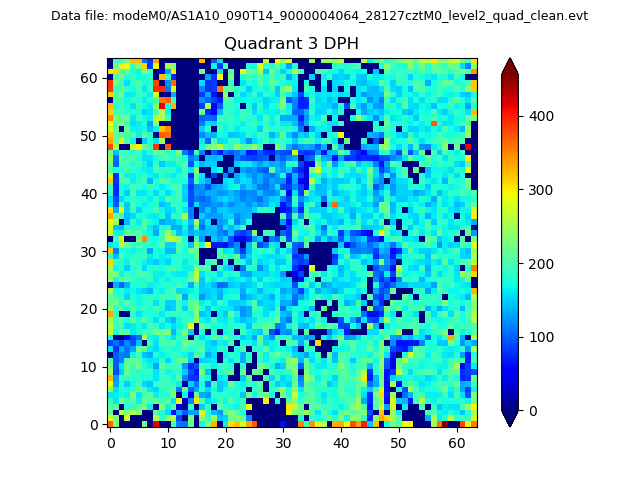 |
 |
Quadrant C |
| Plot type | Count rate plots | Images |
|---|---|---|
| Comparison with Poisson distribution Blue bars denote a histogram of data divided into 1 sec bins. Red curve is a Poisson curve with rate = median count rate of data. |
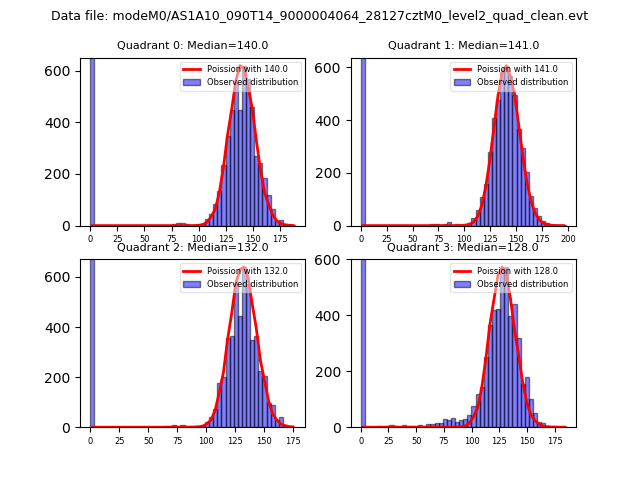 |
 |
| Quadrant-wise count rates Data is divided into 100 sec bins |
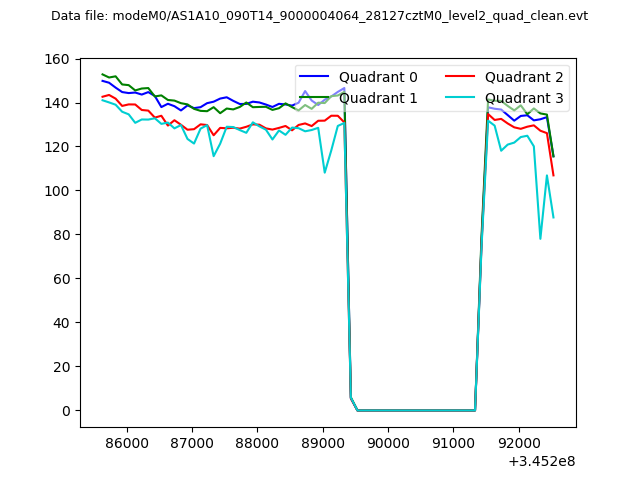 |
|
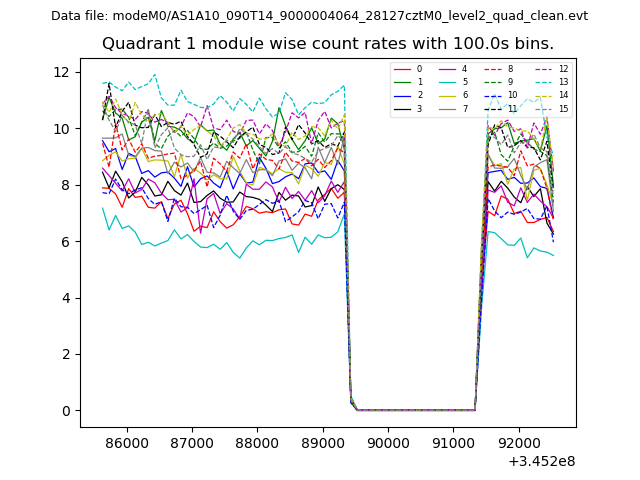
| Module-wise count rates for Quadrant A Data is divided into 100 sec bins |
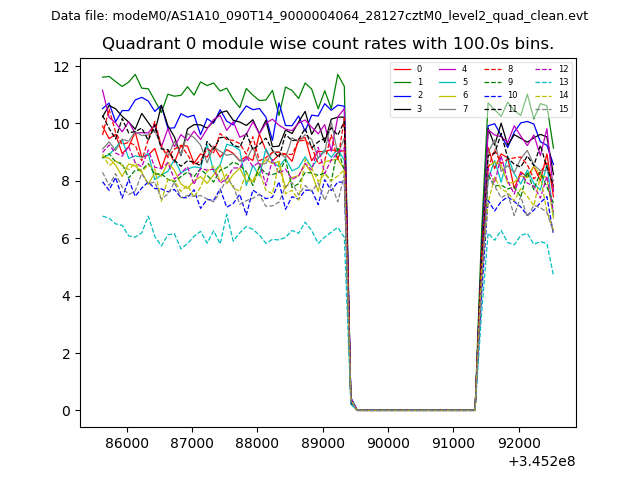 |
 |
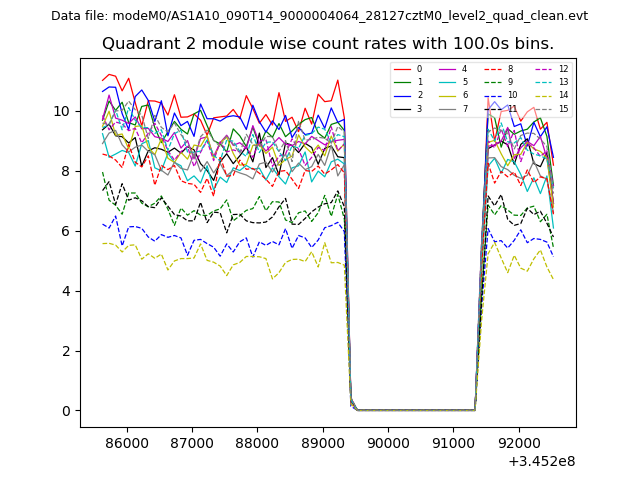
| Module-wise count rates for Quadrant B Data is divided into 100 sec bins |
 |
 |
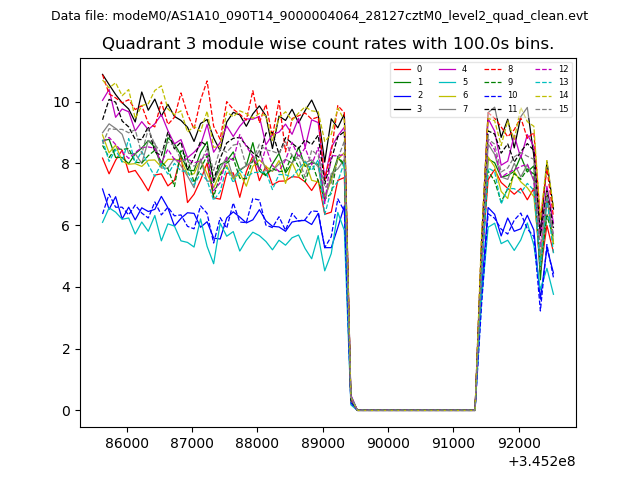
| Module-wise count rates for Quadrant C Data is divided into 100 sec bins |
 |
 |
| Module-wise count rates for Quadrant D Data is divided into 100 sec bins |
 |
 |
| Parameter | Plot |
|---|---|
| CZT HV Monitor | 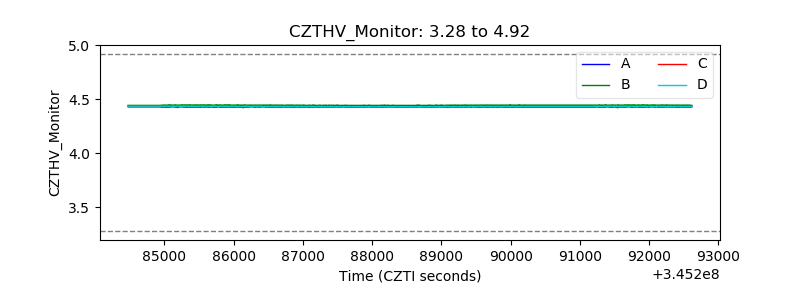 |
| D_VDD | 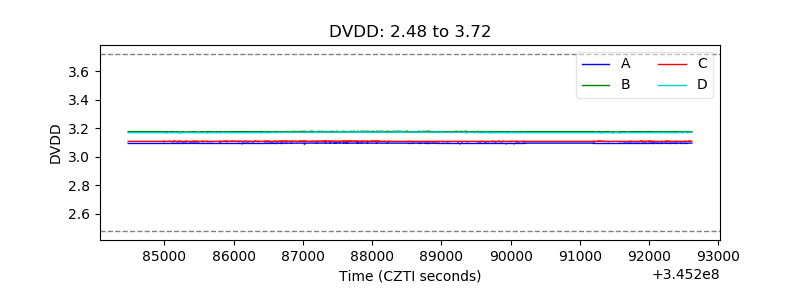 |
| Temperature 1 | 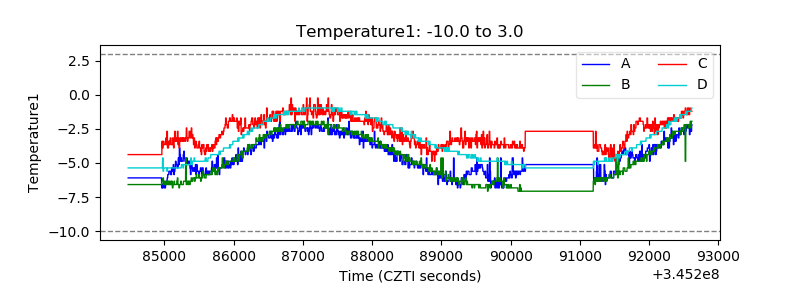 |
| Veto HV Monitor | 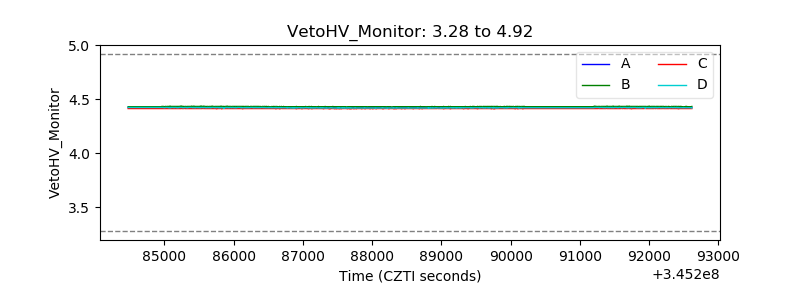 |
| Veto LLD | 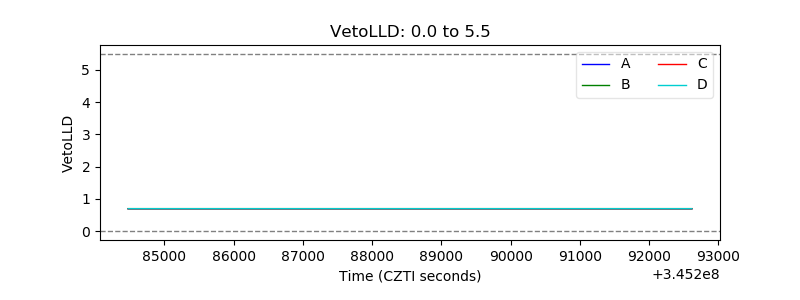 |
| Alpha Counter | 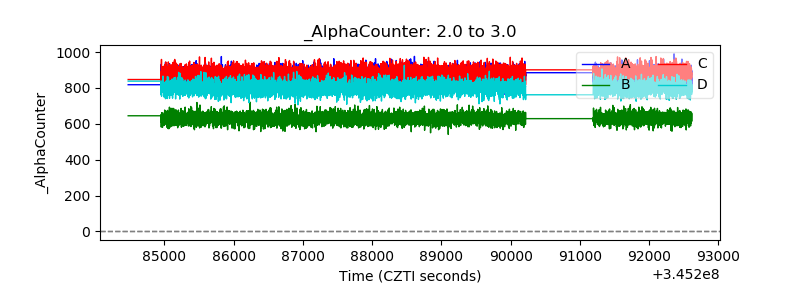 |
| _CPM_Rate | 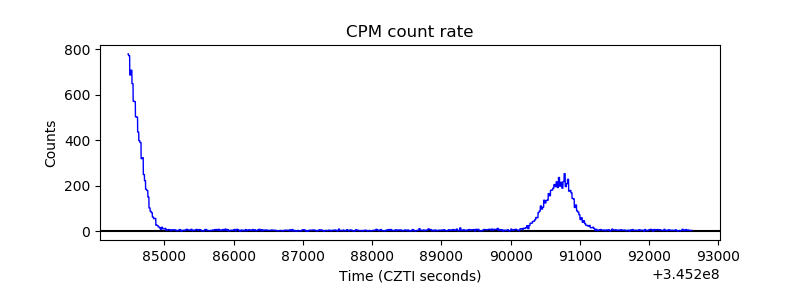 |
| CZT Counter | 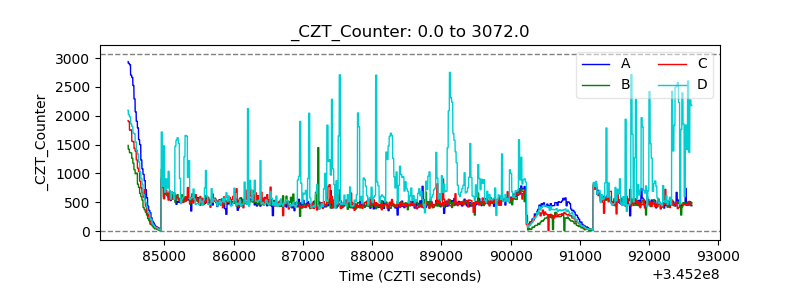 |
| +2.5 Volts monitor |  |
| +5 Volts monitor | 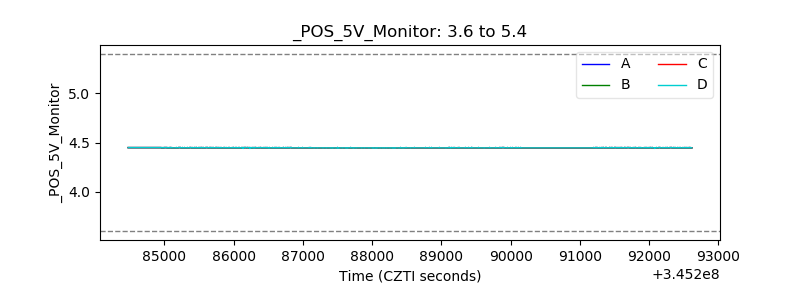 |
| _ROLL_ROT |  |
| _Roll_DEC | 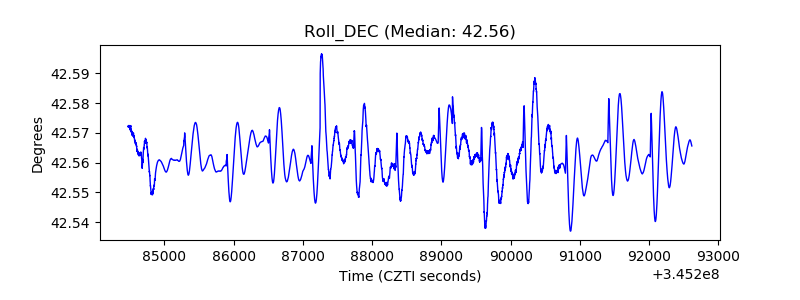 |
| _Roll_RA | 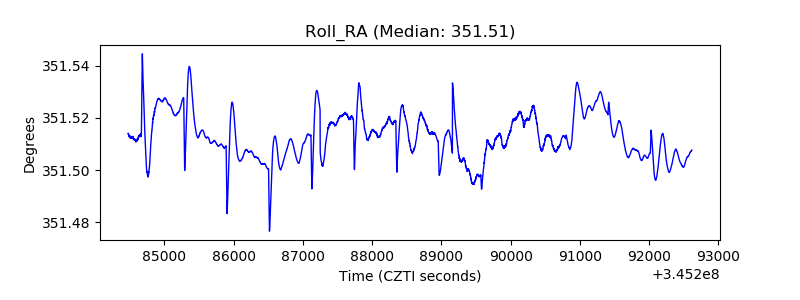 |
| Veto Counter | 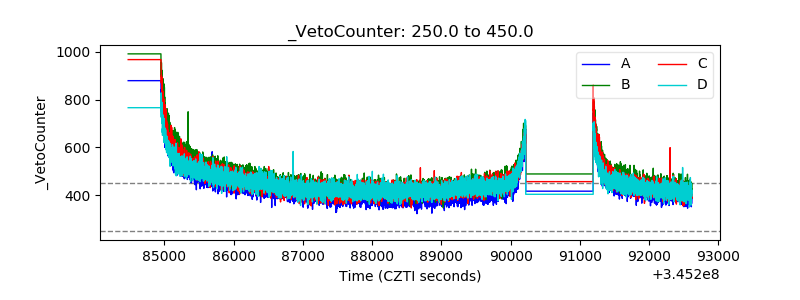 |