| Param | Original file | Final file |
|---|---|---|
| Filename | modeM0/AS1A10_090T14_9000004064_28128cztM0_level2.evt | modeM0/AS1A10_090T14_9000004064_28128cztM0_level2_quad_clean.evt |
| Size (bytes) | 259,035,840 | 52,015,680 |
| Size | 247.0 MB | 49.6 MB |
| Events in quadrant A | 1,287,081 | 366,520 |
| Events in quadrant B | 1,479,691 | 366,780 |
| Events in quadrant C | 1,334,495 | 345,847 |
| Events in quadrant D | 3,552,270 | 296,006 |
| Mode M0 | |||
|---|---|---|---|
| Quadrant | BADHDUFLAG | Total packets | Discarded packets |
| A | 0 | 5619 | 0 |
| B | 0 | 6146 | 0 |
| C | 0 | 5770 | 0 |
| D | 0 | 12446 | 0 |
| Quadrant | Total seconds | Saturated seconds | Saturation percentage |
|---|---|---|---|
| A | 2792 | 1 | 0.035817% |
| B | 2792 | 4 | 0.143266% |
| C | 2792 | 14 | 0.501433% |
| D | 2792 | 664 | 23.782235% |
Noise dominated data is calculated using 1-second bins in cleaned event files. If a bin has >2000 counts, and if more than 50% of those come from <1% of pixels, then it is considered to be noise-dominated and hence unusable.
| Quadrant | # 1 sec bins | Bins with >0 counts | Bins with >2000 counts | High rate bins dominated by noise | Noise dominated (total time) | Noise dominated (detector-on time) | Marked lightcurve |
|---|---|---|---|---|---|---|---|
| A | 2792 | 2792 | 0 | 0 | 0.00% | 0.00% |  |
| B | 2792 | 2792 | 2 | 2 | 0.07% | 0.07% |  |
| C | 2792 | 2792 | 2 | 2 | 0.07% | 0.07% |  |
| D | 2792 | 2792 | 609 | 609 | 21.81% | 21.81% | 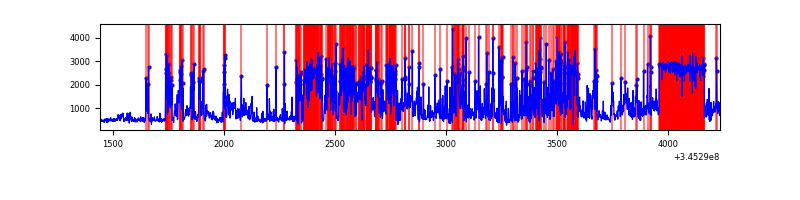 |
Top three noisy pixels from each quadrant. If the there are fewer than three noisy pixels in the level2.evt file, extra rows are filled as -1
| Pixel properties | Quadrant properties | ||||||
|---|---|---|---|---|---|---|---|
| Quadrant | DetID | PixID | Counts | Sigma | Mean | Median | Sigma |
| A | 15 | 174 | 7302 | 103.24 | 331 | 325 | 67.6 |
| A | 13 | 254 | 4105 | 55.93 | 331 | 325 | 67.6 |
| A | 3 | 137 | 3064 | 40.53 | 331 | 325 | 67.6 |
| B | 15 | 32 | 108823 | 1733.83 | 322 | 314 | 62.6 |
| B | 5 | 255 | 36610 | 579.96 | 322 | 314 | 62.6 |
| B | 10 | 246 | 34893 | 552.53 | 322 | 314 | 62.6 |
| C | 3 | 233 | 65833 | 903.88 | 308 | 309 | 72.5 |
| C | 14 | 238 | 51883 | 711.44 | 308 | 309 | 72.5 |
| C | 15 | 208 | 9733 | 129.99 | 308 | 309 | 72.5 |
| D | 1 | 52 | 1646882 | 24066.89 | 284 | 276 | 68.4 |
| D | 7 | 80 | 484347 | 7075.21 | 284 | 276 | 68.4 |
| D | 12 | 1 | 139059 | 2028.46 | 284 | 276 | 68.4 |
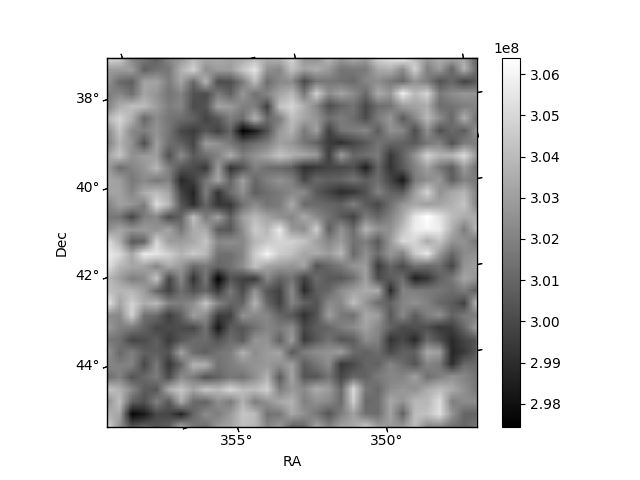
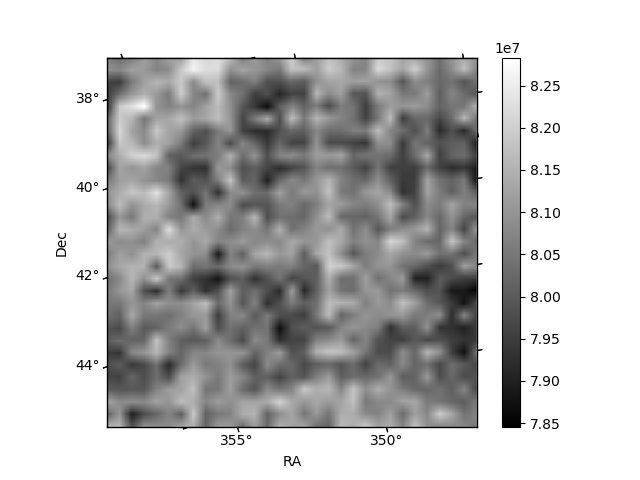
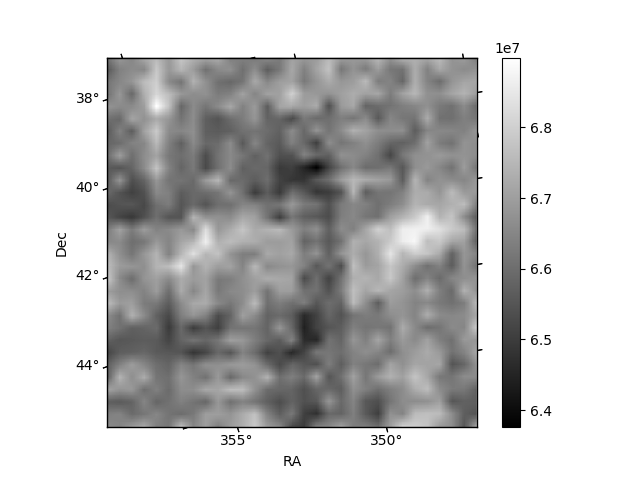
Histogram calculated using DETX and DETY for each event in the final _common_clean file
| Quadrant A |  |
 |
Quadrant B |
|---|---|---|---|
| Quadrant D |  |
 |
Quadrant C |
| Plot type | Count rate plots | Images |
|---|---|---|
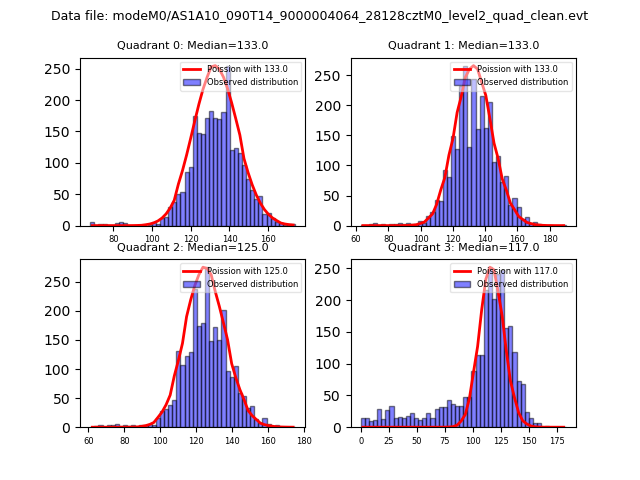
| Comparison with Poisson distribution Blue bars denote a histogram of data divided into 1 sec bins. Red curve is a Poisson curve with rate = median count rate of data. |
 |
 |
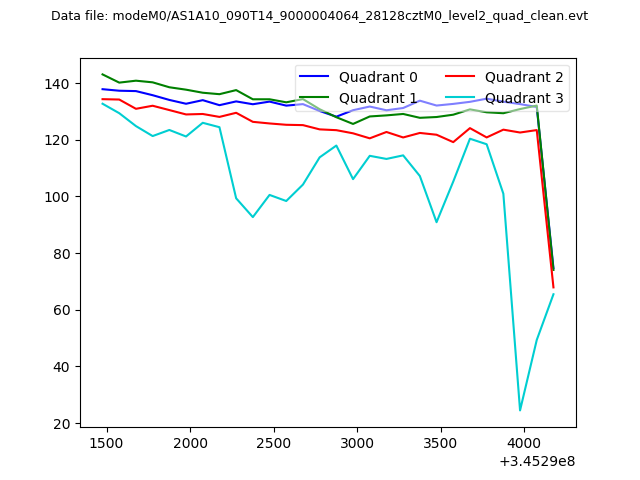
| Quadrant-wise count rates Data is divided into 100 sec bins |
 |
|
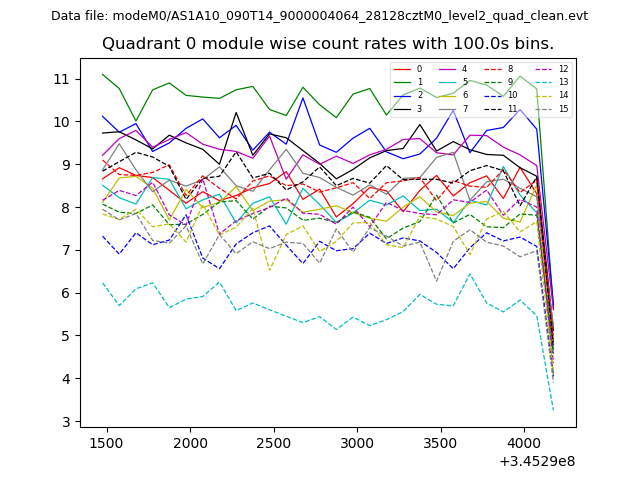
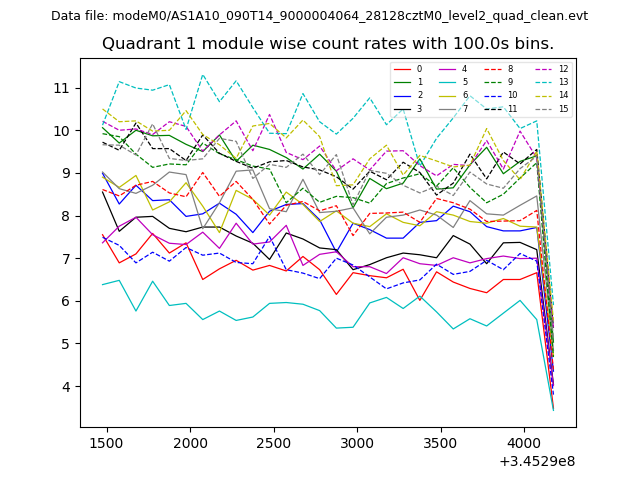
| Module-wise count rates for Quadrant A Data is divided into 100 sec bins |
 |
 |
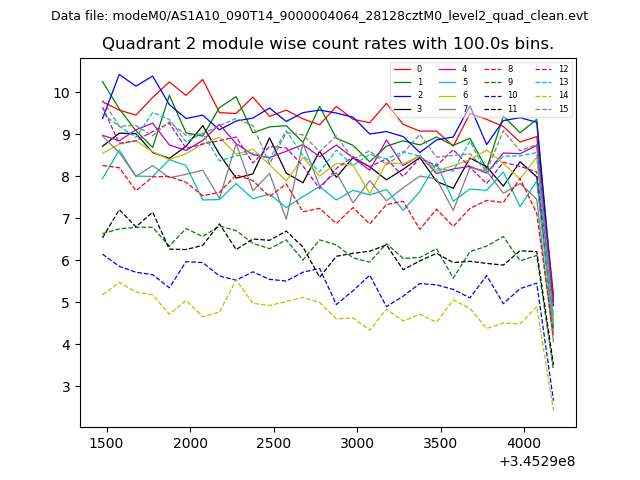
| Module-wise count rates for Quadrant B Data is divided into 100 sec bins |
 |
 |
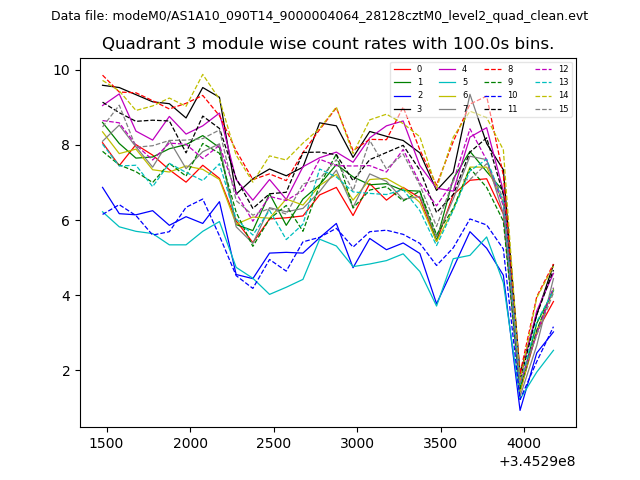
| Module-wise count rates for Quadrant C Data is divided into 100 sec bins |
 |
 |
| Module-wise count rates for Quadrant D Data is divided into 100 sec bins |
 |
 |
| Parameter | Plot |
|---|---|
| CZT HV Monitor | 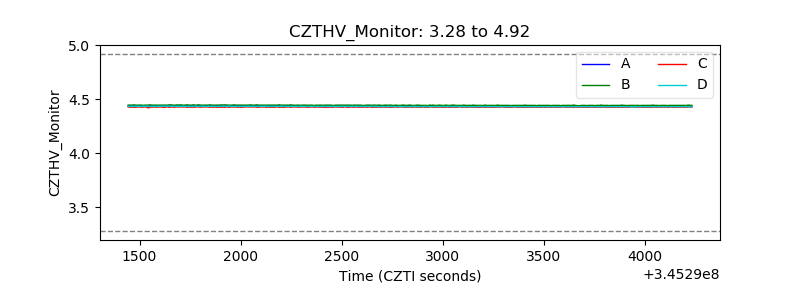 |
| D_VDD | 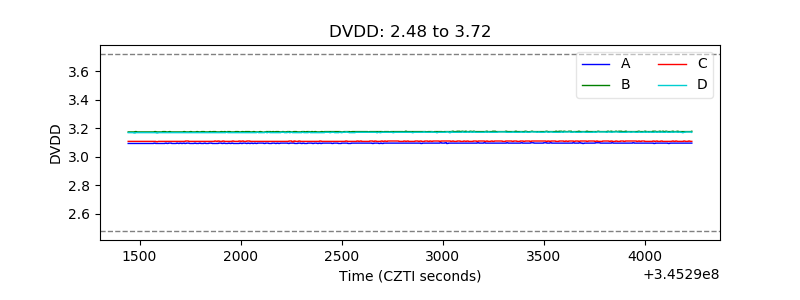 |
| Temperature 1 | 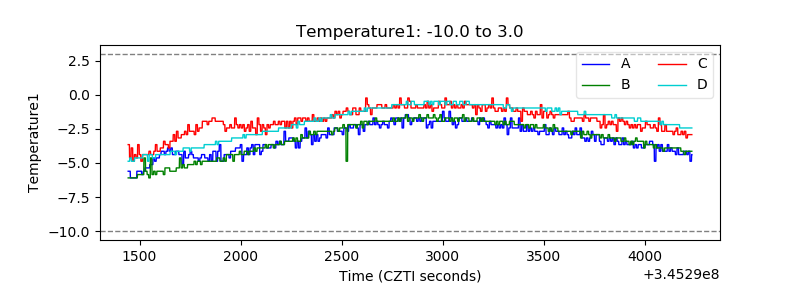 |
| Veto HV Monitor | 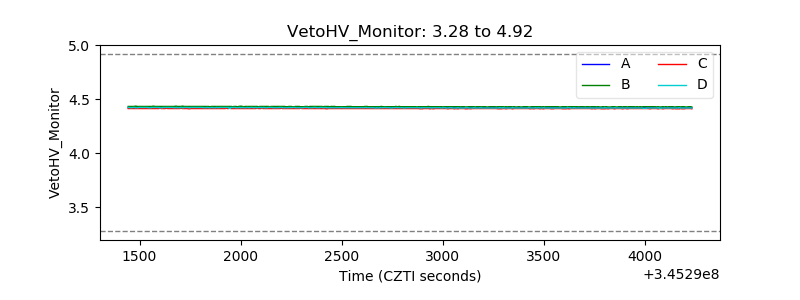 |
| Veto LLD | 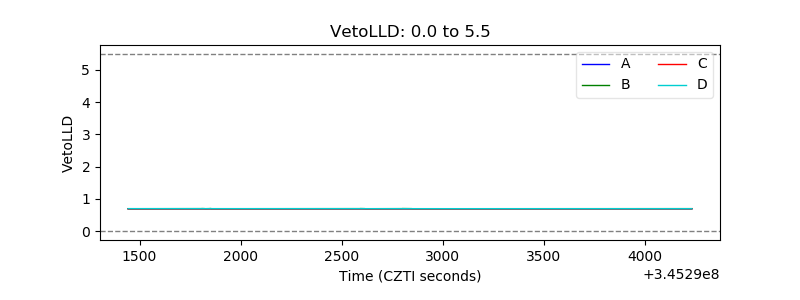 |
| Alpha Counter | 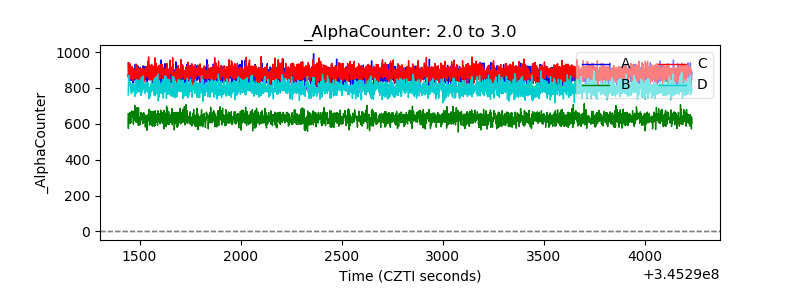 |
| _CPM_Rate | 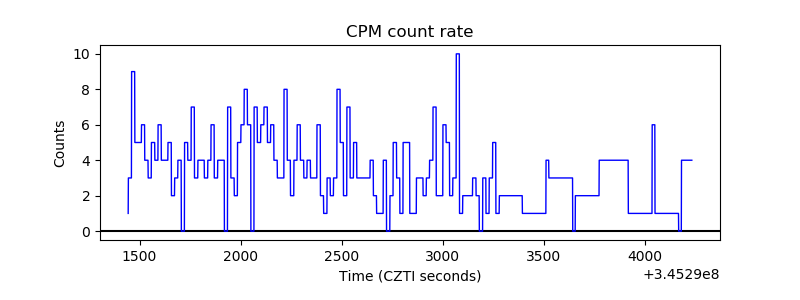 |
| CZT Counter | 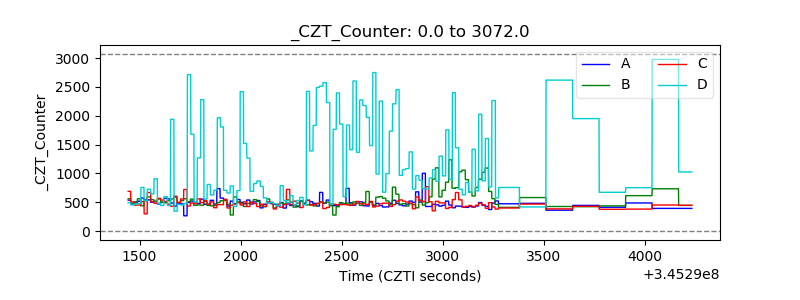 |
| +2.5 Volts monitor |  |
| +5 Volts monitor |  |
| _ROLL_ROT | 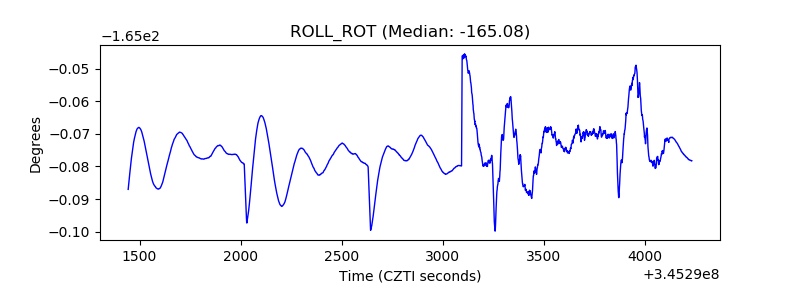 |
| _Roll_DEC | 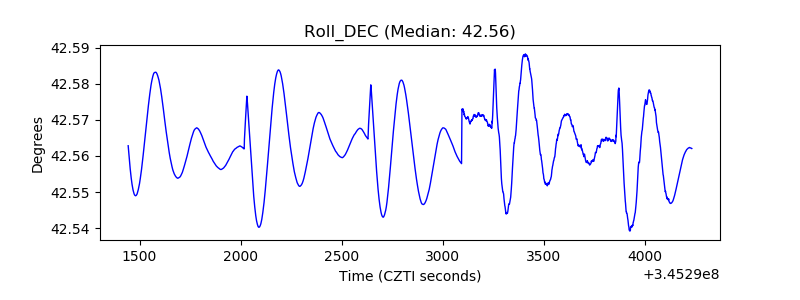 |
| _Roll_RA | 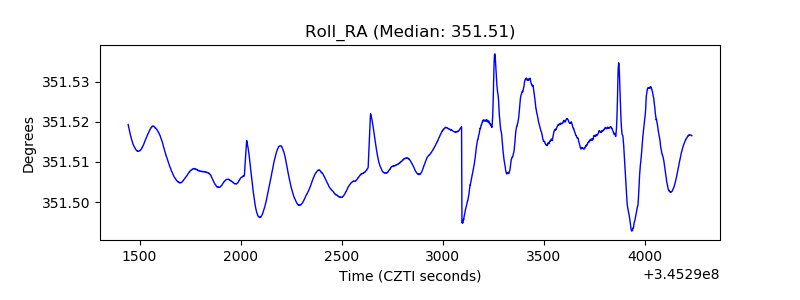 |
| Veto Counter | 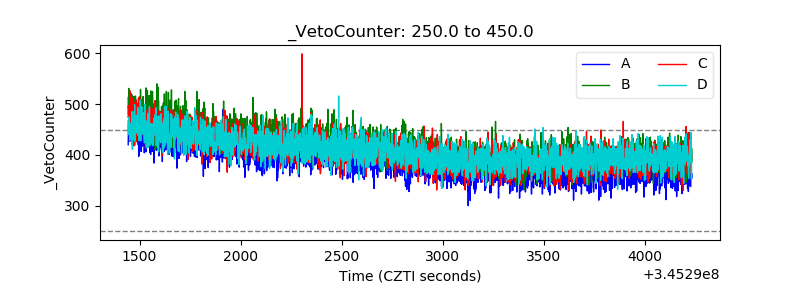 |