| Param | Original file | Final file |
|---|---|---|
| Filename | modeM0/AS1A10_045T04_9000004066cztM0_level2.fits | modeM0/AS1A10_045T04_9000004066cztM0_level2_quad_clean.evt |
| Size (bytes) | 1,491,312,960 | 1,162,716,480 |
| Size | 1.4 GB | 1.1 GB |
| Events in quadrant A | 9,346,104 | 6,632,214 |
| Events in quadrant B | 8,904,852 | 6,629,662 |
| Events in quadrant C | 9,070,398 | 6,295,349 |
| Events in quadrant D | 7,413,570 | 5,231,396 |
| Mode M0 | |||
|---|---|---|---|
| Quadrant | BADHDUFLAG | Total packets | Discarded packets |
| A | 0 | 316032 | 0 |
| B | 0 | 343403 | 0 |
| C | 0 | 324026 | 0 |
| D | 0 | 511288 | 0 |
| Mode M9 | |||
|---|---|---|---|
| Quadrant | BADHDUFLAG | Total packets | Discarded packets |
| A | 0 | 221 | 0 |
| B | 0 | 222 | 0 |
| C | 0 | 222 | 0 |
| D | 0 | 222 | 0 |
| Mode SS | |||
|---|---|---|---|
| Quadrant | BADHDUFLAG | Total packets | Discarded packets |
| A | 0 | 3094 | 0 |
| B | 0 | 3094 | 0 |
| C | 0 | 3094 | 0 |
| D | 0 | 3094 | 0 |
| Quadrant | Total seconds | Saturated seconds | Saturation percentage |
|---|---|---|---|
| A | 152123 | 1945 | 1.278571% |
| B | 152122 | 3887 | 2.555186% |
| C | 152122 | 3254 | 2.139073% |
| D | 152122 | 18250 | 11.996950% |
Noise dominated data is calculated using 1-second bins in cleaned event files. If a bin has >2000 counts, and if more than 50% of those come from <1% of pixels, then it is considered to be noise-dominated and hence unusable.
| Quadrant | # 1 sec bins | Bins with >0 counts | Bins with >2000 counts | High rate bins dominated by noise | Noise dominated (total time) | Noise dominated (detector-on time) | Marked lightcurve |
|---|---|---|---|---|---|---|---|
| A | 198856 | 152111 | 0 | 0 | 0.00% | 0.00% |  |
| B | 198856 | 152098 | 0 | 0 | 0.00% | 0.00% |  |
| C | 198856 | 152106 | 0 | 0 | 0.00% | 0.00% |  |
| D | 198856 | 151653 | 0 | 0 | 0.00% | 0.00% |  |
Top three noisy pixels from each quadrant. If the there are fewer than three noisy pixels in the level2.evt file, extra rows are filled as -1
| Pixel properties | Quadrant properties | ||||||
|---|---|---|---|---|---|---|---|
| Quadrant | DetID | PixID | Counts | Sigma | Mean | Median | Sigma |
| A | 0 | 29 | 7648 | 9.09 | 2433 | 2283 | 590.0 |
| A | 7 | 110 | 7554 | 8.93 | 2433 | 2283 | 590.0 |
| A | 9 | 19 | 6813 | 7.68 | 2433 | 2283 | 590.0 |
| B | 2 | 9 | 7261 | 10.96 | 2353 | 2240 | 458.3 |
| B | 2 | 8 | 5985 | 8.17 | 2353 | 2240 | 458.3 |
| B | 3 | 17 | 5945 | 8.08 | 2353 | 2240 | 458.3 |
| C | 12 | 241 | 6335 | 6.77 | 2395 | 2235 | 605.2 |
| C | 9 | 209 | 6189 | 6.53 | 2395 | 2235 | 605.2 |
| C | 3 | 187 | 6007 | 6.23 | 2395 | 2235 | 605.2 |
| D | 6 | 231 | 5138 | 5.77 | 2116 | 1927 | 556.2 |
| D | 15 | 47 | 5136 | 5.77 | 2116 | 1927 | 556.2 |
| D | 7 | 3 | 5130 | 5.76 | 2116 | 1927 | 556.2 |
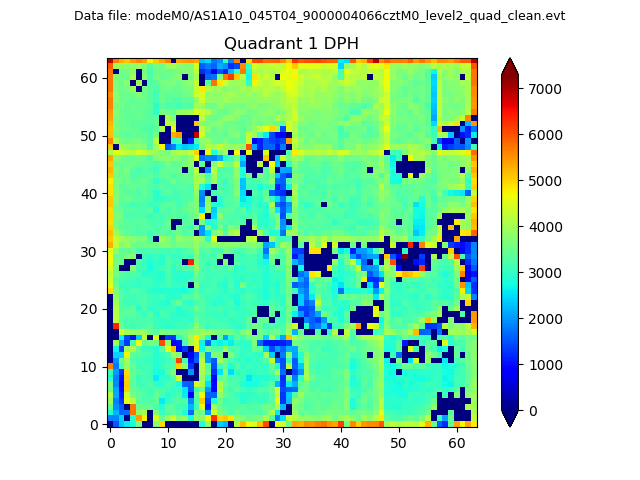
Histogram calculated using DETX and DETY for each event in the final _common_clean file
| Quadrant A |  |
 |
Quadrant B |
|---|---|---|---|
| Quadrant D |  |
 |
Quadrant C |
| Plot type | Count rate plots | Images |
|---|---|---|
| Comparison with Poisson distribution Blue bars denote a histogram of data divided into 1 sec bins. Red curve is a Poisson curve with rate = median count rate of data. |
 |
 |
| Quadrant-wise count rates Data is divided into 100 sec bins |
 |
|
| Module-wise count rates for Quadrant A Data is divided into 100 sec bins |
 |
 |
| Module-wise count rates for Quadrant B Data is divided into 100 sec bins |
 |
 |
| Module-wise count rates for Quadrant C Data is divided into 100 sec bins |
 |
 |
| Module-wise count rates for Quadrant D Data is divided into 100 sec bins |
 |
 |
| Parameter | Plot |
|---|---|
| CZT HV Monitor |  |
| D_VDD |  |
| Temperature 1 |  |
| Veto HV Monitor |  |
| Veto LLD |  |
| Alpha Counter |  |
| _CPM_Rate |  |
| CZT Counter |  |
| +2.5 Volts monitor |  |
| +5 Volts monitor |  |
| _ROLL_ROT |  |
| _Roll_DEC |  |
| _Roll_RA |  |
| Veto Counter |  |