| Param | Original file | Final file |
|---|---|---|
| Filename | modeM0/AS1A10_045T04_9000004066_28128cztM0_level2.evt | modeM0/AS1A10_045T04_9000004066_28128cztM0_level2_quad_clean.evt |
| Size (bytes) | 218,589,120 | 48,983,040 |
| Size | 208.5 MB | 46.7 MB |
| Events in quadrant A | 1,522,009 | 324,293 |
| Events in quadrant B | 1,579,258 | 329,224 |
| Events in quadrant C | 1,527,736 | 310,305 |
| Events in quadrant D | 1,786,529 | 306,819 |
| Mode M0 | |||
|---|---|---|---|
| Quadrant | BADHDUFLAG | Total packets | Discarded packets |
| A | 0 | 6332 | 0 |
| B | 0 | 6467 | 0 |
| C | 0 | 6346 | 0 |
| D | 0 | 7161 | 0 |
| Mode M9 | |||
|---|---|---|---|
| Quadrant | BADHDUFLAG | Total packets | Discarded packets |
| A | 0 | 5 | 0 |
| B | 0 | 5 | 0 |
| C | 0 | 5 | 0 |
| D | 0 | 5 | 0 |
| Quadrant | Total seconds | Saturated seconds | Saturation percentage |
|---|---|---|---|
| A | 2978 | 137 | 4.600403% |
| B | 2978 | 147 | 4.936199% |
| C | 2978 | 164 | 5.507052% |
| D | 2977 | 125 | 4.198858% |
Noise dominated data is calculated using 1-second bins in cleaned event files. If a bin has >2000 counts, and if more than 50% of those come from <1% of pixels, then it is considered to be noise-dominated and hence unusable.
| Quadrant | # 1 sec bins | Bins with >0 counts | Bins with >2000 counts | High rate bins dominated by noise | Noise dominated (total time) | Noise dominated (detector-on time) | Marked lightcurve |
|---|---|---|---|---|---|---|---|
| A | 3488 | 2978 | 0 | 0 | 0.00% | 0.00% | 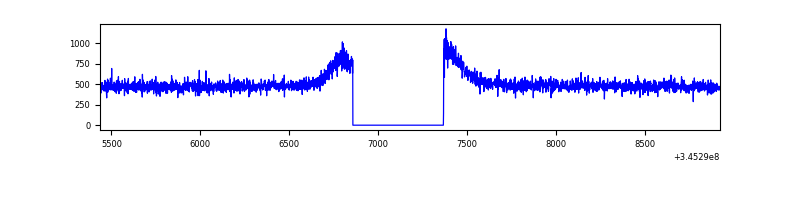 |
| B | 3488 | 2978 | 1 | 1 | 0.03% | 0.03% | 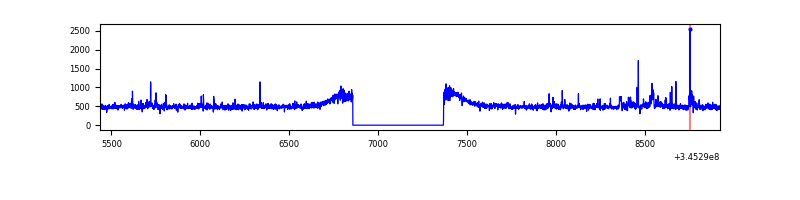 |
| C | 3488 | 2978 | 0 | 0 | 0.00% | 0.00% | 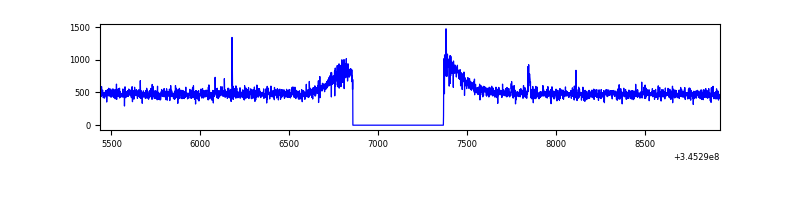 |
| D | 3487 | 2977 | 19 | 19 | 0.54% | 0.64% | 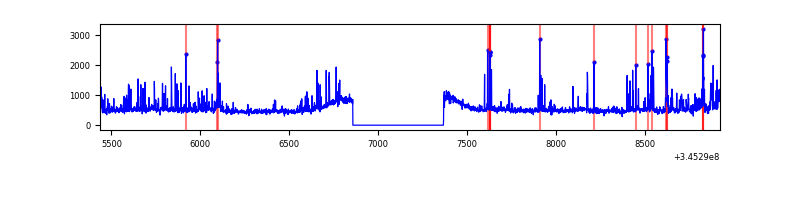 |
Top three noisy pixels from each quadrant. If the there are fewer than three noisy pixels in the level2.evt file, extra rows are filled as -1
| Pixel properties | Quadrant properties | ||||||
|---|---|---|---|---|---|---|---|
| Quadrant | DetID | PixID | Counts | Sigma | Mean | Median | Sigma |
| A | 13 | 254 | 4096 | 45.26 | 394 | 384 | 82.0 |
| A | 3 | 137 | 4045 | 44.63 | 394 | 384 | 82.0 |
| A | 0 | 226 | 3415 | 36.95 | 394 | 384 | 82.0 |
| B | 4 | 200 | 20367 | 258.41 | 388 | 378 | 77.4 |
| B | 5 | 255 | 12974 | 162.83 | 388 | 378 | 77.4 |
| B | 10 | 246 | 10903 | 136.06 | 388 | 378 | 77.4 |
| C | 14 | 238 | 57332 | 633.24 | 373 | 373 | 89.9 |
| C | 15 | 208 | 13103 | 141.53 | 373 | 373 | 89.9 |
| C | 3 | 233 | 4016 | 40.5 | 373 | 373 | 89.9 |
| D | 1 | 52 | 140344 | 1525.2 | 379 | 369 | 91.8 |
| D | 8 | 195 | 131290 | 1426.55 | 379 | 369 | 91.8 |
| D | 5 | 222 | 43178 | 466.46 | 379 | 369 | 91.8 |
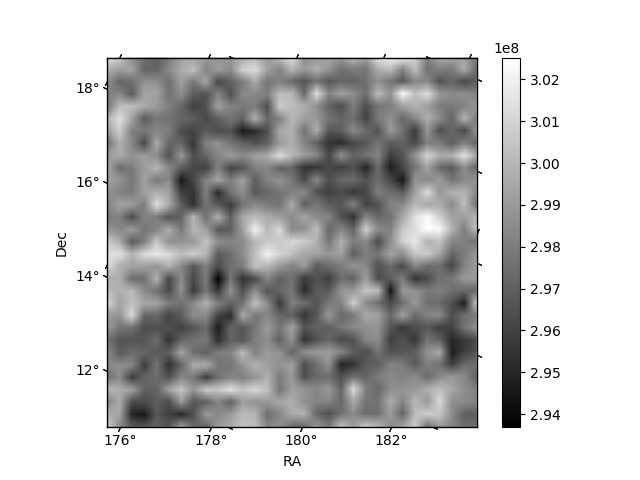
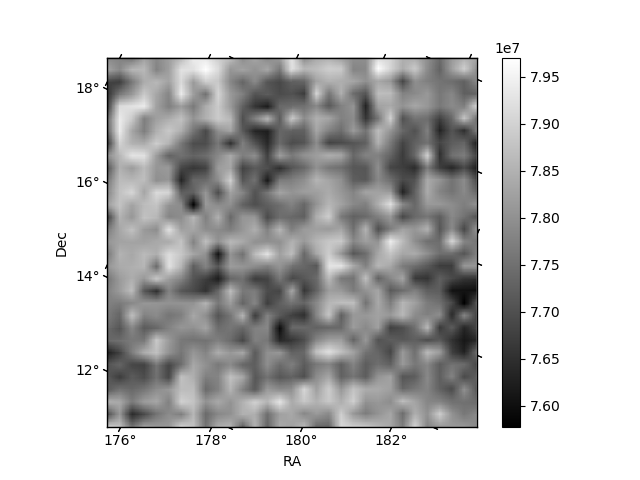
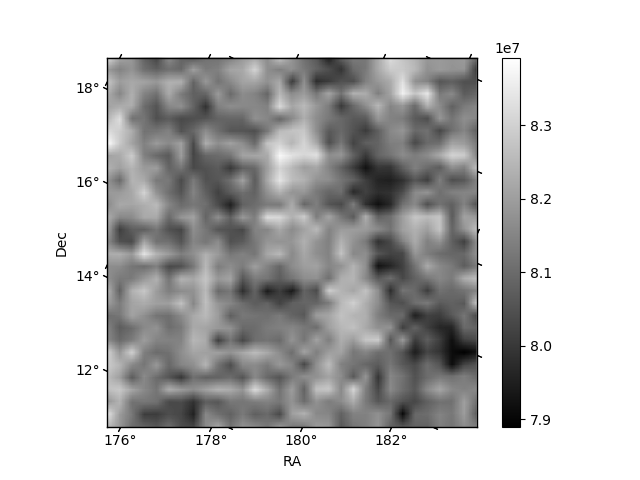
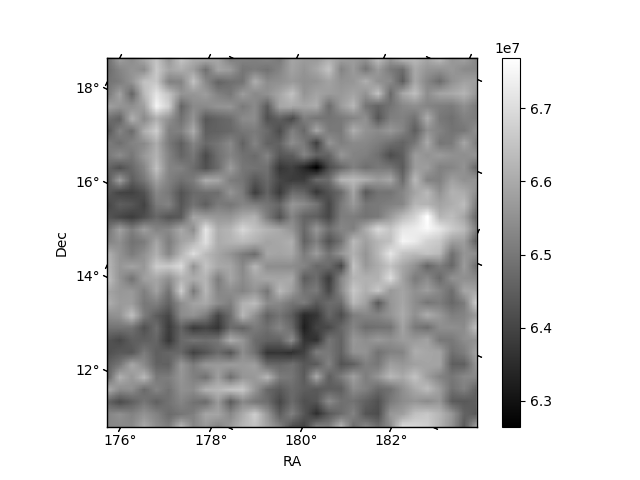
Histogram calculated using DETX and DETY for each event in the final _common_clean file
| Quadrant A | 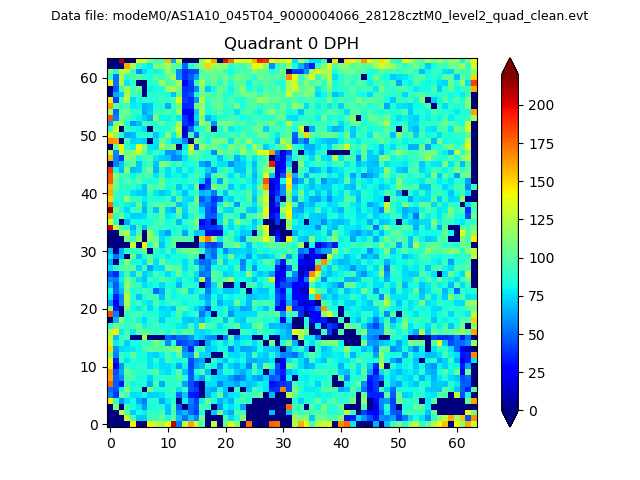 |
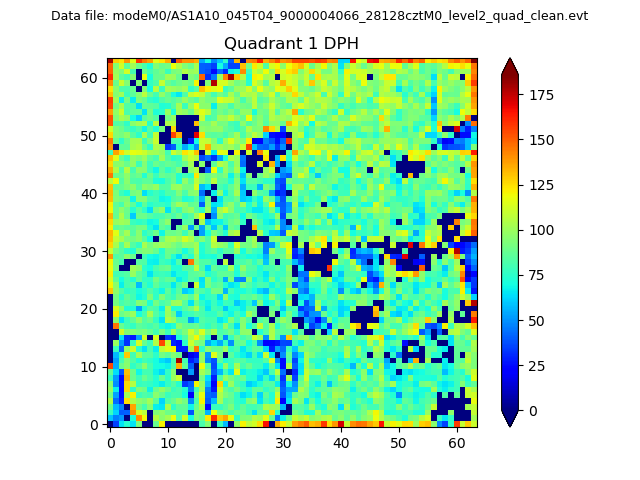 |
Quadrant B |
|---|---|---|---|
| Quadrant D | 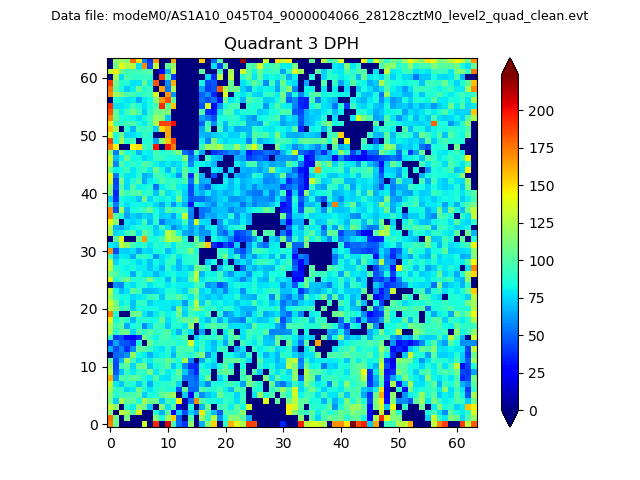 |
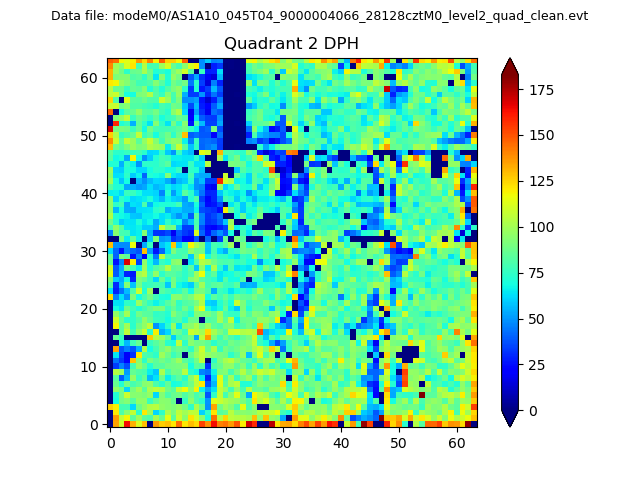 |
Quadrant C |
| Plot type | Count rate plots | Images |
|---|---|---|
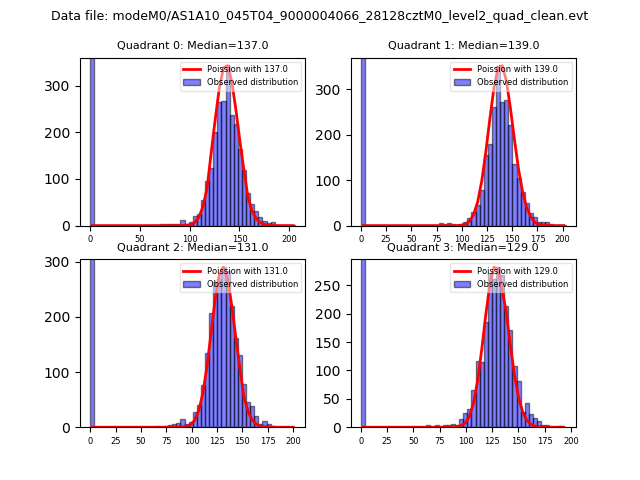
| Comparison with Poisson distribution Blue bars denote a histogram of data divided into 1 sec bins. Red curve is a Poisson curve with rate = median count rate of data. |
 |
 |
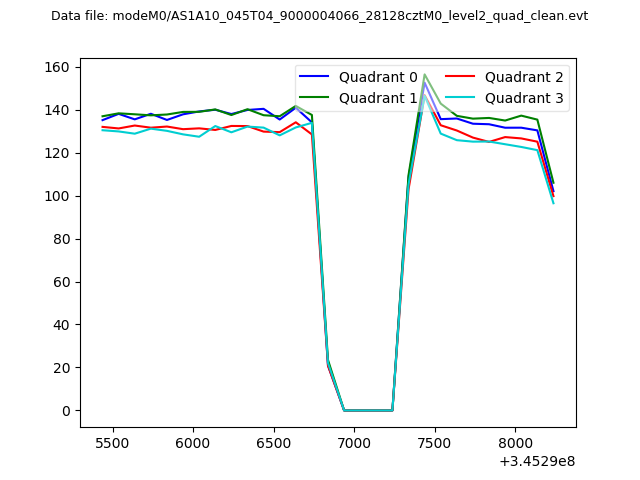
| Quadrant-wise count rates Data is divided into 100 sec bins |
 |
|
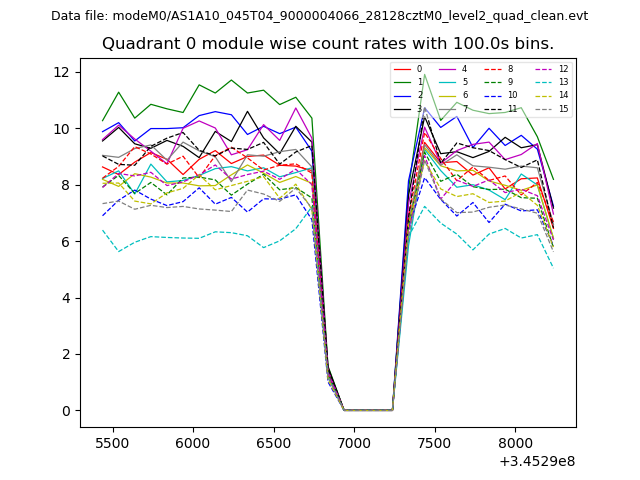
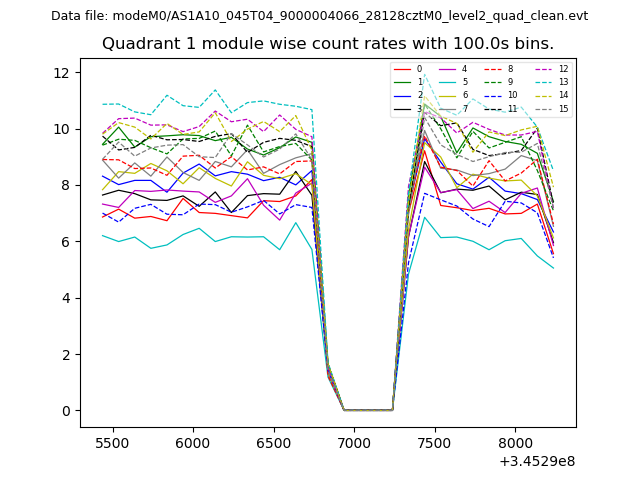
| Module-wise count rates for Quadrant A Data is divided into 100 sec bins |
 |
 |
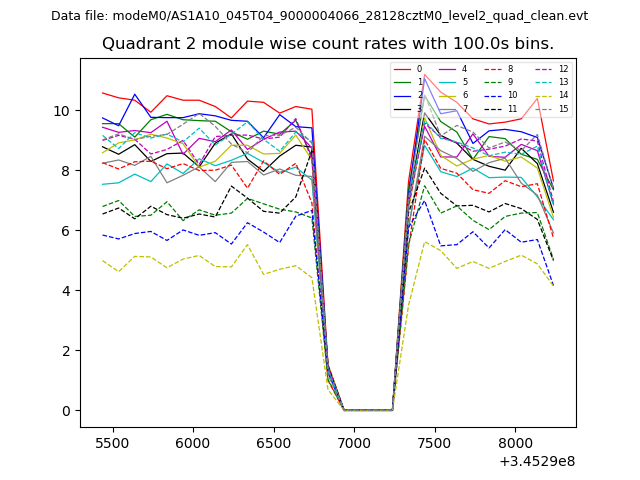
| Module-wise count rates for Quadrant B Data is divided into 100 sec bins |
 |
 |
| Module-wise count rates for Quadrant C Data is divided into 100 sec bins |
 |
 |
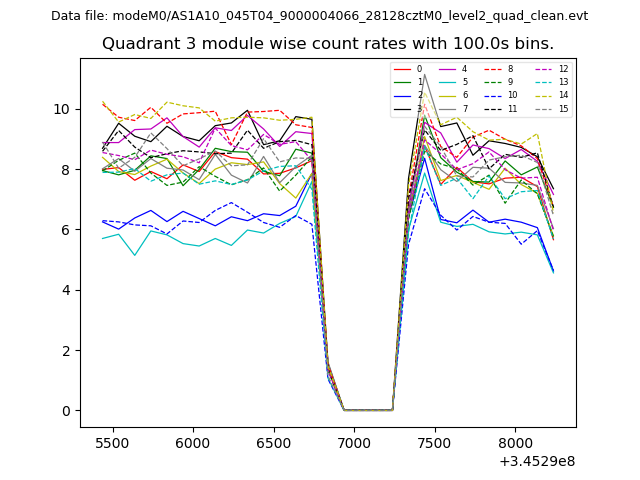
| Module-wise count rates for Quadrant D Data is divided into 100 sec bins |
 |
 |
| Parameter | Plot |
|---|---|
| CZT HV Monitor | 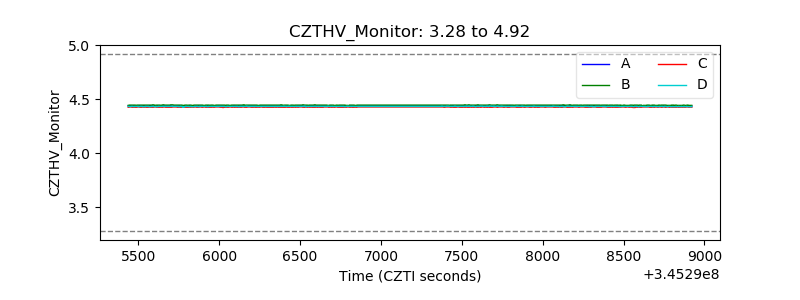 |
| D_VDD | 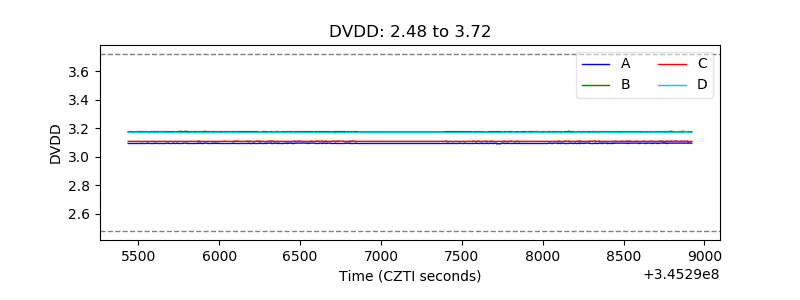 |
| Temperature 1 | 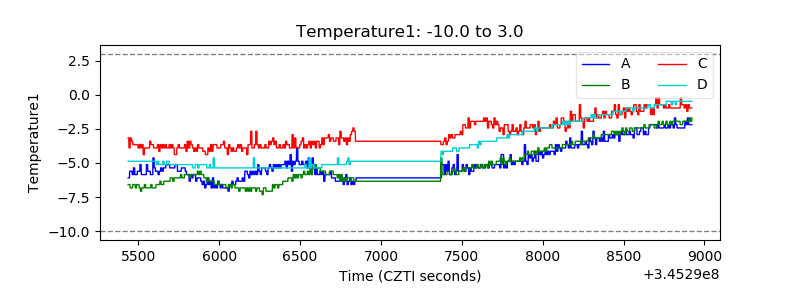 |
| Veto HV Monitor | 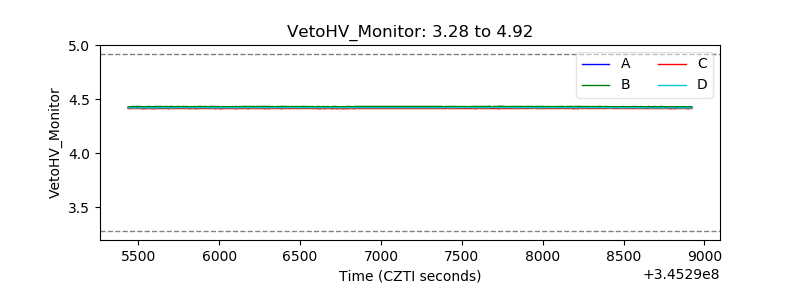 |
| Veto LLD | 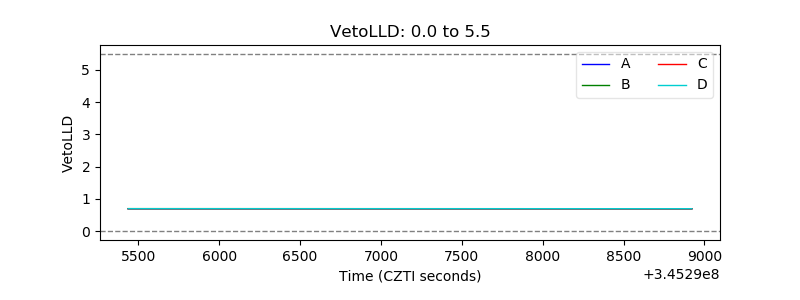 |
| Alpha Counter | 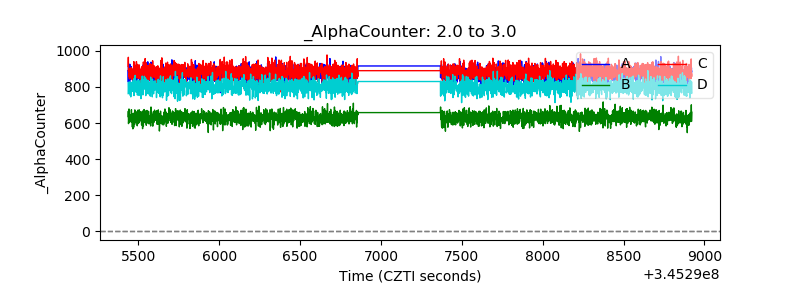 |
| _CPM_Rate | 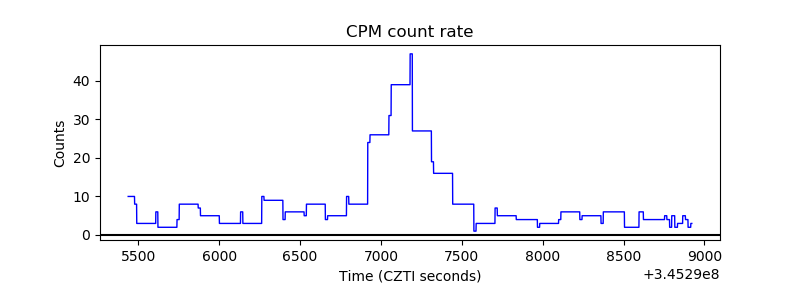 |
| CZT Counter | 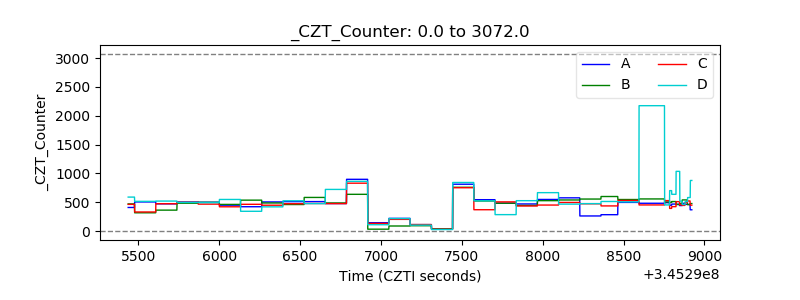 |
| +2.5 Volts monitor |  |
| +5 Volts monitor | 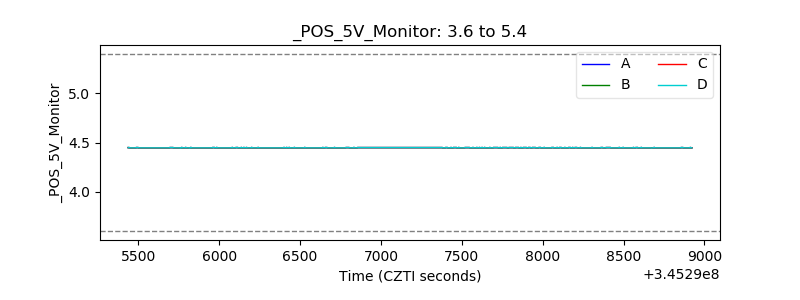 |
| _ROLL_ROT |  |
| _Roll_DEC |  |
| _Roll_RA | 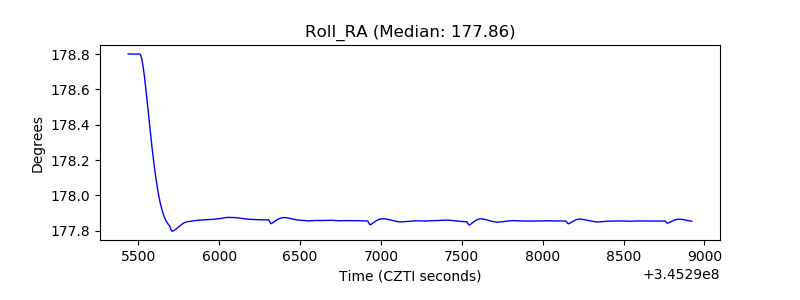 |
| Veto Counter | 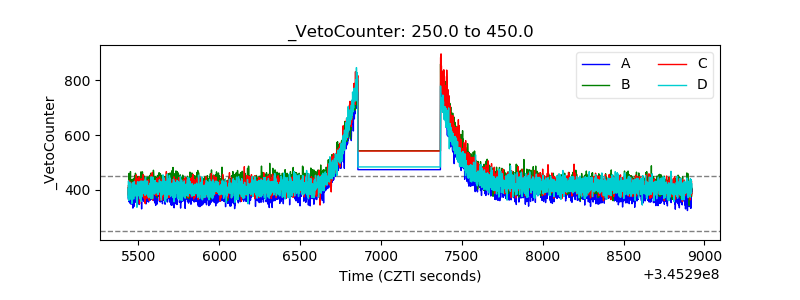 |