| Param | Original file | Final file |
|---|---|---|
| Filename | modeM0/AS1A10_045T04_9000004066_28129cztM0_level2.evt | modeM0/AS1A10_045T04_9000004066_28129cztM0_level2_quad_clean.evt |
| Size (bytes) | 642,098,880 | 87,989,760 |
| Size | 612.4 MB | 83.9 MB |
| Events in quadrant A | 3,661,423 | 548,978 |
| Events in quadrant B | 5,244,818 | 554,898 |
| Events in quadrant C | 3,675,180 | 528,701 |
| Events in quadrant D | 6,357,481 | 510,517 |
| Mode M0 | |||
|---|---|---|---|
| Quadrant | BADHDUFLAG | Total packets | Discarded packets |
| A | 0 | 15552 | 0 |
| B | 0 | 20429 | 0 |
| C | 0 | 15566 | 0 |
| D | 0 | 23905 | 0 |
| Mode M9 | |||
|---|---|---|---|
| Quadrant | BADHDUFLAG | Total packets | Discarded packets |
| A | 0 | 2 | 0 |
| B | 0 | 2 | 0 |
| C | 0 | 2 | 0 |
| D | 0 | 2 | 0 |
| Quadrant | Total seconds | Saturated seconds | Saturation percentage |
|---|---|---|---|
| A | 7493 | 174 | 2.322167% |
| B | 7494 | 405 | 5.404323% |
| C | 7494 | 223 | 2.975714% |
| D | 7494 | 753 | 10.048038% |
Noise dominated data is calculated using 1-second bins in cleaned event files. If a bin has >2000 counts, and if more than 50% of those come from <1% of pixels, then it is considered to be noise-dominated and hence unusable.
| Quadrant | # 1 sec bins | Bins with >0 counts | Bins with >2000 counts | High rate bins dominated by noise | Noise dominated (total time) | Noise dominated (detector-on time) | Marked lightcurve |
|---|---|---|---|---|---|---|---|
| A | 7678 | 7494 | 0 | 0 | 0.00% | 0.00% | 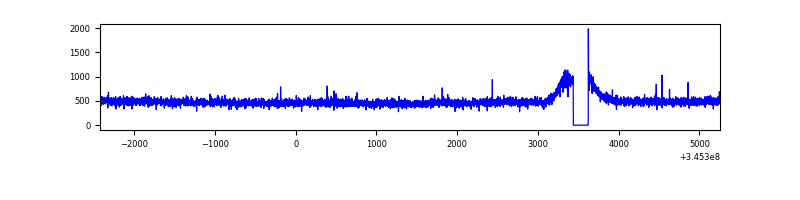 |
| B | 7679 | 7494 | 120 | 120 | 1.56% | 1.60% | 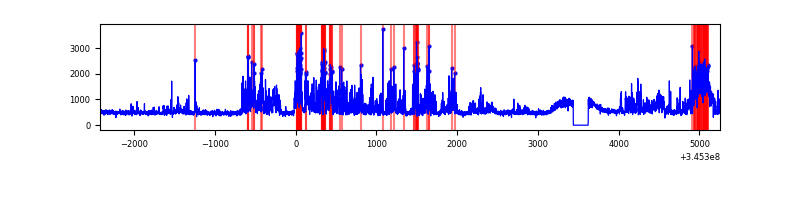 |
| C | 7679 | 7494 | 0 | 0 | 0.00% | 0.00% | 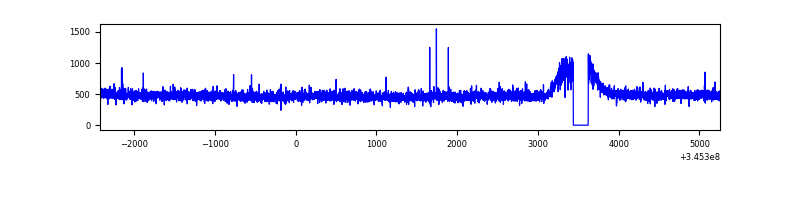 |
| D | 7679 | 7494 | 522 | 522 | 6.80% | 6.97% | 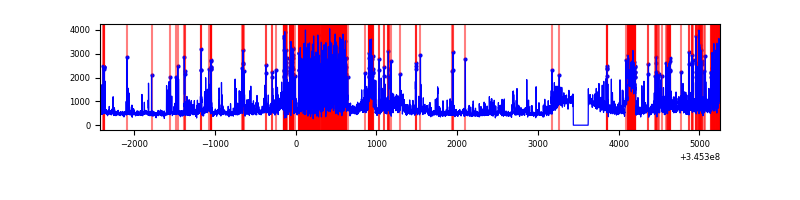 |
Top three noisy pixels from each quadrant. If the there are fewer than three noisy pixels in the level2.evt file, extra rows are filled as -1
| Pixel properties | Quadrant properties | ||||||
|---|---|---|---|---|---|---|---|
| Quadrant | DetID | PixID | Counts | Sigma | Mean | Median | Sigma |
| A | 13 | 254 | 11398 | 54.54 | 946 | 924 | 192.0 |
| A | 0 | 13 | 11353 | 54.31 | 946 | 924 | 192.0 |
| A | 3 | 137 | 9374 | 44.0 | 946 | 924 | 192.0 |
| B | 10 | 245 | 1248352 | 6921.56 | 926 | 900 | 180.2 |
| B | 15 | 32 | 274342 | 1517.21 | 926 | 900 | 180.2 |
| B | 4 | 200 | 48674 | 265.07 | 926 | 900 | 180.2 |
| C | 14 | 238 | 144051 | 670.22 | 899 | 903 | 213.6 |
| C | 15 | 208 | 16796 | 74.41 | 899 | 903 | 213.6 |
| C | 3 | 233 | 11010 | 47.32 | 899 | 903 | 213.6 |
| D | 1 | 52 | 2012513 | 9409.34 | 891 | 867 | 213.8 |
| D | 5 | 222 | 608404 | 2841.71 | 891 | 867 | 213.8 |
| D | 2 | 250 | 133415 | 619.98 | 891 | 867 | 213.8 |
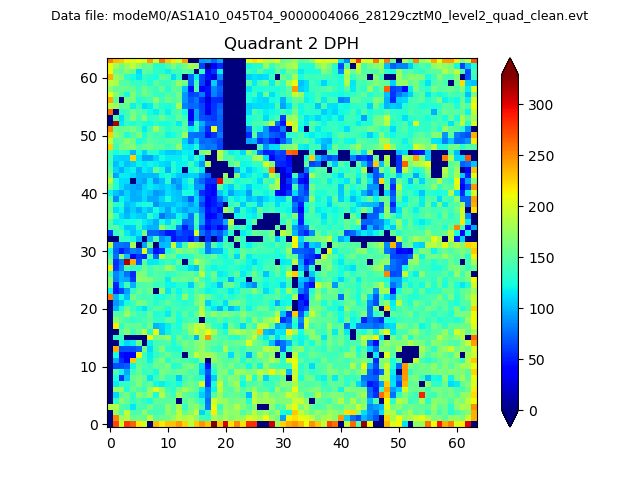
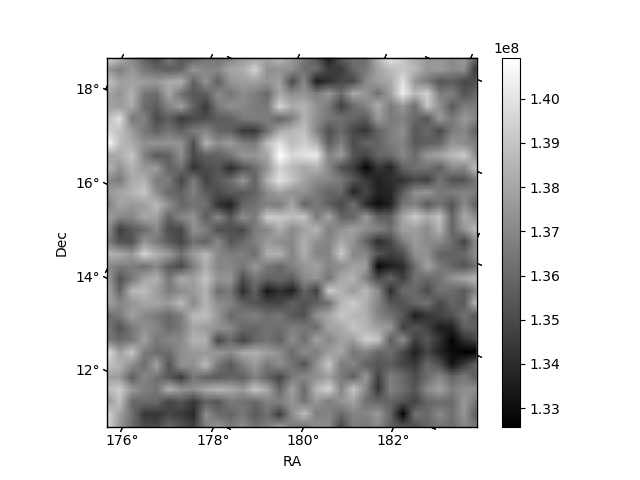
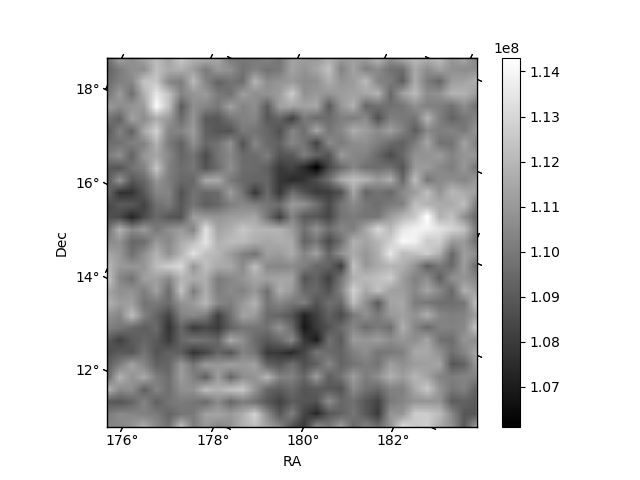
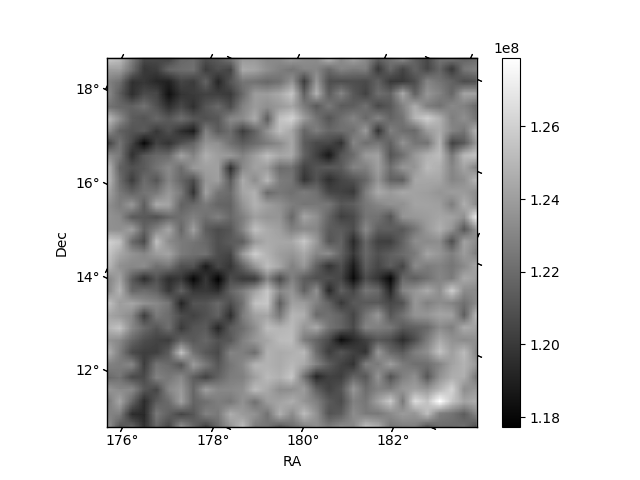
Histogram calculated using DETX and DETY for each event in the final _common_clean file
| Quadrant A | 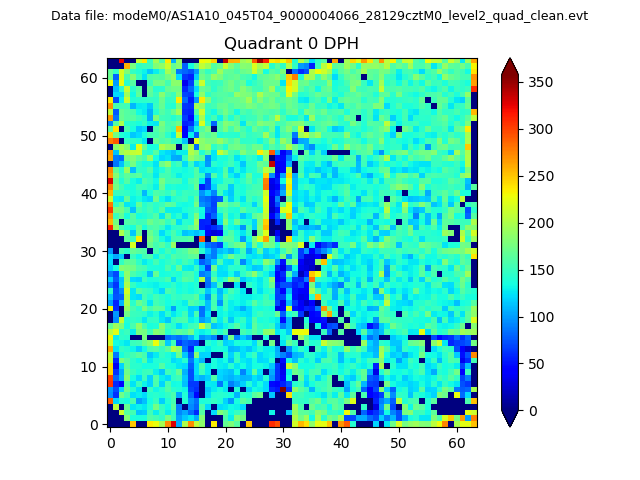 |
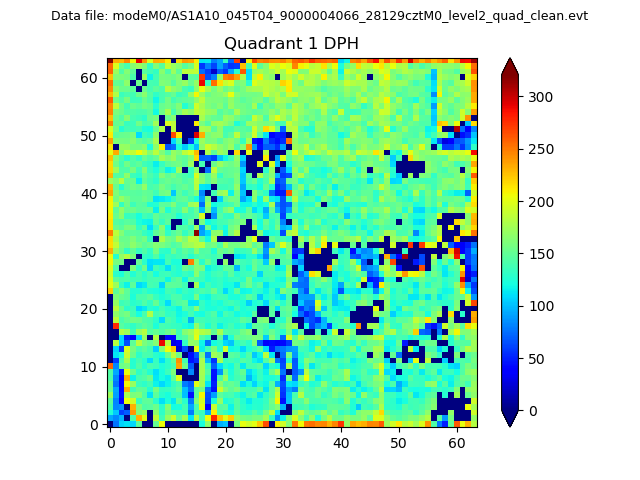 |
Quadrant B |
|---|---|---|---|
| Quadrant D | 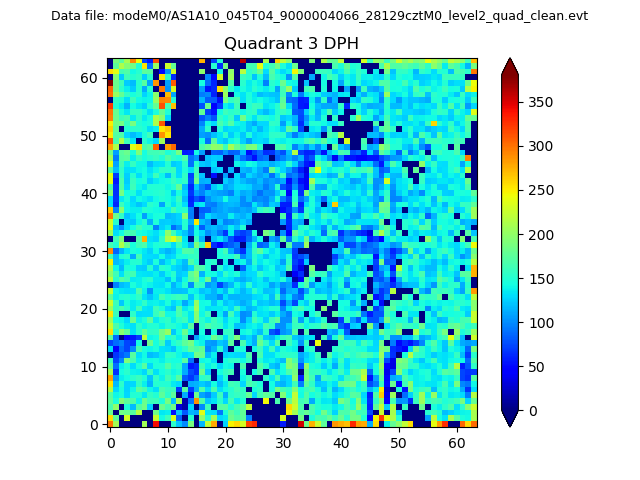 |
 |
Quadrant C |
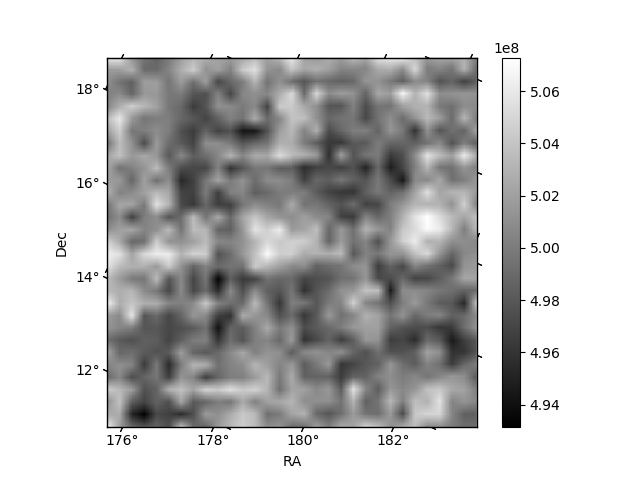
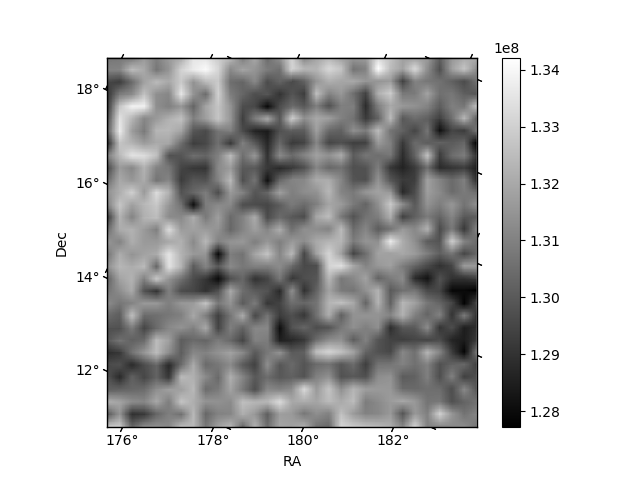
| Plot type | Count rate plots | Images |
|---|---|---|
| Comparison with Poisson distribution Blue bars denote a histogram of data divided into 1 sec bins. Red curve is a Poisson curve with rate = median count rate of data. |
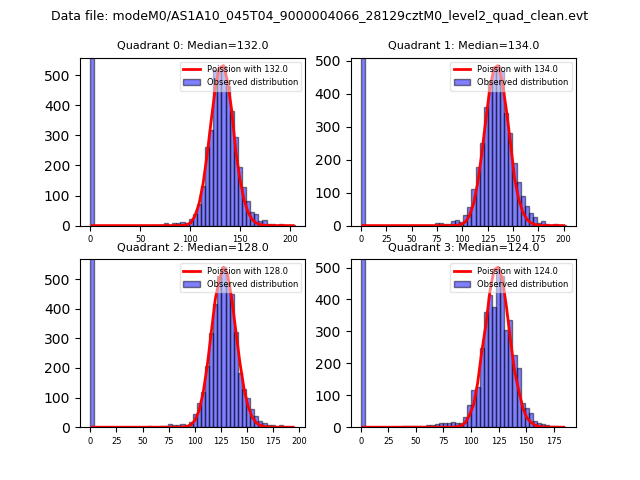 |
 |
| Quadrant-wise count rates Data is divided into 100 sec bins |
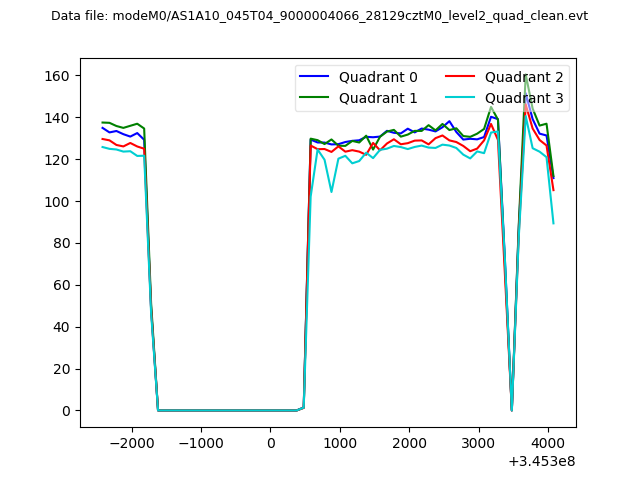 |
|
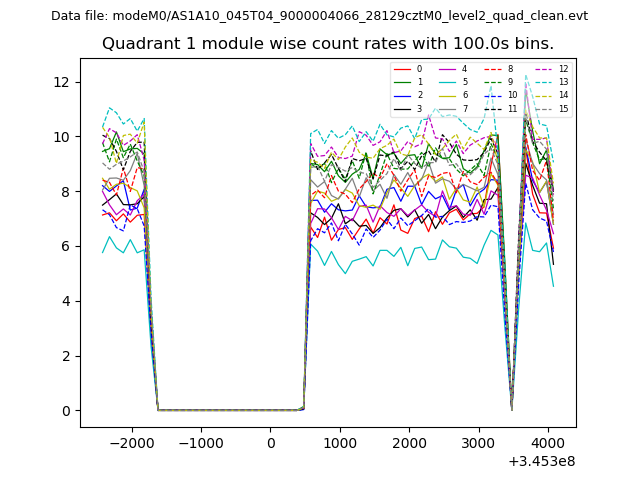
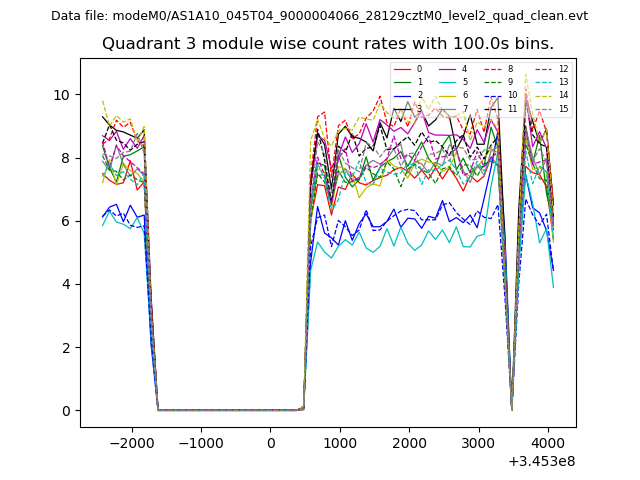
| Module-wise count rates for Quadrant A Data is divided into 100 sec bins |
 |
 |
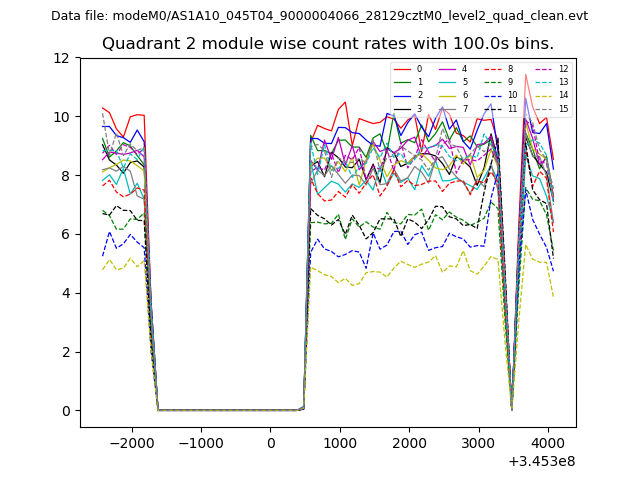
| Module-wise count rates for Quadrant B Data is divided into 100 sec bins |
 |
 |
| Module-wise count rates for Quadrant C Data is divided into 100 sec bins |
 |
 |
| Module-wise count rates for Quadrant D Data is divided into 100 sec bins |
 |
 |
| Parameter | Plot |
|---|---|
| CZT HV Monitor | 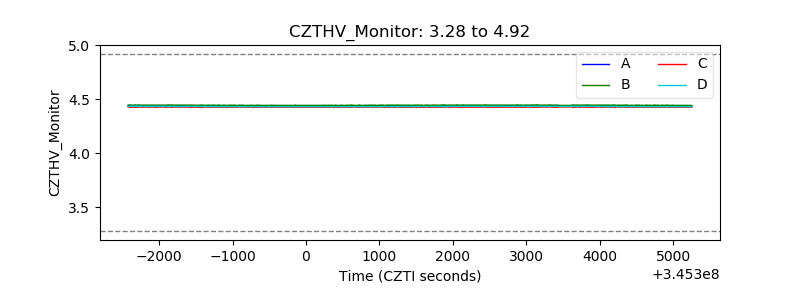 |
| D_VDD | 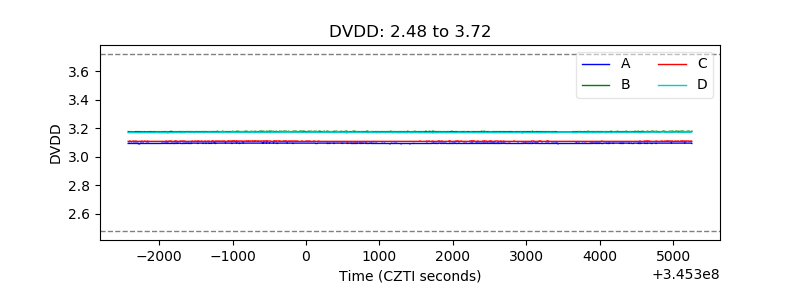 |
| Temperature 1 |  |
| Veto HV Monitor | 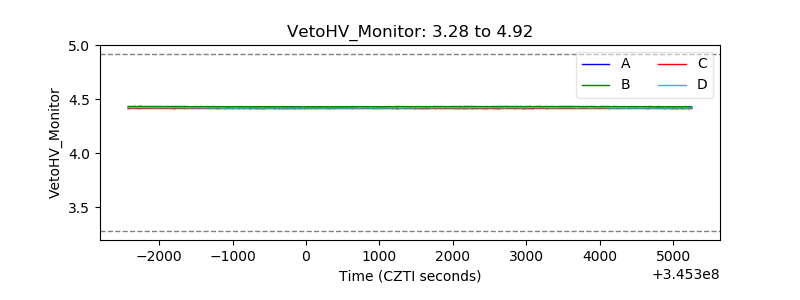 |
| Veto LLD | 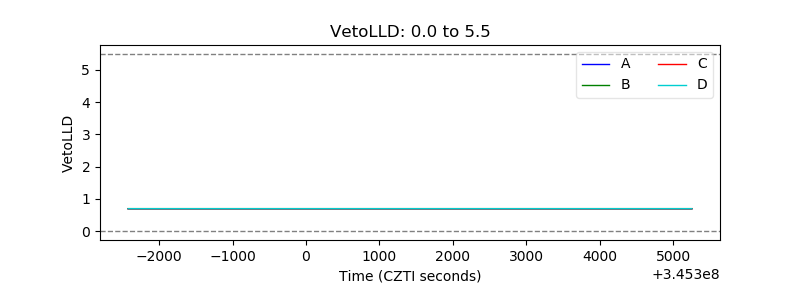 |
| Alpha Counter | 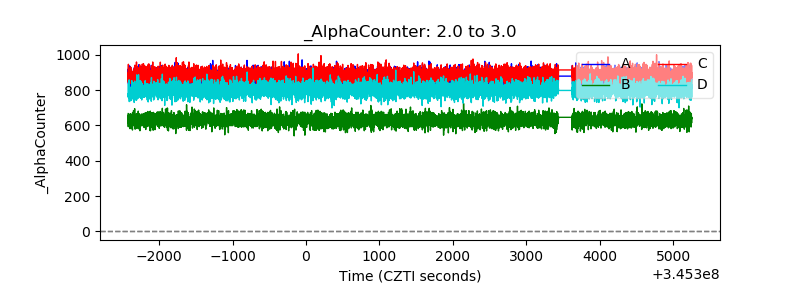 |
| _CPM_Rate | 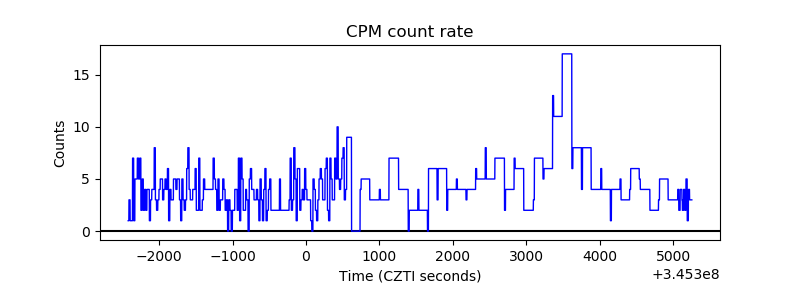 |
| CZT Counter | 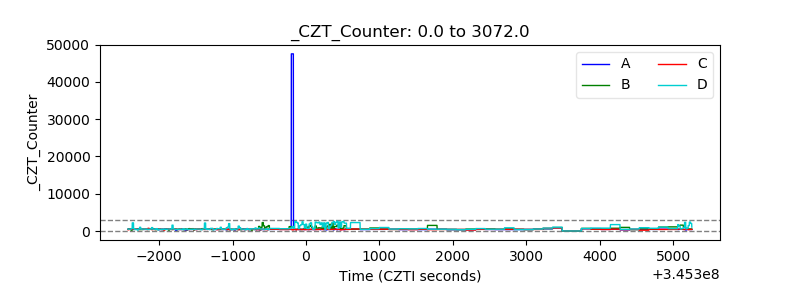 |
| +2.5 Volts monitor |  |
| +5 Volts monitor |  |
| _ROLL_ROT | 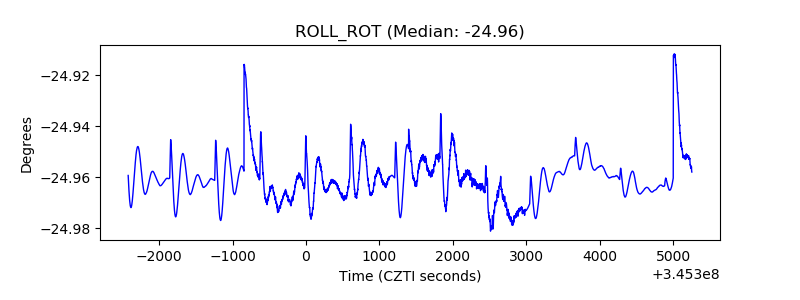 |
| _Roll_DEC | 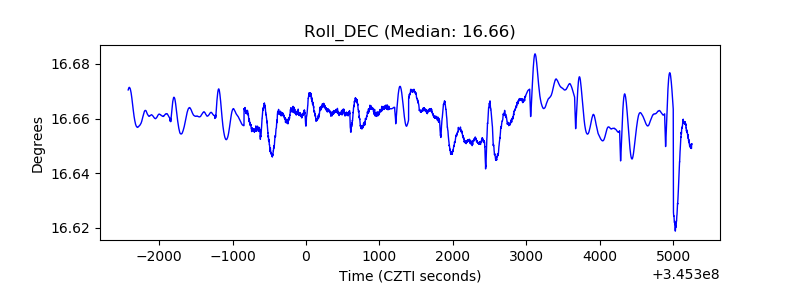 |
| _Roll_RA | 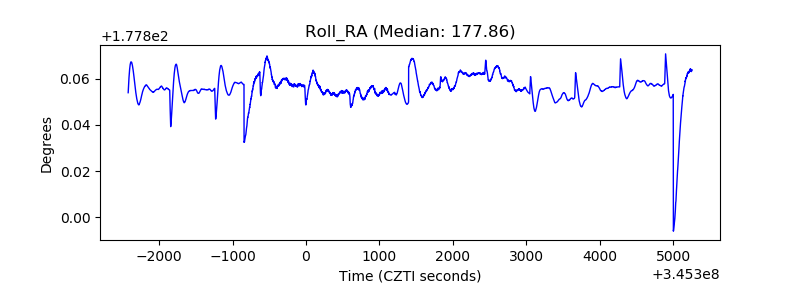 |
| Veto Counter |  |