| Param | Original file | Final file |
|---|---|---|
| Filename | modeM0/AS1A10_045T04_9000004066_28130cztM0_level2.evt | modeM0/AS1A10_045T04_9000004066_28130cztM0_level2_quad_clean.evt |
| Size (bytes) | 641,344,320 | 77,198,400 |
| Size | 611.6 MB | 73.6 MB |
| Events in quadrant A | 3,551,887 | 469,982 |
| Events in quadrant B | 4,934,577 | 472,799 |
| Events in quadrant C | 3,636,342 | 452,676 |
| Events in quadrant D | 6,804,878 | 432,272 |
| Mode M0 | |||
|---|---|---|---|
| Quadrant | BADHDUFLAG | Total packets | Discarded packets |
| A | 0 | 15136 | 0 |
| B | 0 | 19416 | 0 |
| C | 0 | 15349 | 0 |
| D | 0 | 25325 | 0 |
| Mode M9 | |||
|---|---|---|---|
| Quadrant | BADHDUFLAG | Total packets | Discarded packets |
| A | 0 | 2 | 0 |
| B | 0 | 2 | 0 |
| C | 0 | 2 | 0 |
| D | 0 | 2 | 0 |
| Quadrant | Total seconds | Saturated seconds | Saturation percentage |
|---|---|---|---|
| A | 7321 | 134 | 1.830351% |
| B | 7321 | 469 | 6.406229% |
| C | 7321 | 195 | 2.663571% |
| D | 7321 | 648 | 8.851250% |
Noise dominated data is calculated using 1-second bins in cleaned event files. If a bin has >2000 counts, and if more than 50% of those come from <1% of pixels, then it is considered to be noise-dominated and hence unusable.
| Quadrant | # 1 sec bins | Bins with >0 counts | Bins with >2000 counts | High rate bins dominated by noise | Noise dominated (total time) | Noise dominated (detector-on time) | Marked lightcurve |
|---|---|---|---|---|---|---|---|
| A | 7561 | 7322 | 0 | 0 | 0.00% | 0.00% |  |
| B | 7561 | 7321 | 233 | 233 | 3.08% | 3.18% |  |
| C | 7561 | 7321 | 4 | 4 | 0.05% | 0.05% |  |
| D | 7561 | 7321 | 457 | 457 | 6.04% | 6.24% |  |
Top three noisy pixels from each quadrant. If the there are fewer than three noisy pixels in the level2.evt file, extra rows are filled as -1
| Pixel properties | Quadrant properties | ||||||
|---|---|---|---|---|---|---|---|
| Quadrant | DetID | PixID | Counts | Sigma | Mean | Median | Sigma |
| A | 0 | 13 | 16923 | 85.54 | 915 | 895 | 187.4 |
| A | 13 | 254 | 11857 | 58.51 | 915 | 895 | 187.4 |
| A | 3 | 137 | 8953 | 43.01 | 915 | 895 | 187.4 |
| B | 10 | 245 | 1016896 | 5876.48 | 892 | 868 | 172.9 |
| B | 15 | 32 | 352313 | 2032.68 | 892 | 868 | 172.9 |
| B | 4 | 200 | 45914 | 260.54 | 892 | 868 | 172.9 |
| C | 14 | 238 | 139072 | 669.09 | 873 | 877 | 206.5 |
| C | 2 | 16 | 55340 | 263.69 | 873 | 877 | 206.5 |
| C | 3 | 233 | 37596 | 177.78 | 873 | 877 | 206.5 |
| D | 1 | 52 | 2580098 | 12342.7 | 862 | 840 | 209.0 |
| D | 5 | 222 | 344555 | 1644.8 | 862 | 840 | 209.0 |
| D | 2 | 250 | 249736 | 1191.06 | 862 | 840 | 209.0 |
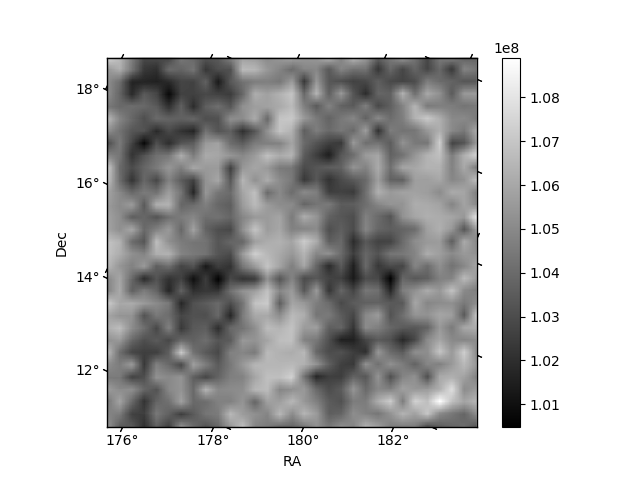
Histogram calculated using DETX and DETY for each event in the final _common_clean file
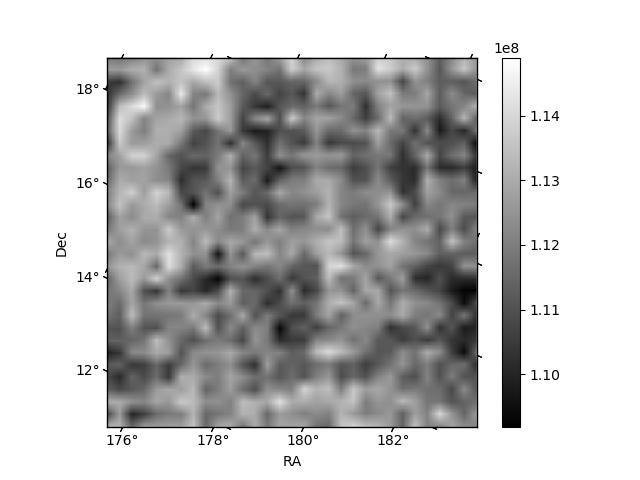
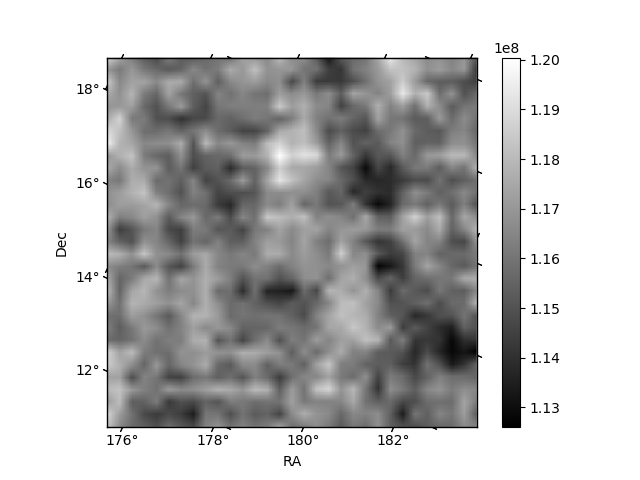
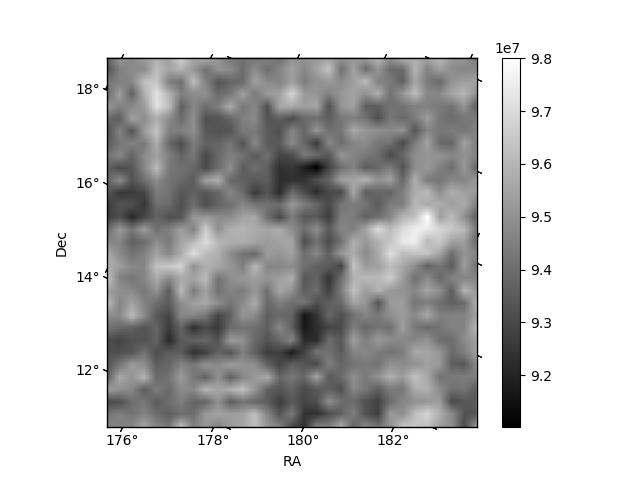
| Quadrant A | 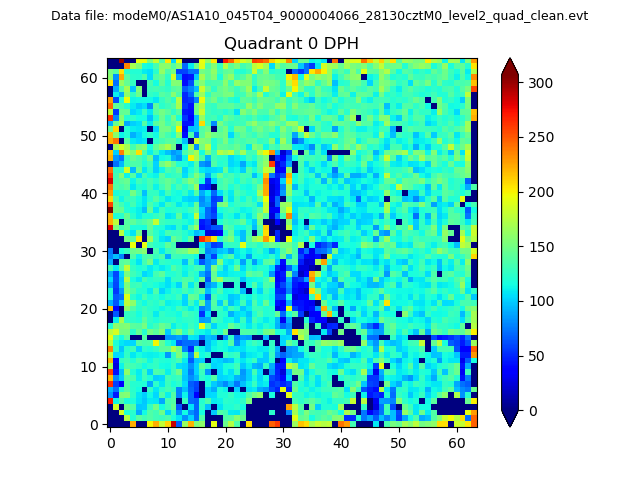 |
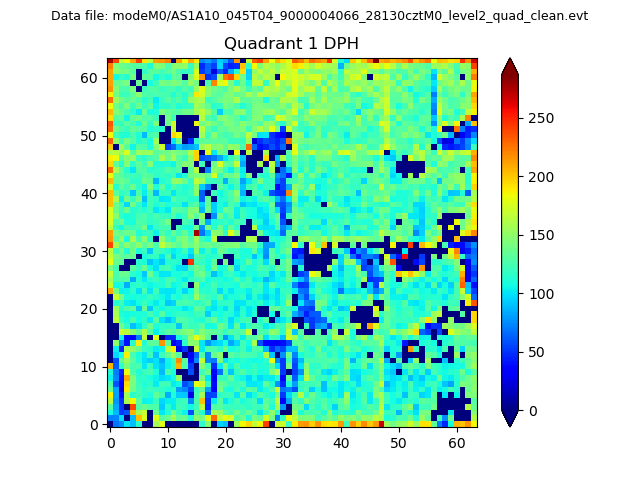 |
Quadrant B |
|---|---|---|---|
| Quadrant D | 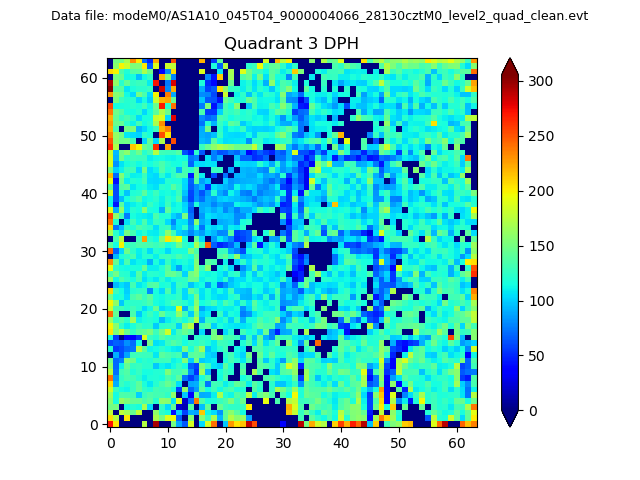 |
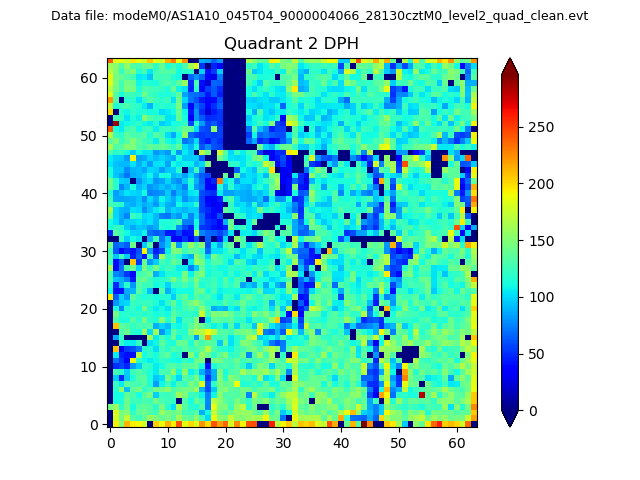 |
Quadrant C |
| Plot type | Count rate plots | Images |
|---|---|---|
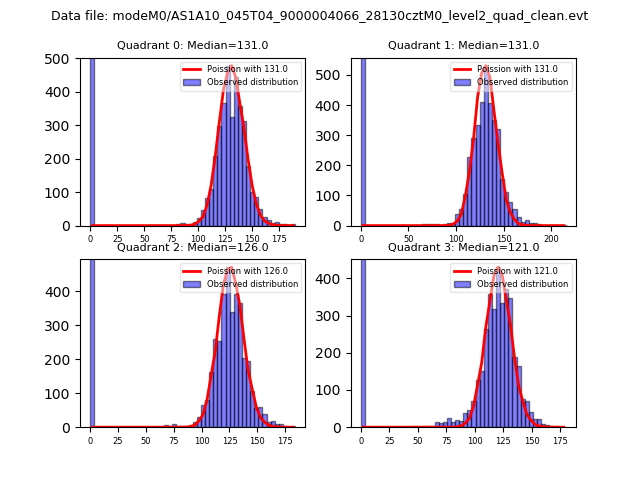
| Comparison with Poisson distribution Blue bars denote a histogram of data divided into 1 sec bins. Red curve is a Poisson curve with rate = median count rate of data. |
 |
 |
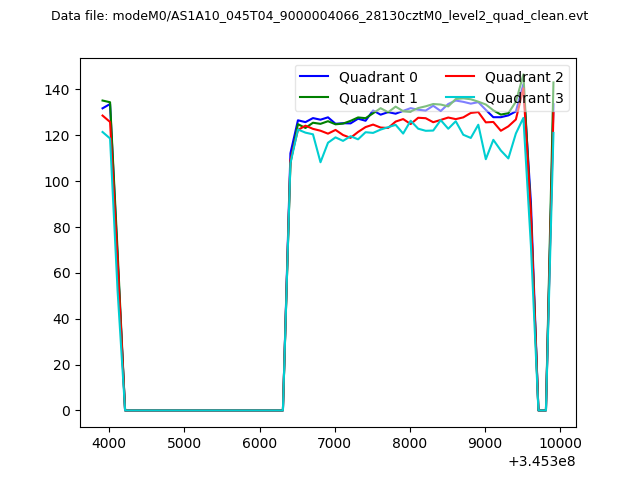
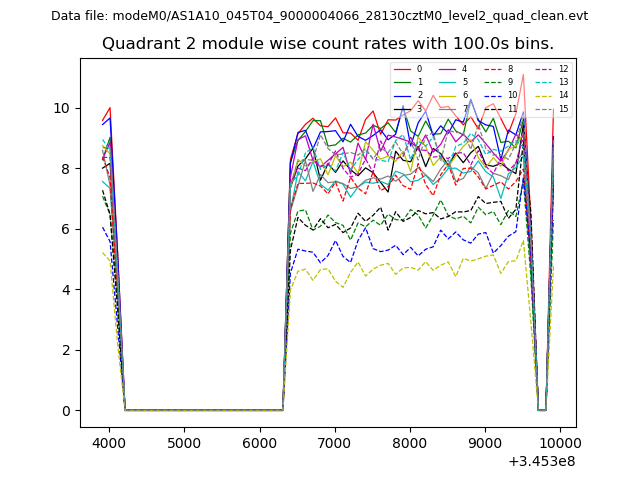
| Quadrant-wise count rates Data is divided into 100 sec bins |
 |
|
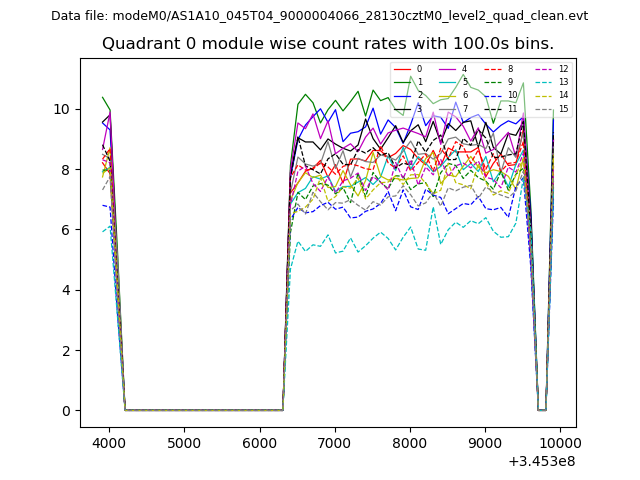
| Module-wise count rates for Quadrant A Data is divided into 100 sec bins |
 |
 |
| Module-wise count rates for Quadrant B Data is divided into 100 sec bins |
 |
 |
| Module-wise count rates for Quadrant C Data is divided into 100 sec bins |
 |
 |
| Module-wise count rates for Quadrant D Data is divided into 100 sec bins |
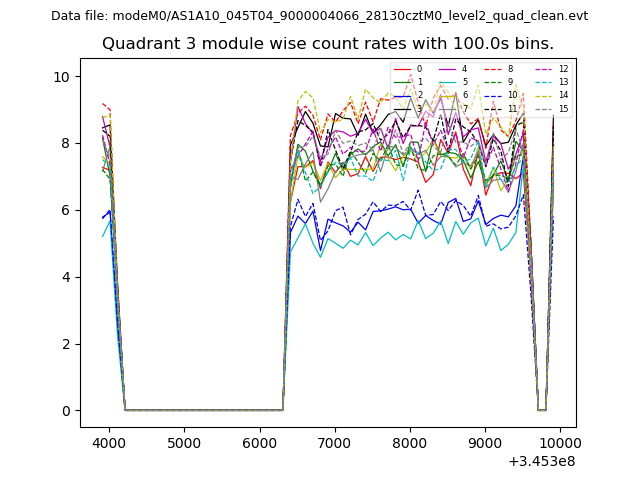 |
 |
| Parameter | Plot |
|---|---|
| CZT HV Monitor | 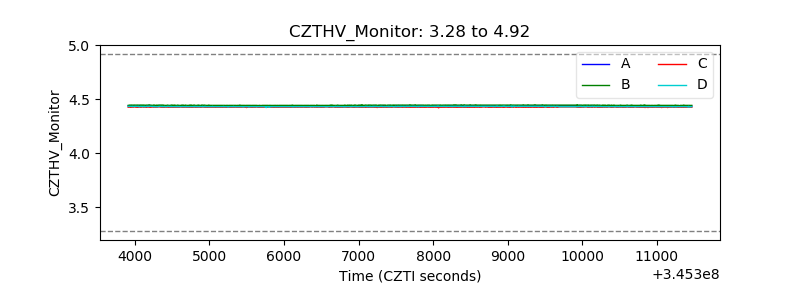 |
| D_VDD | 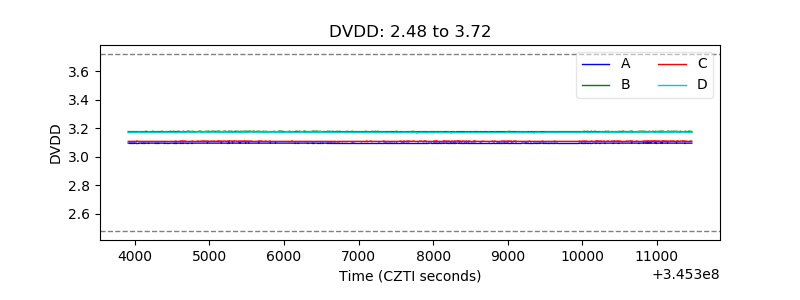 |
| Temperature 1 |  |
| Veto HV Monitor | 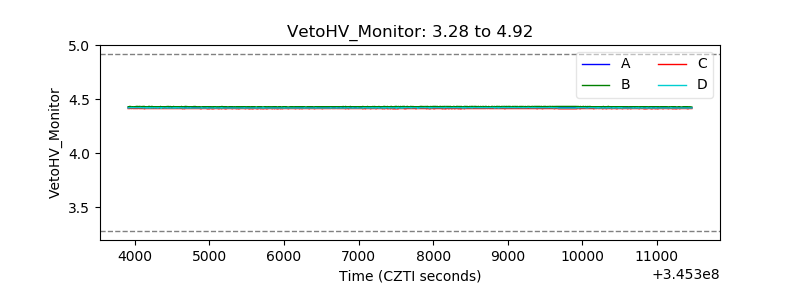 |
| Veto LLD | 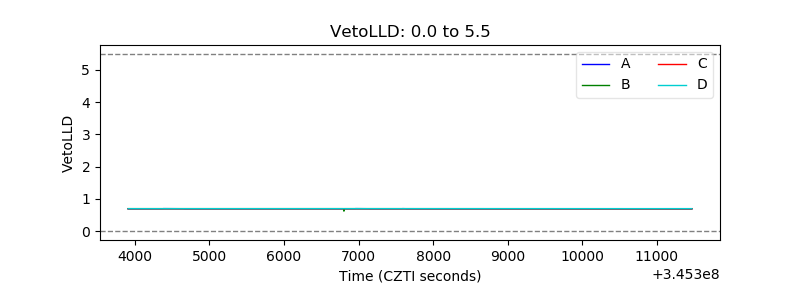 |
| Alpha Counter | 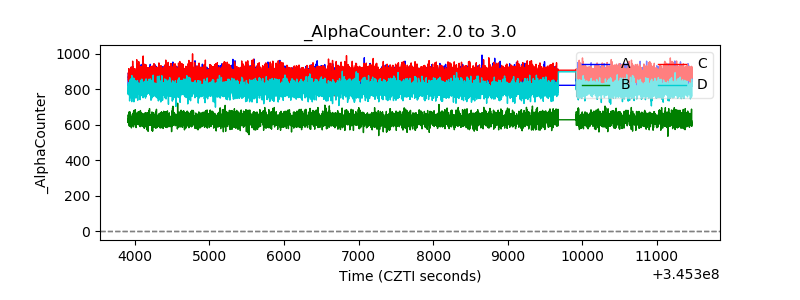 |
| _CPM_Rate | 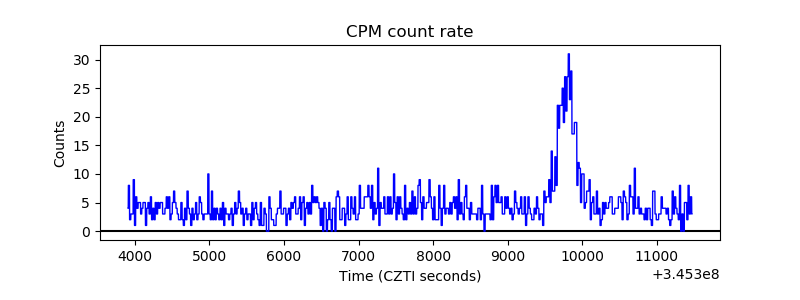 |
| CZT Counter | 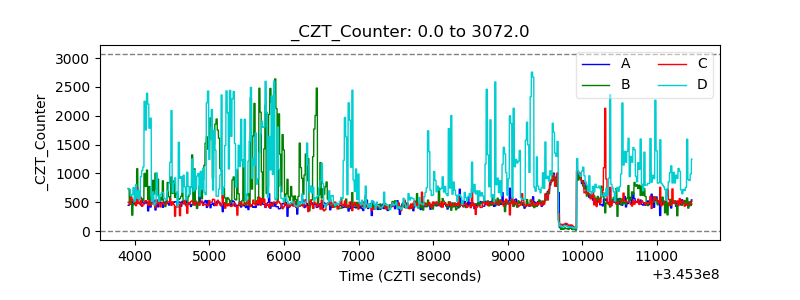 |
| +2.5 Volts monitor |  |
| +5 Volts monitor | 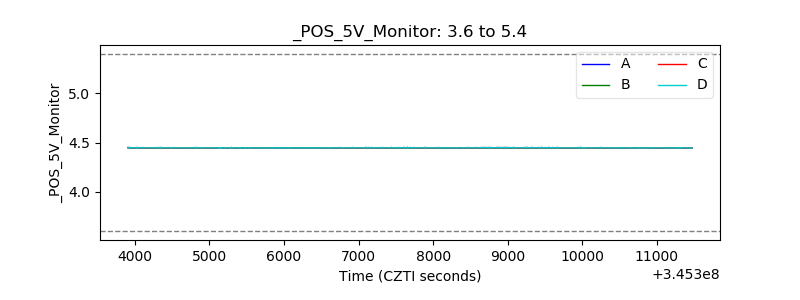 |
| _ROLL_ROT |  |
| _Roll_DEC | 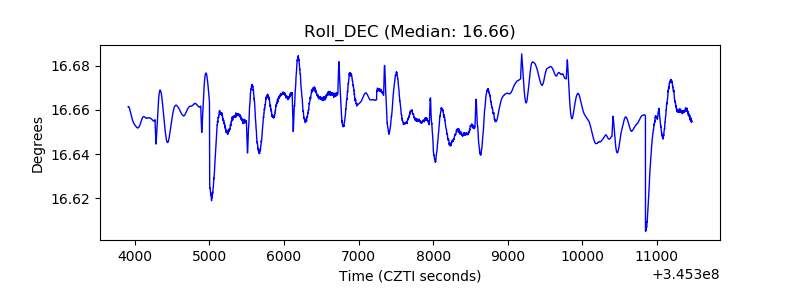 |
| _Roll_RA | 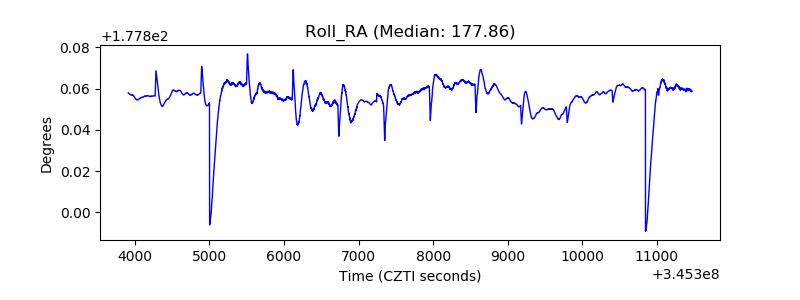 |
| Veto Counter | 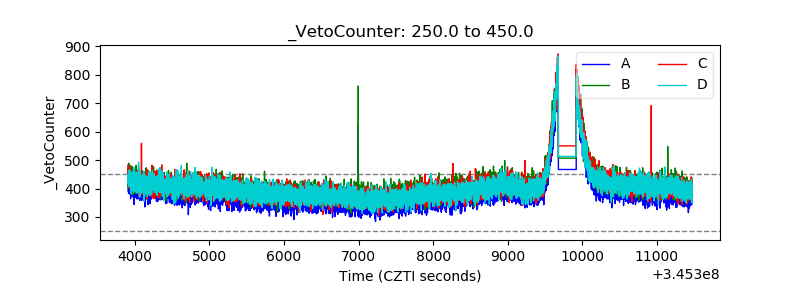 |