| Param | Original file | Final file |
|---|---|---|
| Filename | modeM0/AS1A10_045T04_9000004066_28134cztM0_level2.evt | modeM0/AS1A10_045T04_9000004066_28134cztM0_level2_quad_clean.evt |
| Size (bytes) | 836,127,360 | 156,928,320 |
| Size | 797.4 MB | 149.7 MB |
| Events in quadrant A | 5,176,748 | 1,021,782 |
| Events in quadrant B | 5,376,581 | 1,036,687 |
| Events in quadrant C | 5,290,358 | 990,971 |
| Events in quadrant D | 8,729,209 | 937,229 |
| Mode M0 | |||
|---|---|---|---|
| Quadrant | BADHDUFLAG | Total packets | Discarded packets |
| A | 0 | 22691 | 0 |
| B | 0 | 23340 | 0 |
| C | 0 | 22880 | 0 |
| D | 0 | 33425 | 0 |
| Mode M9 | |||
|---|---|---|---|
| Quadrant | BADHDUFLAG | Total packets | Discarded packets |
| A | 0 | 18 | 0 |
| B | 0 | 18 | 0 |
| C | 0 | 18 | 0 |
| D | 0 | 18 | 0 |
| Quadrant | Total seconds | Saturated seconds | Saturation percentage |
|---|---|---|---|
| A | 11069 | 70 | 0.632397% |
| B | 11070 | 99 | 0.894309% |
| C | 11070 | 136 | 1.228546% |
| D | 11070 | 845 | 7.633243% |
Noise dominated data is calculated using 1-second bins in cleaned event files. If a bin has >2000 counts, and if more than 50% of those come from <1% of pixels, then it is considered to be noise-dominated and hence unusable.
| Quadrant | # 1 sec bins | Bins with >0 counts | Bins with >2000 counts | High rate bins dominated by noise | Noise dominated (total time) | Noise dominated (detector-on time) | Marked lightcurve |
|---|---|---|---|---|---|---|---|
| A | 12809 | 11069 | 0 | 0 | 0.00% | 0.00% | 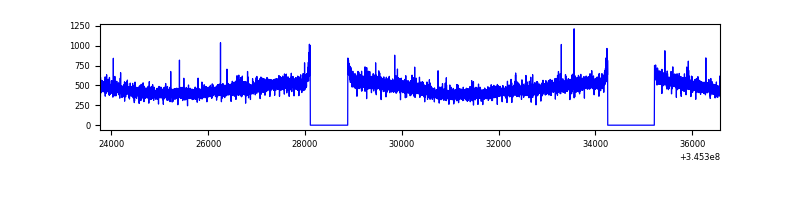 |
| B | 12810 | 11070 | 4 | 4 | 0.03% | 0.04% | 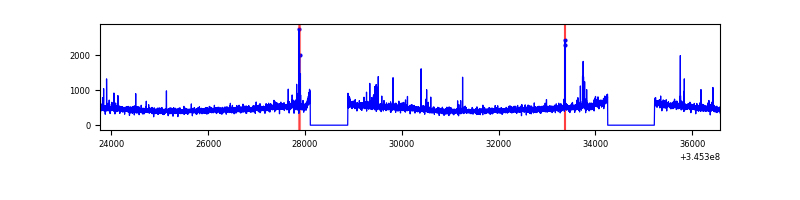 |
| C | 12810 | 11072 | 4 | 4 | 0.03% | 0.04% | 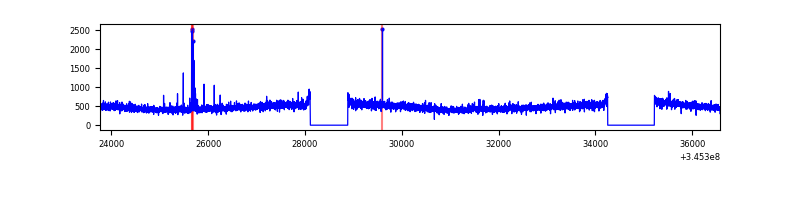 |
| D | 12810 | 11070 | 779 | 779 | 6.08% | 7.04% | 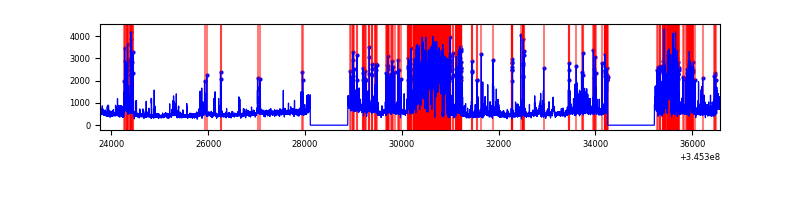 |
Top three noisy pixels from each quadrant. If the there are fewer than three noisy pixels in the level2.evt file, extra rows are filled as -1
| Pixel properties | Quadrant properties | ||||||
|---|---|---|---|---|---|---|---|
| Quadrant | DetID | PixID | Counts | Sigma | Mean | Median | Sigma |
| A | 13 | 254 | 18332 | 63.04 | 1337 | 1310 | 270.0 |
| A | 0 | 13 | 17365 | 59.46 | 1337 | 1310 | 270.0 |
| A | 3 | 137 | 13358 | 44.62 | 1337 | 1310 | 270.0 |
| B | 4 | 200 | 65157 | 251.02 | 1330 | 1296 | 254.4 |
| B | 15 | 32 | 38914 | 147.86 | 1330 | 1296 | 254.4 |
| B | 12 | 111 | 32000 | 120.69 | 1330 | 1296 | 254.4 |
| C | 14 | 238 | 206243 | 678.51 | 1282 | 1289 | 302.1 |
| C | 2 | 16 | 81533 | 265.65 | 1282 | 1289 | 302.1 |
| C | 3 | 233 | 11388 | 33.43 | 1282 | 1289 | 302.1 |
| D | 1 | 52 | 1447013 | 4801.15 | 1257 | 1226 | 301.1 |
| D | 5 | 222 | 1319425 | 4377.45 | 1257 | 1226 | 301.1 |
| D | 8 | 195 | 537625 | 1781.26 | 1257 | 1226 | 301.1 |
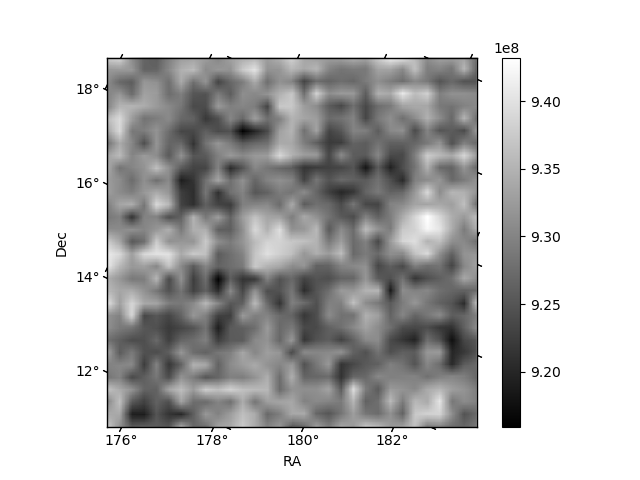
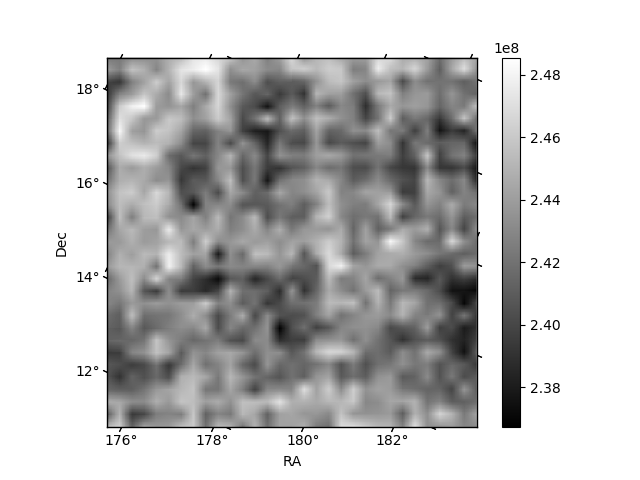
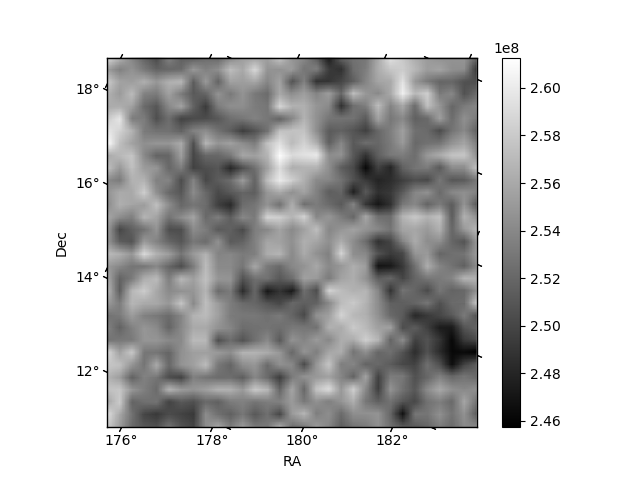
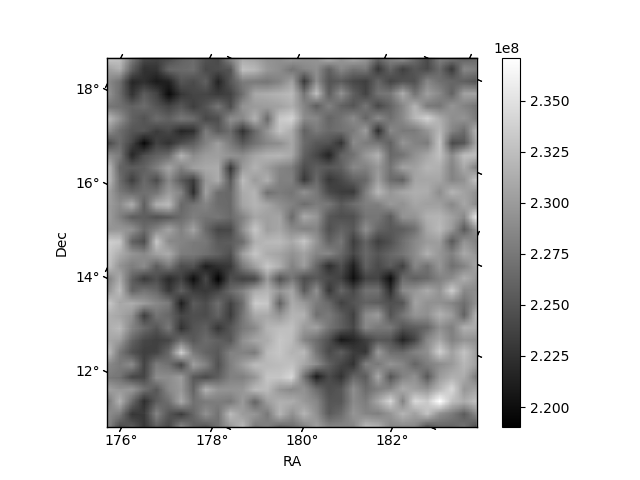
Histogram calculated using DETX and DETY for each event in the final _common_clean file
| Quadrant A | 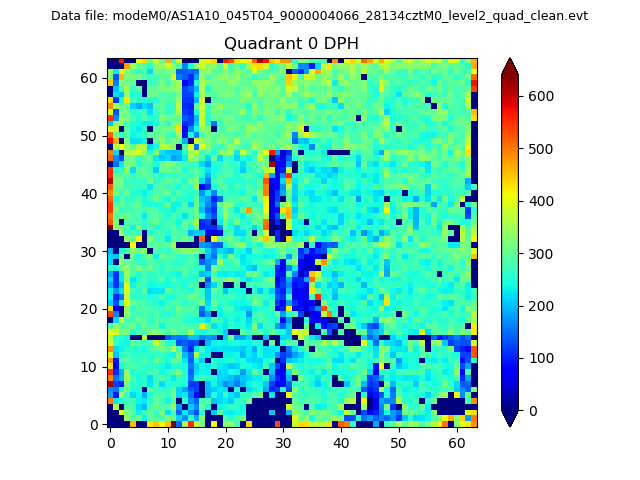 |
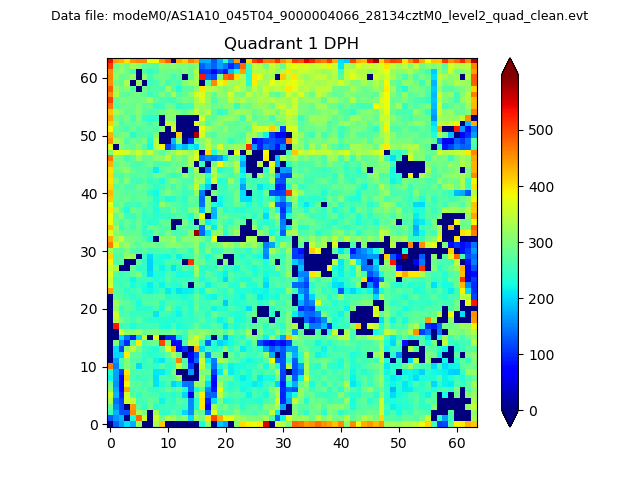 |
Quadrant B |
|---|---|---|---|
| Quadrant D |  |
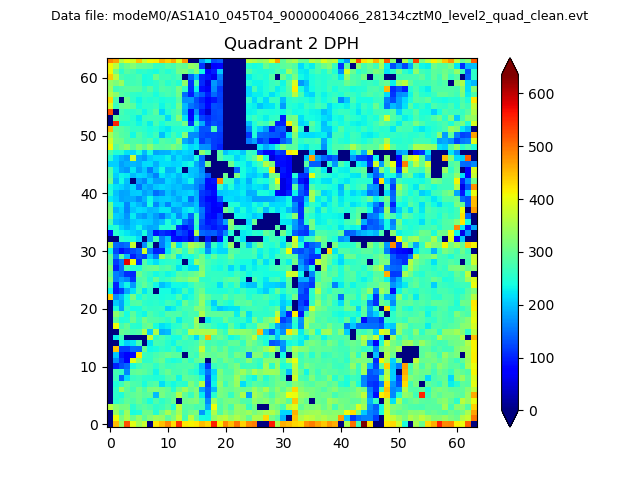 |
Quadrant C |
| Plot type | Count rate plots | Images |
|---|---|---|
| Comparison with Poisson distribution Blue bars denote a histogram of data divided into 1 sec bins. Red curve is a Poisson curve with rate = median count rate of data. |
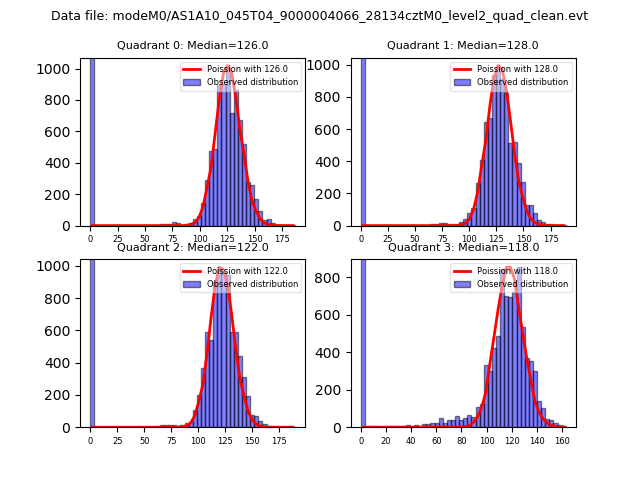 |
 |
| Quadrant-wise count rates Data is divided into 100 sec bins |
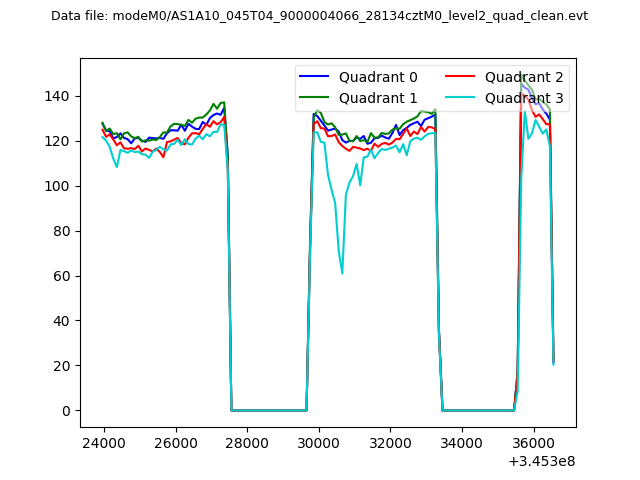 |
|
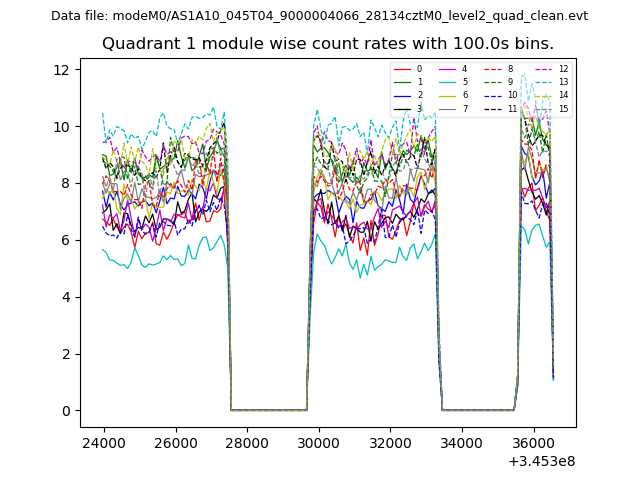
| Module-wise count rates for Quadrant A Data is divided into 100 sec bins |
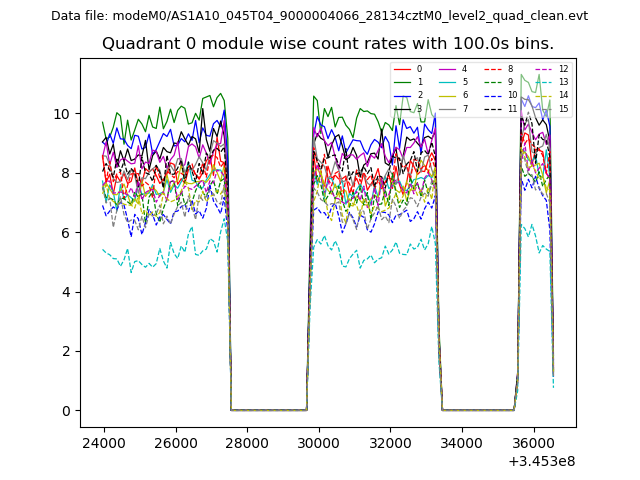 |
 |
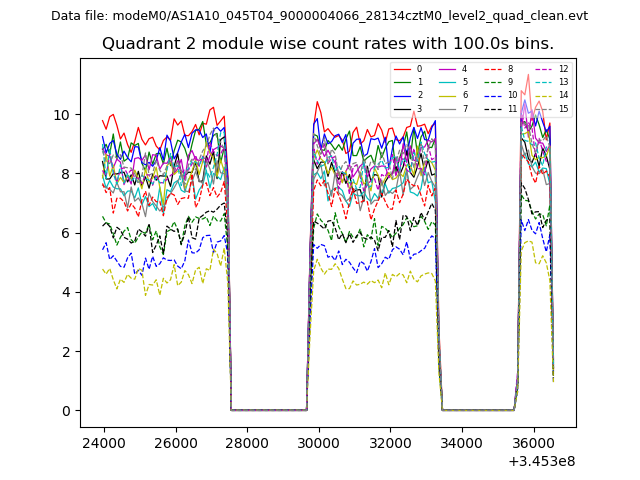
| Module-wise count rates for Quadrant B Data is divided into 100 sec bins |
 |
 |
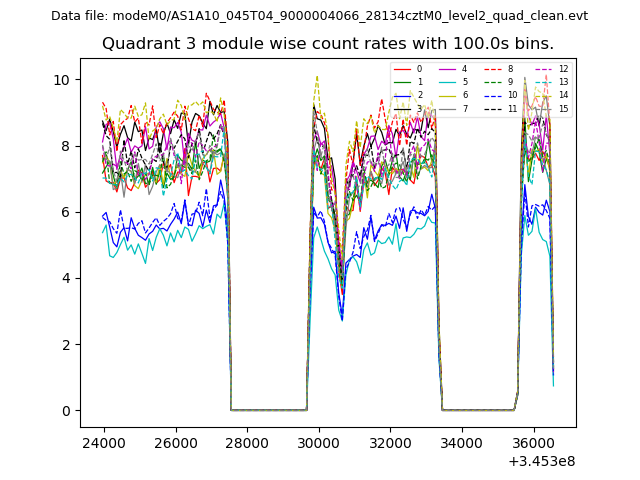
| Module-wise count rates for Quadrant C Data is divided into 100 sec bins |
 |
 |
| Module-wise count rates for Quadrant D Data is divided into 100 sec bins |
 |
 |
| Parameter | Plot |
|---|---|
| CZT HV Monitor | 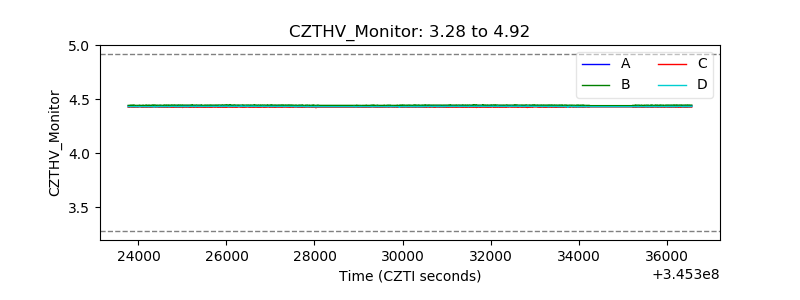 |
| D_VDD | 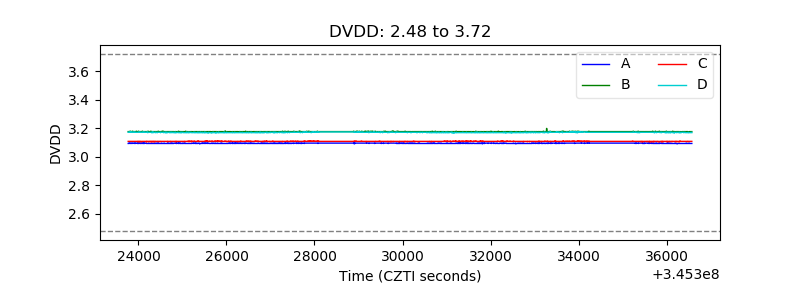 |
| Temperature 1 |  |
| Veto HV Monitor | 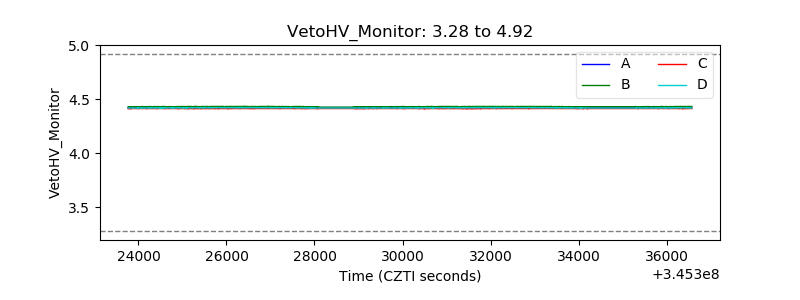 |
| Veto LLD | 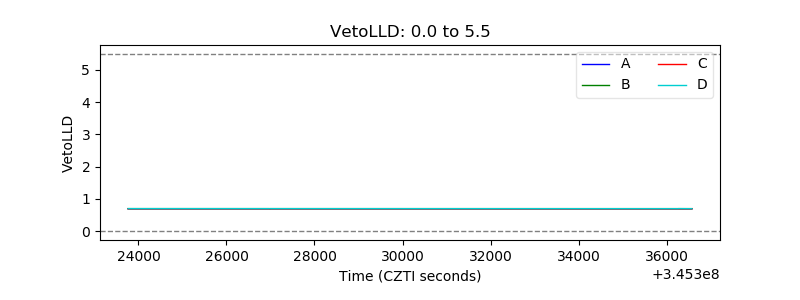 |
| Alpha Counter | 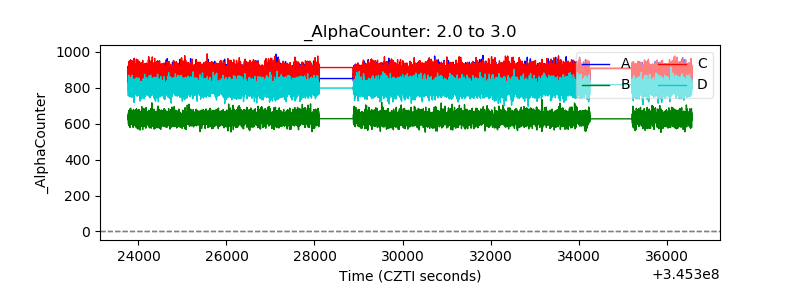 |
| _CPM_Rate | 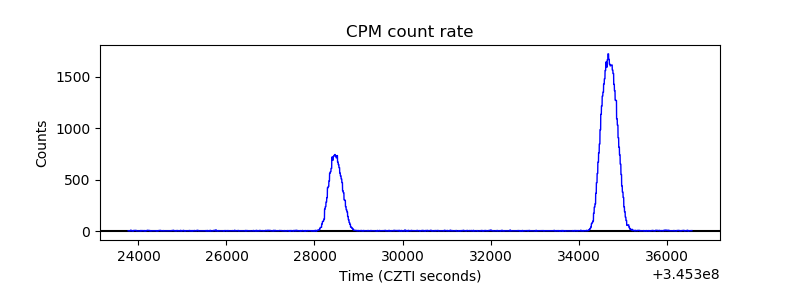 |
| CZT Counter | 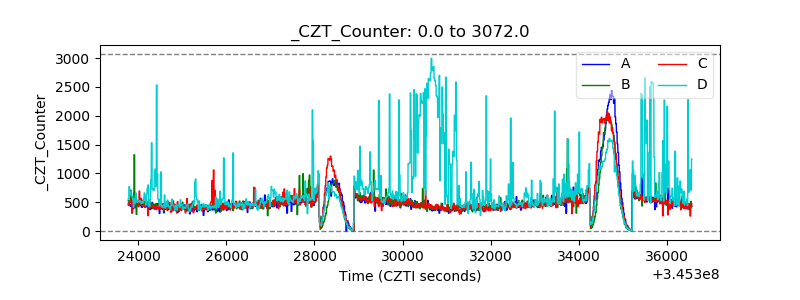 |
| +2.5 Volts monitor |  |
| +5 Volts monitor |  |
| _ROLL_ROT |  |
| _Roll_DEC | 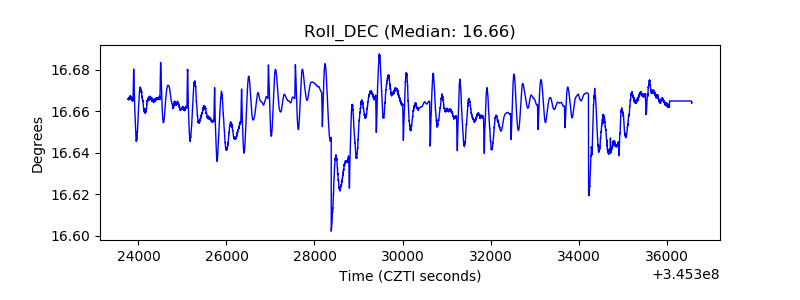 |
| _Roll_RA | 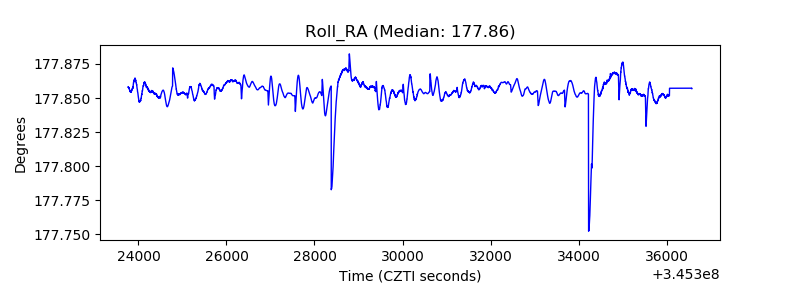 |
| Veto Counter | 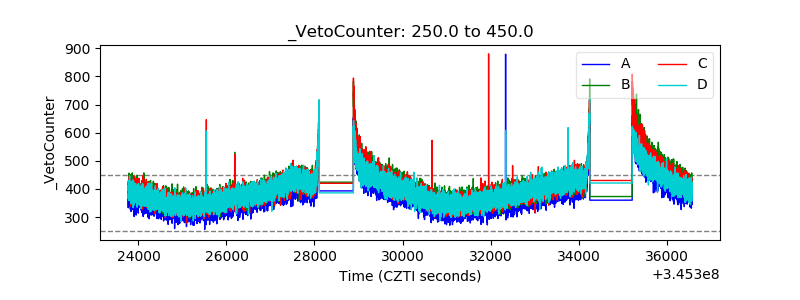 |