| Param | Original file | Final file |
|---|---|---|
| Filename | modeM0/AS1A10_045T04_9000004066_28136cztM0_level2.evt | modeM0/AS1A10_045T04_9000004066_28136cztM0_level2_quad_clean.evt |
| Size (bytes) | 1,004,186,880 | 179,640,000 |
| Size | 957.7 MB | 171.3 MB |
| Events in quadrant A | 6,297,956 | 1,160,597 |
| Events in quadrant B | 6,463,486 | 1,181,279 |
| Events in quadrant C | 6,414,954 | 1,122,346 |
| Events in quadrant D | 10,347,935 | 1,069,516 |
| Mode M0 | |||
|---|---|---|---|
| Quadrant | BADHDUFLAG | Total packets | Discarded packets |
| A | 0 | 27139 | 0 |
| B | 0 | 27657 | 0 |
| C | 0 | 27485 | 0 |
| D | 0 | 39584 | 0 |
| Mode M9 | |||
|---|---|---|---|
| Quadrant | BADHDUFLAG | Total packets | Discarded packets |
| A | 0 | 21 | 0 |
| B | 0 | 22 | 0 |
| C | 0 | 22 | 0 |
| D | 0 | 22 | 0 |
| Quadrant | Total seconds | Saturated seconds | Saturation percentage |
|---|---|---|---|
| A | 13124 | 91 | 0.693386% |
| B | 13125 | 128 | 0.975238% |
| C | 13124 | 202 | 1.539165% |
| D | 13124 | 943 | 7.185309% |
Noise dominated data is calculated using 1-second bins in cleaned event files. If a bin has >2000 counts, and if more than 50% of those come from <1% of pixels, then it is considered to be noise-dominated and hence unusable.
| Quadrant | # 1 sec bins | Bins with >0 counts | Bins with >2000 counts | High rate bins dominated by noise | Noise dominated (total time) | Noise dominated (detector-on time) | Marked lightcurve |
|---|---|---|---|---|---|---|---|
| A | 31886 | 13127 | 1 | 1 | 0.00% | 0.01% | 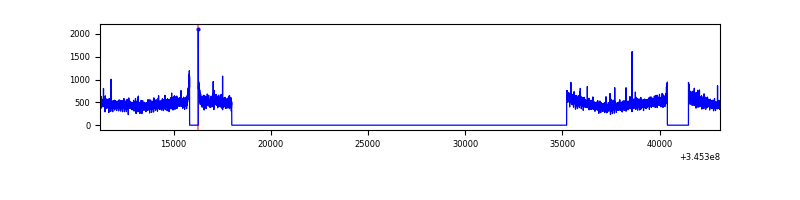 |
| B | 31887 | 13126 | 1 | 1 | 0.00% | 0.01% | 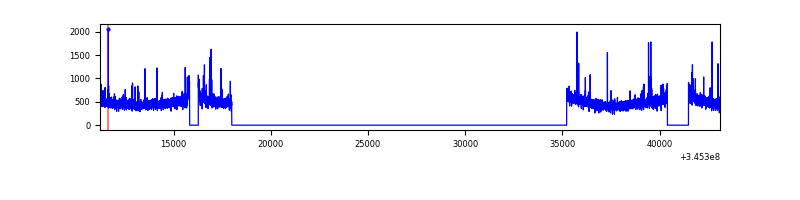 |
| C | 31887 | 13125 | 4 | 4 | 0.01% | 0.03% | 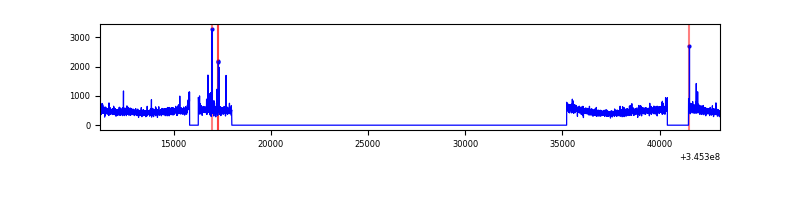 |
| D | 31887 | 13126 | 735 | 735 | 2.31% | 5.60% | 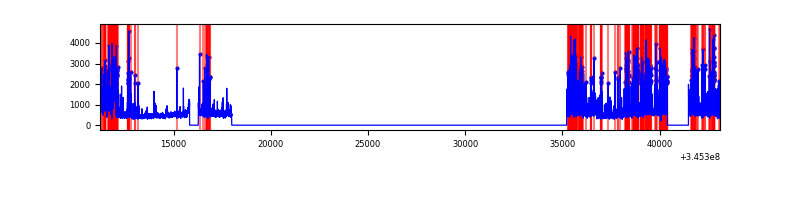 |
Top three noisy pixels from each quadrant. If the there are fewer than three noisy pixels in the level2.evt file, extra rows are filled as -1
| Pixel properties | Quadrant properties | ||||||
|---|---|---|---|---|---|---|---|
| Quadrant | DetID | PixID | Counts | Sigma | Mean | Median | Sigma |
| A | 0 | 13 | 47040 | 140.19 | 1619 | 1588 | 324.2 |
| A | 13 | 254 | 21934 | 62.75 | 1619 | 1588 | 324.2 |
| A | 3 | 137 | 15771 | 43.74 | 1619 | 1588 | 324.2 |
| B | 15 | 32 | 39812 | 124.87 | 1611 | 1569 | 306.3 |
| B | 12 | 111 | 38227 | 119.69 | 1611 | 1569 | 306.3 |
| B | 11 | 111 | 35018 | 109.22 | 1611 | 1569 | 306.3 |
| C | 14 | 238 | 252308 | 686.93 | 1551 | 1566 | 365.0 |
| C | 2 | 16 | 96118 | 259.03 | 1551 | 1566 | 365.0 |
| C | 3 | 233 | 22631 | 57.71 | 1551 | 1566 | 365.0 |
| D | 1 | 52 | 3585439 | 9835.26 | 1518 | 1478 | 364.4 |
| D | 2 | 250 | 338467 | 924.78 | 1518 | 1478 | 364.4 |
| D | 8 | 195 | 292013 | 797.3 | 1518 | 1478 | 364.4 |
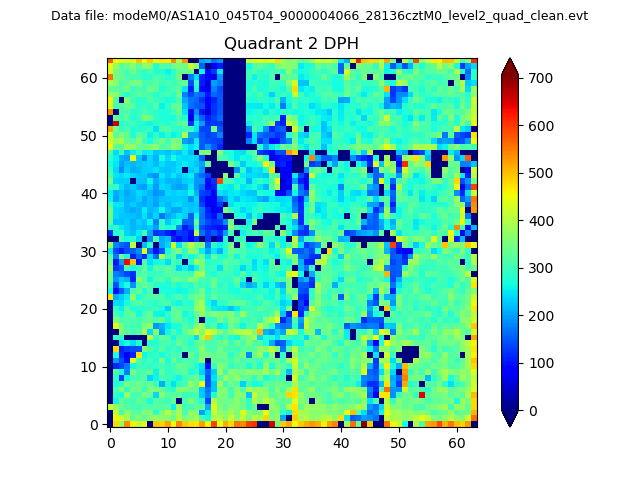
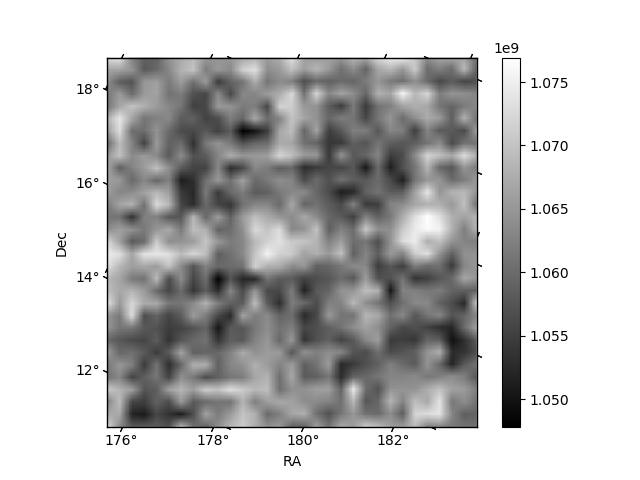
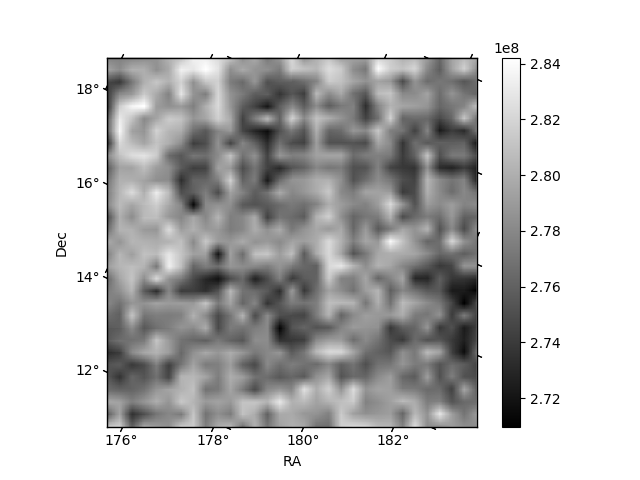
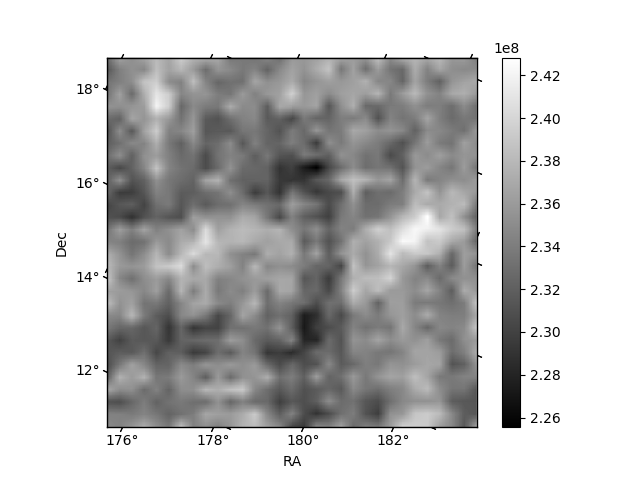
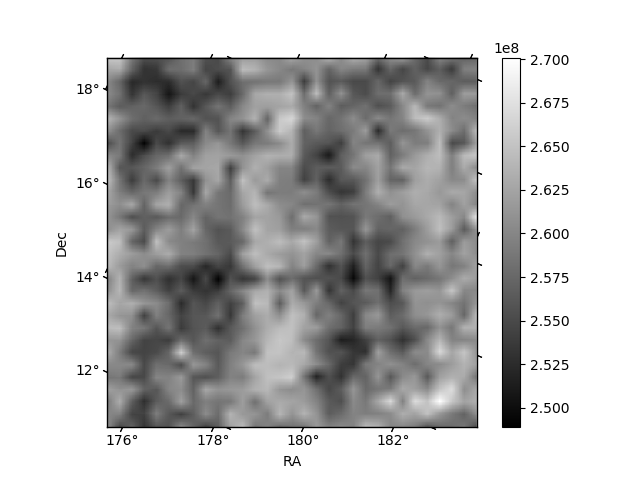
Histogram calculated using DETX and DETY for each event in the final _common_clean file
| Quadrant A | 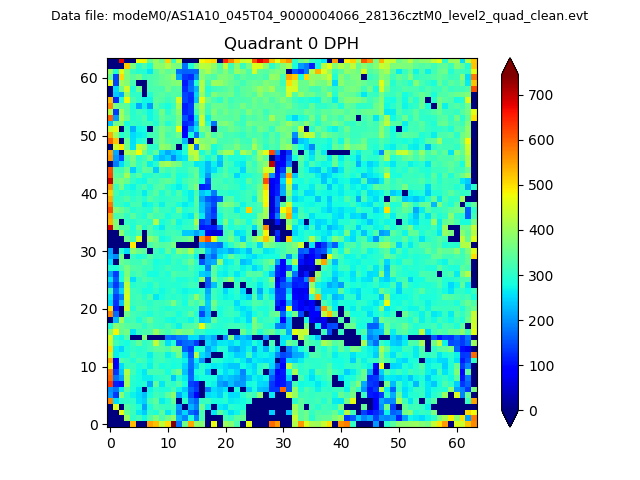 |
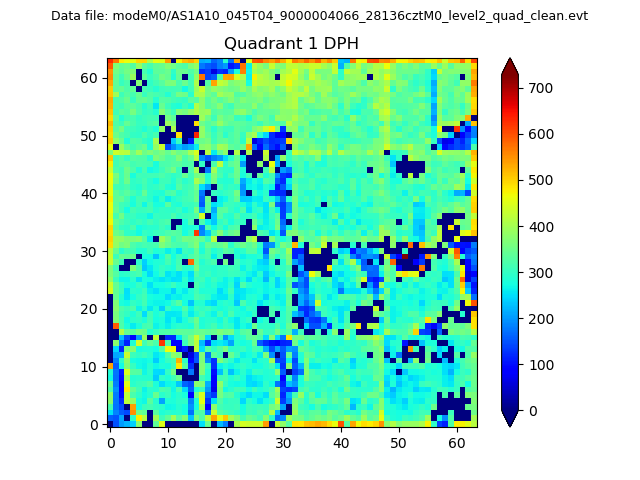 |
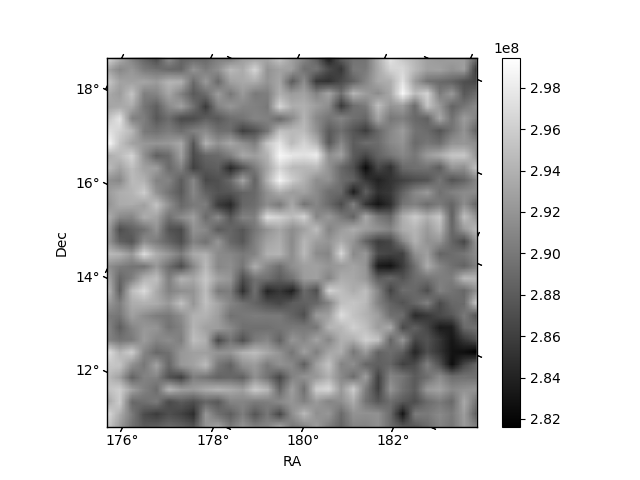
Quadrant B |
|---|---|---|---|
| Quadrant D | 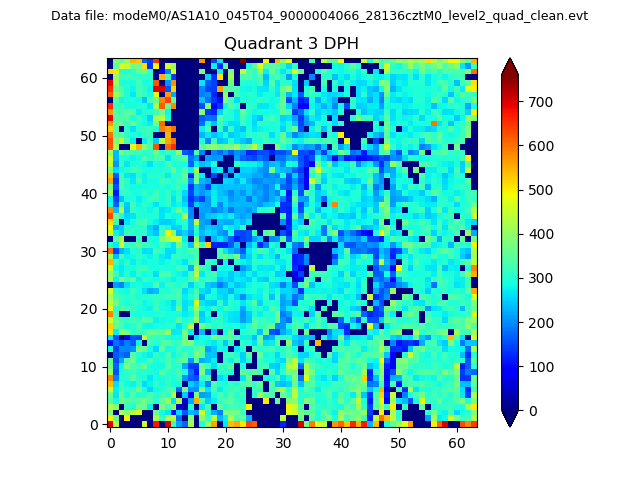 |
 |
Quadrant C |
| Plot type | Count rate plots | Images |
|---|---|---|
| Comparison with Poisson distribution Blue bars denote a histogram of data divided into 1 sec bins. Red curve is a Poisson curve with rate = median count rate of data. |
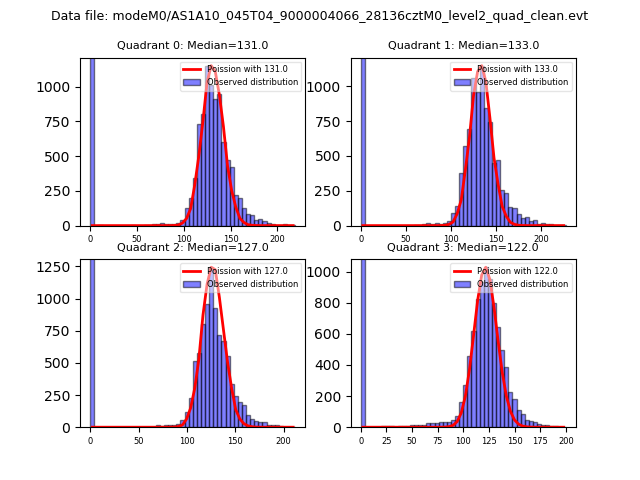 |
 |
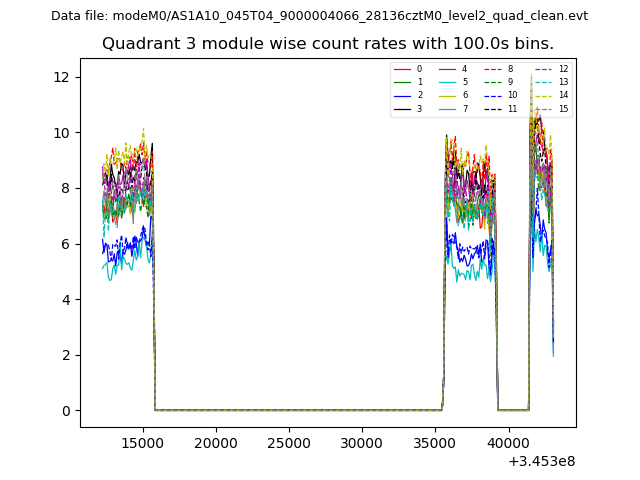
| Quadrant-wise count rates Data is divided into 100 sec bins |
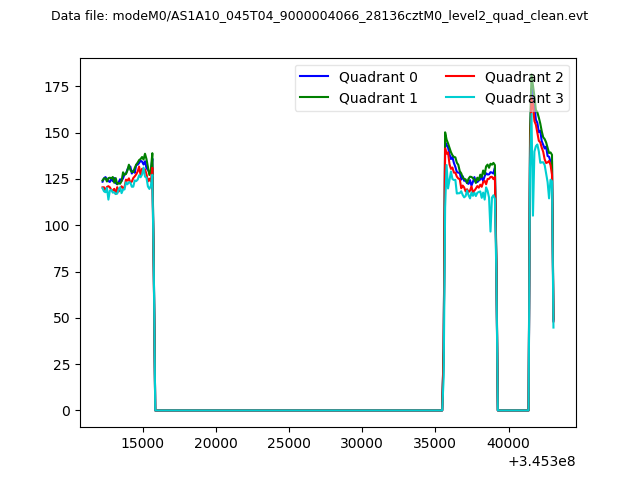 |
|
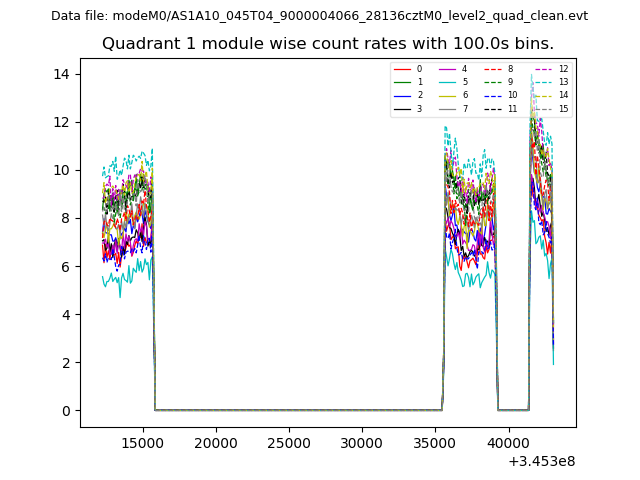
| Module-wise count rates for Quadrant A Data is divided into 100 sec bins |
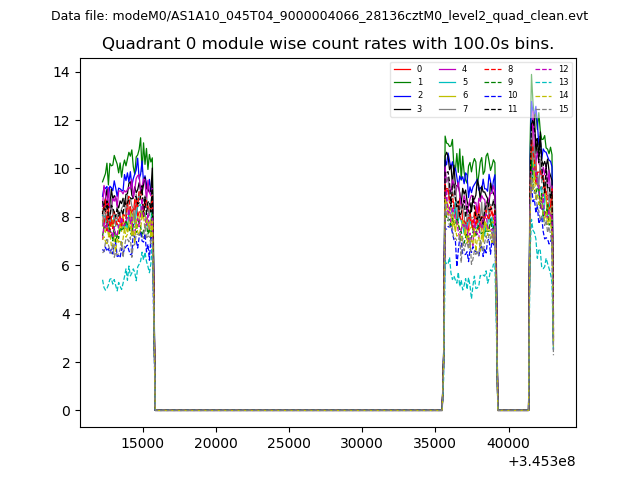 |
 |
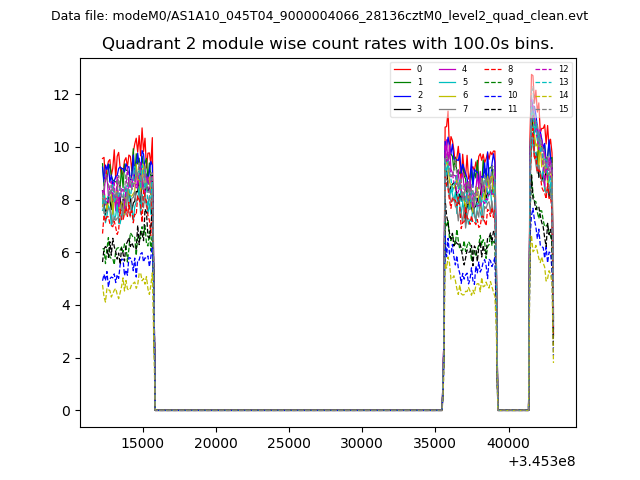
| Module-wise count rates for Quadrant B Data is divided into 100 sec bins |
 |
 |
| Module-wise count rates for Quadrant C Data is divided into 100 sec bins |
 |
 |
| Module-wise count rates for Quadrant D Data is divided into 100 sec bins |
 |
 |
| Parameter | Plot |
|---|---|
| CZT HV Monitor | 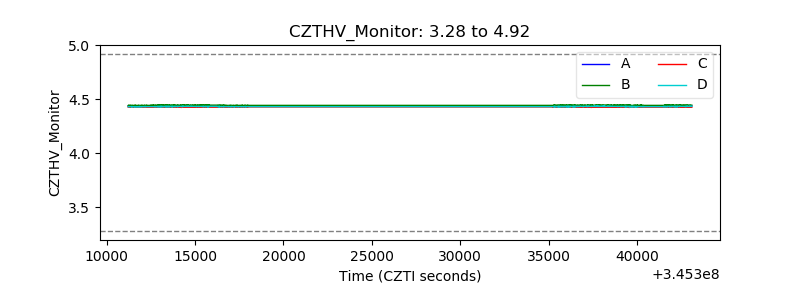 |
| D_VDD | 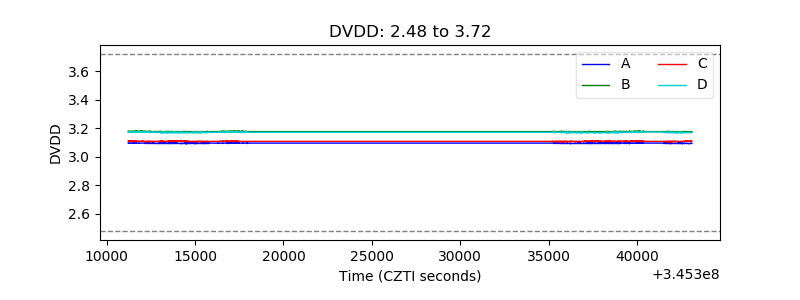 |
| Temperature 1 | 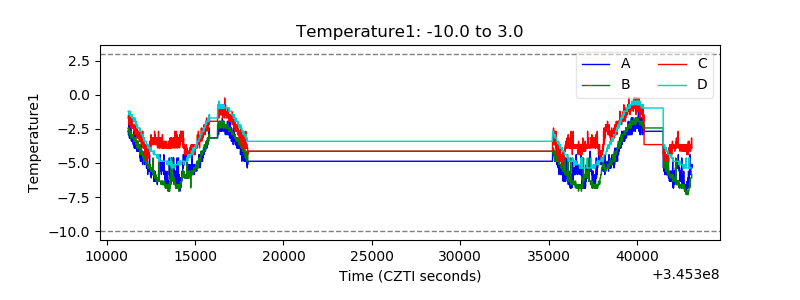 |
| Veto HV Monitor | 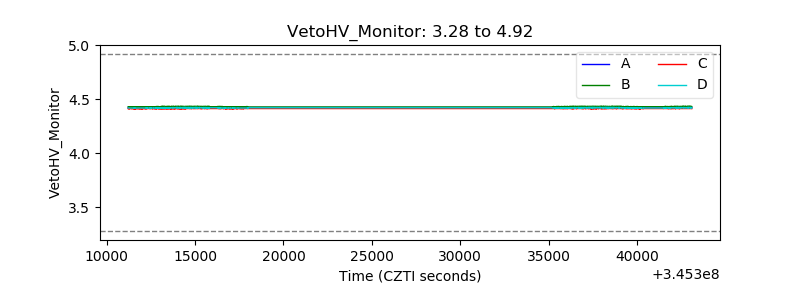 |
| Veto LLD | 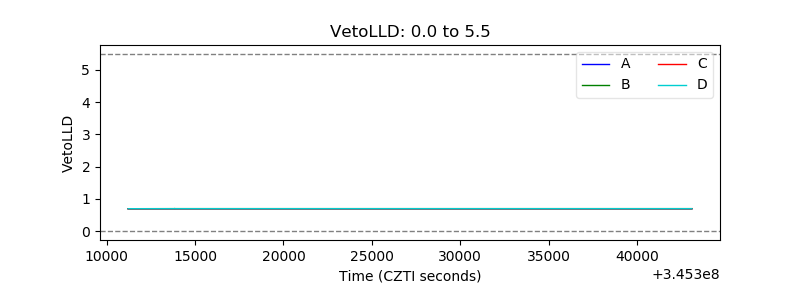 |
| Alpha Counter | 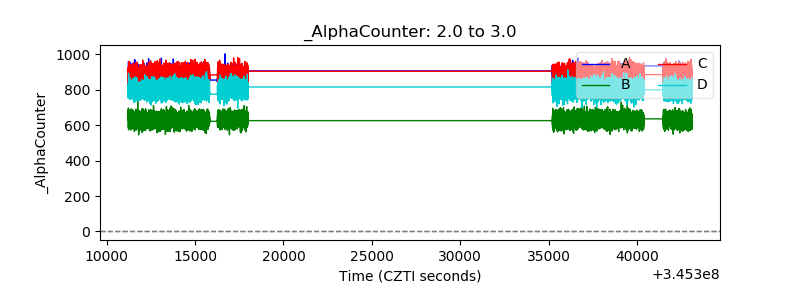 |
| _CPM_Rate | 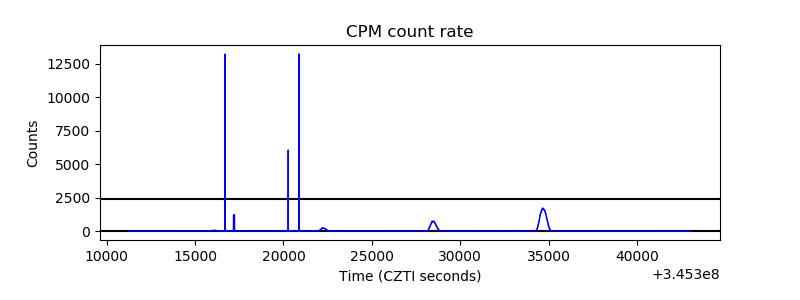 |
| CZT Counter | 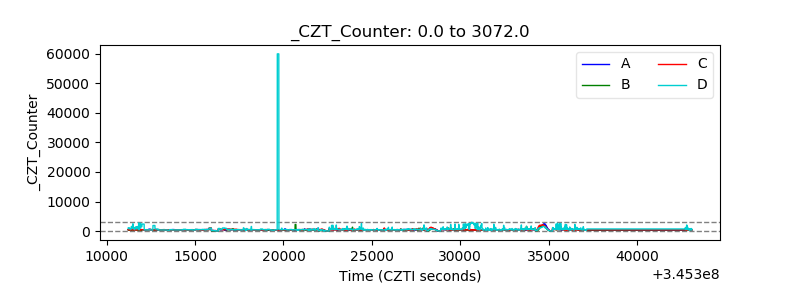 |
| +2.5 Volts monitor | 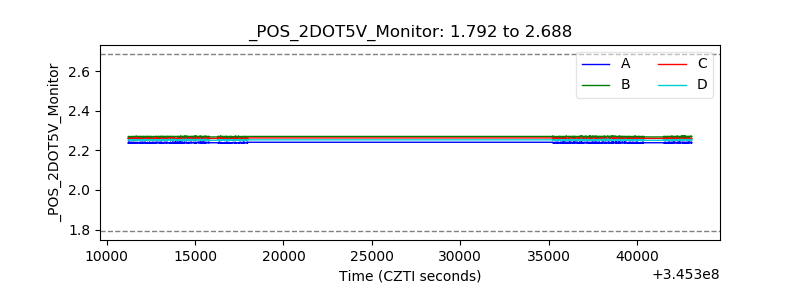 |
| +5 Volts monitor | 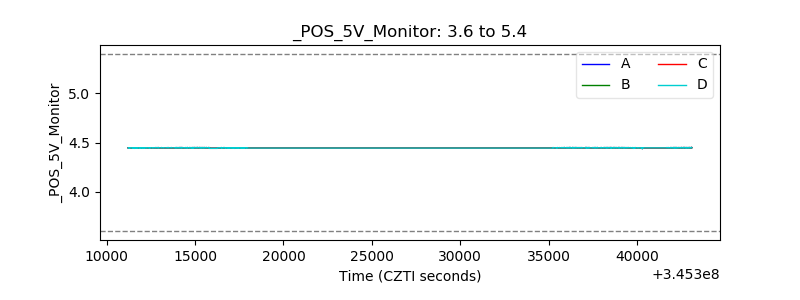 |
| _ROLL_ROT | 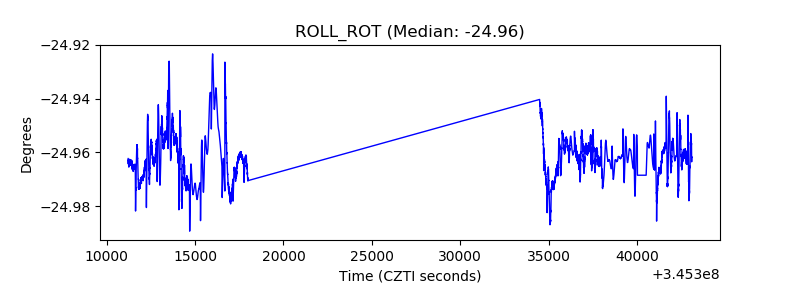 |
| _Roll_DEC | 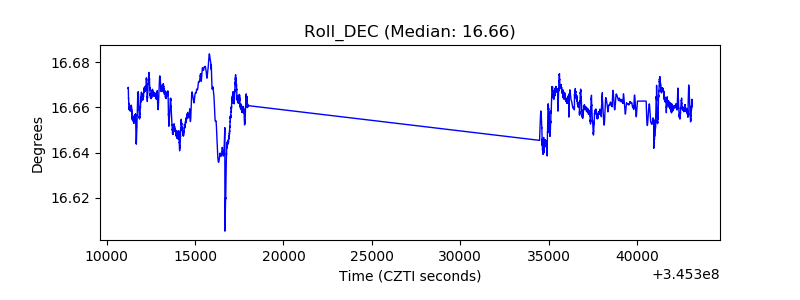 |
| _Roll_RA | 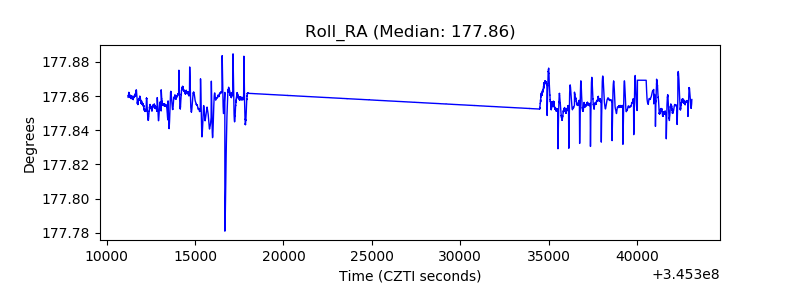 |
| Veto Counter | 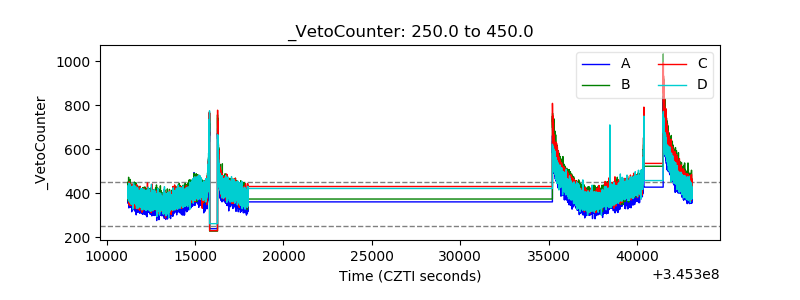 |