| Param | Original file | Final file |
|---|---|---|
| Filename | modeM0/AS1A10_045T04_9000004066_28137cztM0_level2.evt | modeM0/AS1A10_045T04_9000004066_28137cztM0_level2_quad_clean.evt |
| Size (bytes) | 2,181,948,480 | 404,205,120 |
| Size | 2.0 GB | 385.5 MB |
| Events in quadrant A | 13,792,590 | 2,625,141 |
| Events in quadrant B | 14,185,509 | 2,677,114 |
| Events in quadrant C | 14,077,424 | 2,542,802 |
| Events in quadrant D | 22,078,683 | 2,414,692 |
| Mode M0 | |||
|---|---|---|---|
| Quadrant | BADHDUFLAG | Total packets | Discarded packets |
| A | 0 | 59689 | 0 |
| B | 0 | 60954 | 0 |
| C | 0 | 60446 | 0 |
| D | 0 | 84929 | 0 |
| Mode M9 | |||
|---|---|---|---|
| Quadrant | BADHDUFLAG | Total packets | Discarded packets |
| A | 0 | 52 | 0 |
| B | 0 | 52 | 0 |
| C | 0 | 52 | 0 |
| D | 0 | 52 | 0 |
| Quadrant | Total seconds | Saturated seconds | Saturation percentage |
|---|---|---|---|
| A | 28862 | 206 | 0.713741% |
| B | 28862 | 295 | 1.022105% |
| C | 28863 | 387 | 1.340817% |
| D | 28862 | 1849 | 6.406347% |
Noise dominated data is calculated using 1-second bins in cleaned event files. If a bin has >2000 counts, and if more than 50% of those come from <1% of pixels, then it is considered to be noise-dominated and hence unusable.
| Quadrant | # 1 sec bins | Bins with >0 counts | Bins with >2000 counts | High rate bins dominated by noise | Noise dominated (total time) | Noise dominated (detector-on time) | Marked lightcurve |
|---|---|---|---|---|---|---|---|
| A | 33947 | 28866 | 1 | 1 | 0.00% | 0.00% |  |
| B | 33948 | 28864 | 4 | 4 | 0.01% | 0.01% |  |
| C | 33948 | 28866 | 8 | 8 | 0.02% | 0.03% |  |
| D | 33947 | 28865 | 1514 | 1514 | 4.46% | 5.25% | 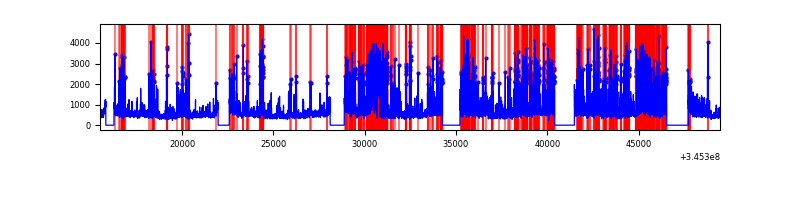 |
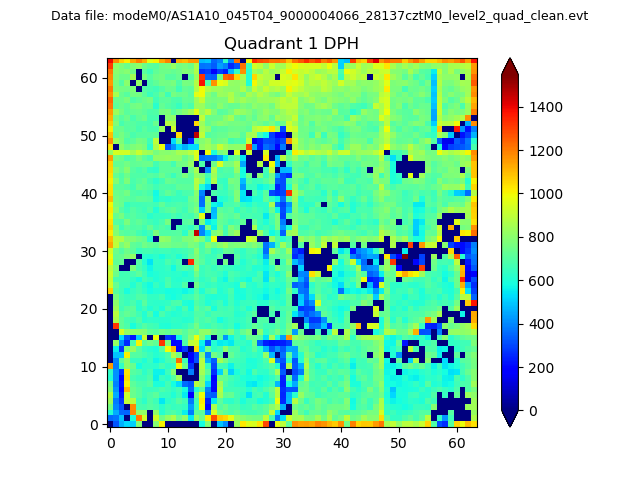
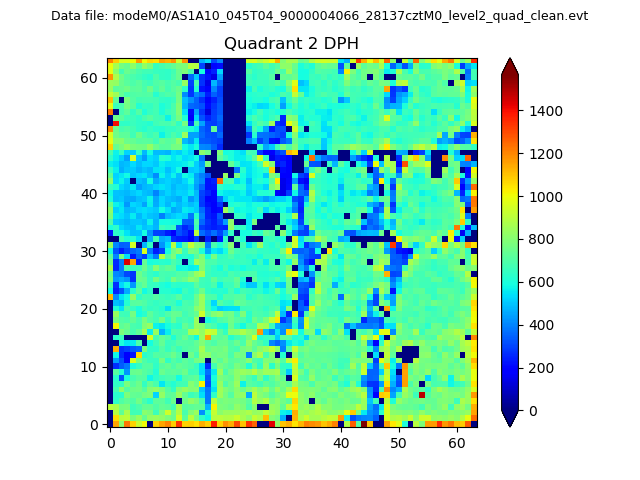
Top three noisy pixels from each quadrant. If the there are fewer than three noisy pixels in the level2.evt file, extra rows are filled as -1
| Pixel properties | Quadrant properties | ||||||
|---|---|---|---|---|---|---|---|
| Quadrant | DetID | PixID | Counts | Sigma | Mean | Median | Sigma |
| A | 0 | 13 | 67447 | 90.06 | 3552 | 3481 | 710.3 |
| A | 13 | 254 | 48791 | 63.79 | 3552 | 3481 | 710.3 |
| A | 3 | 137 | 34456 | 43.61 | 3552 | 3481 | 710.3 |
| B | 4 | 200 | 114946 | 167.6 | 3532 | 3442 | 665.3 |
| B | 12 | 111 | 84074 | 121.2 | 3532 | 3442 | 665.3 |
| B | 11 | 111 | 76310 | 109.53 | 3532 | 3442 | 665.3 |
| C | 14 | 238 | 547499 | 684.01 | 3402 | 3427 | 795.4 |
| C | 2 | 16 | 196618 | 242.88 | 3402 | 3427 | 795.4 |
| C | 3 | 233 | 83315 | 100.44 | 3402 | 3427 | 795.4 |
| D | 1 | 52 | 4992160 | 6287.27 | 3346 | 3263 | 793.5 |
| D | 5 | 222 | 1941879 | 2443.14 | 3346 | 3263 | 793.5 |
| D | 8 | 195 | 1098400 | 1380.15 | 3346 | 3263 | 793.5 |
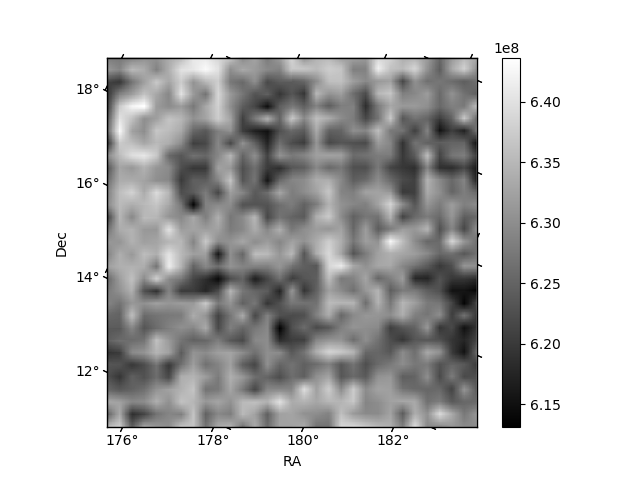
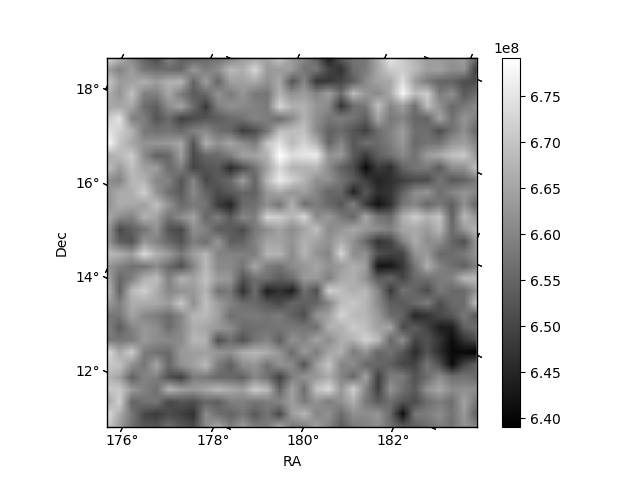
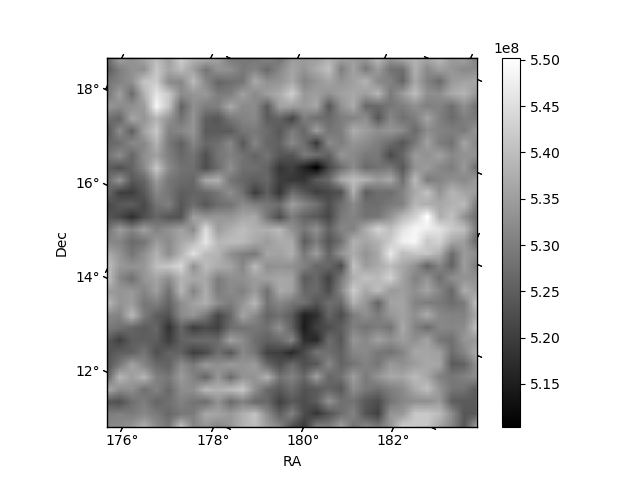
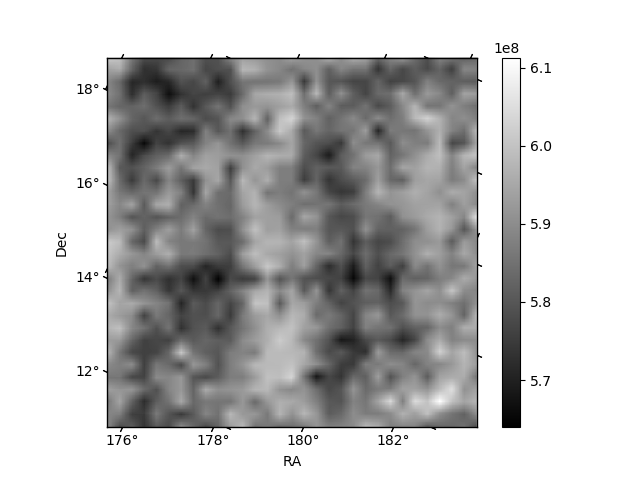
Histogram calculated using DETX and DETY for each event in the final _common_clean file
| Quadrant A | 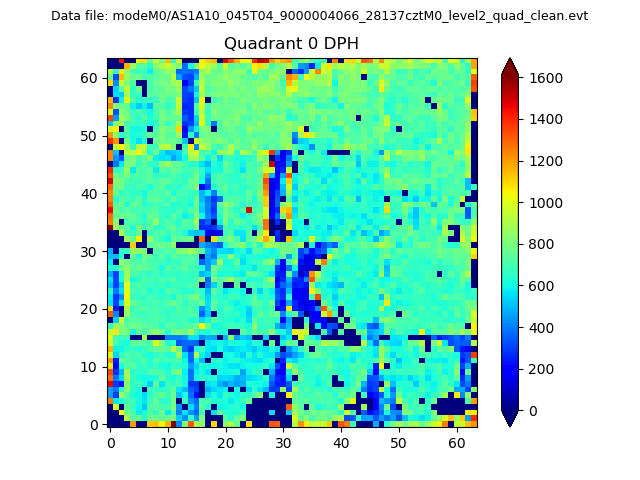 |
 |
Quadrant B |
|---|---|---|---|
| Quadrant D | 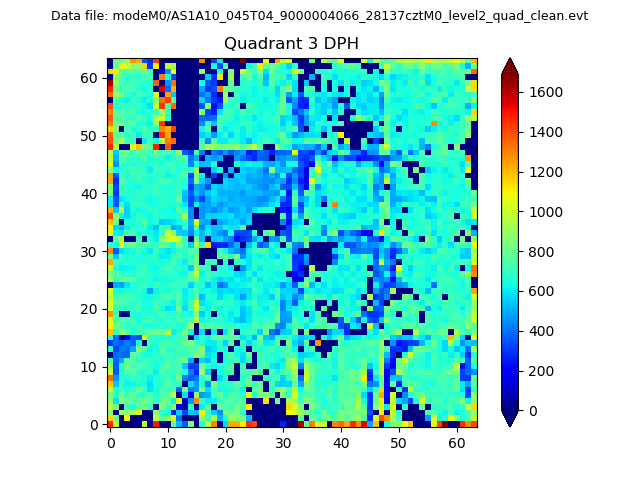 |
 |
Quadrant C |
| Plot type | Count rate plots | Images |
|---|---|---|
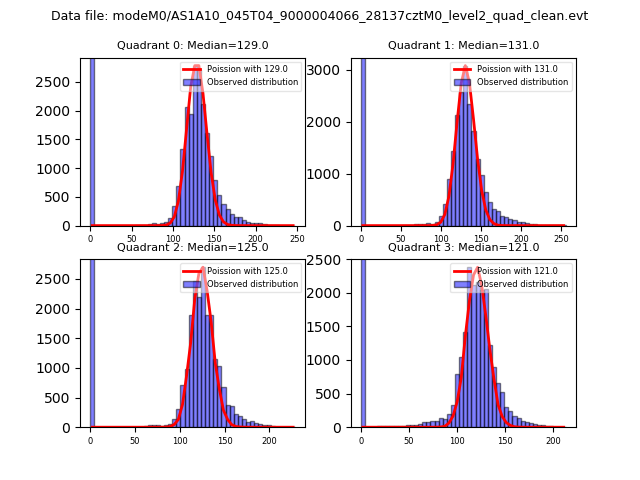
| Comparison with Poisson distribution Blue bars denote a histogram of data divided into 1 sec bins. Red curve is a Poisson curve with rate = median count rate of data. |
 |
 |
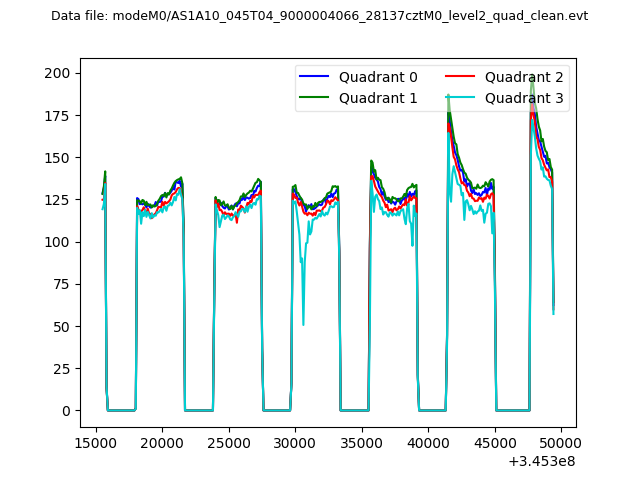
| Quadrant-wise count rates Data is divided into 100 sec bins |
 |
|
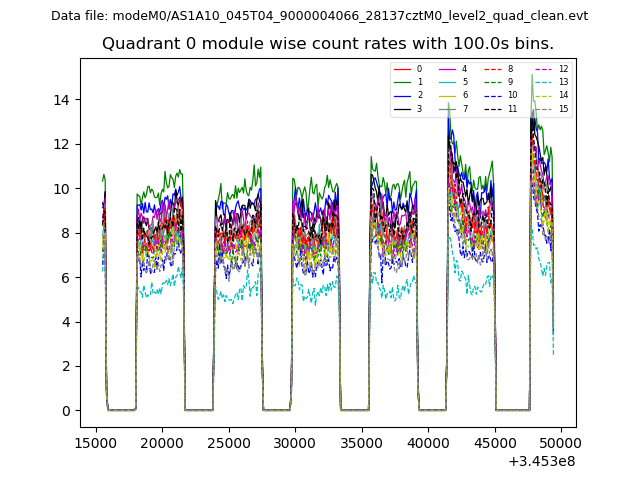
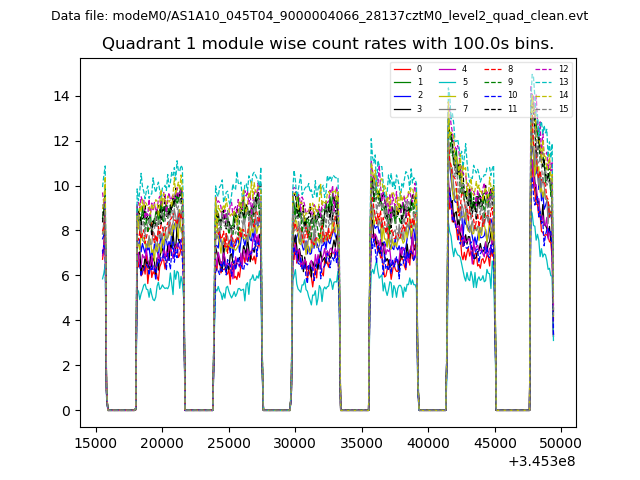
| Module-wise count rates for Quadrant A Data is divided into 100 sec bins |
 |
 |
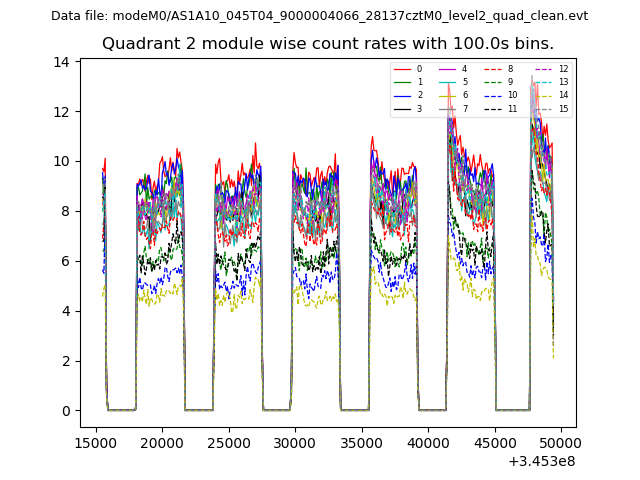
| Module-wise count rates for Quadrant B Data is divided into 100 sec bins |
 |
 |
| Module-wise count rates for Quadrant C Data is divided into 100 sec bins |
 |
 |
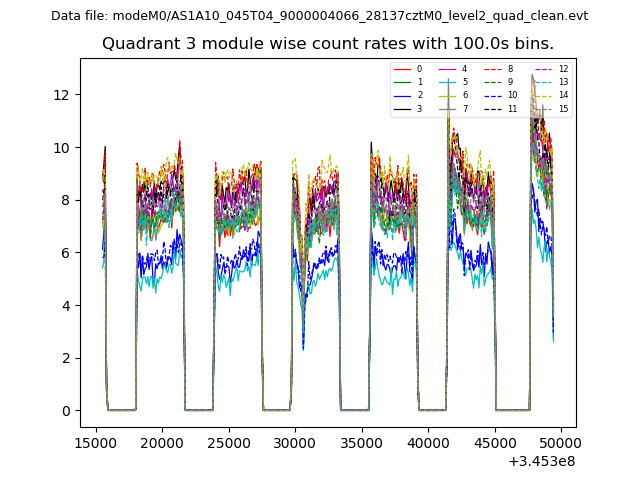
| Module-wise count rates for Quadrant D Data is divided into 100 sec bins |
 |
 |
| Parameter | Plot |
|---|---|
| CZT HV Monitor | 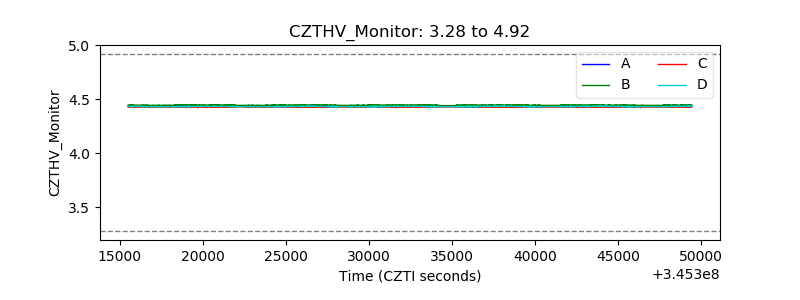 |
| D_VDD | 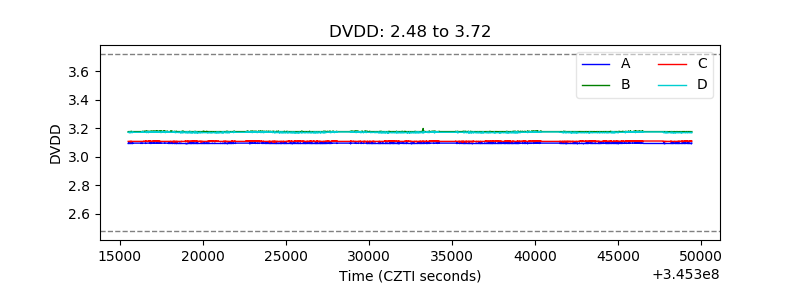 |
| Temperature 1 | 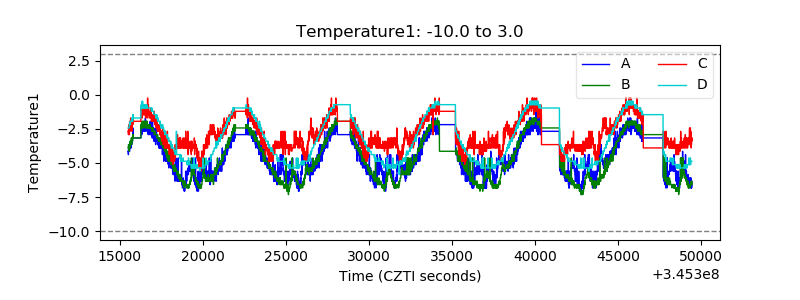 |
| Veto HV Monitor |  |
| Veto LLD | 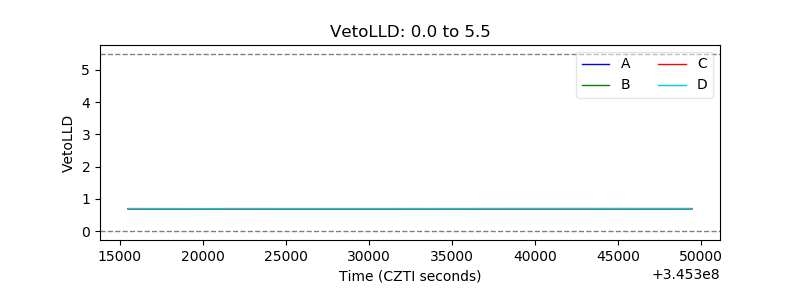 |
| Alpha Counter | 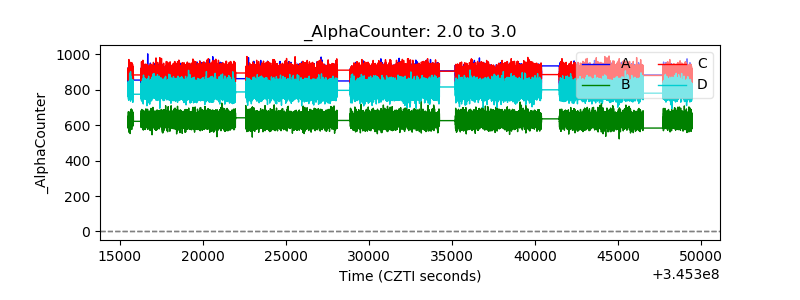 |
| _CPM_Rate | 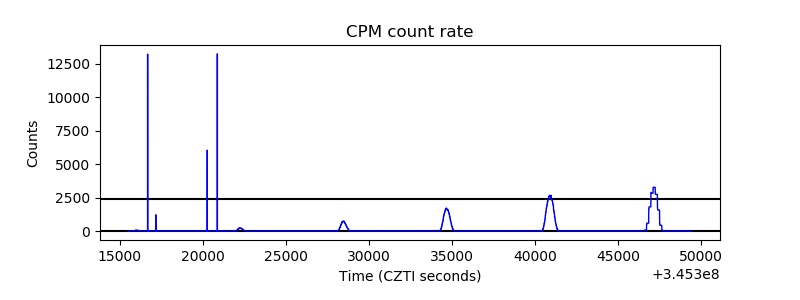 |
| CZT Counter | 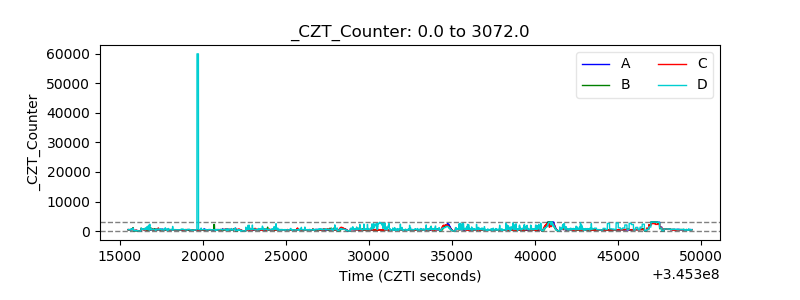 |
| +2.5 Volts monitor |  |
| +5 Volts monitor |  |
| _ROLL_ROT | 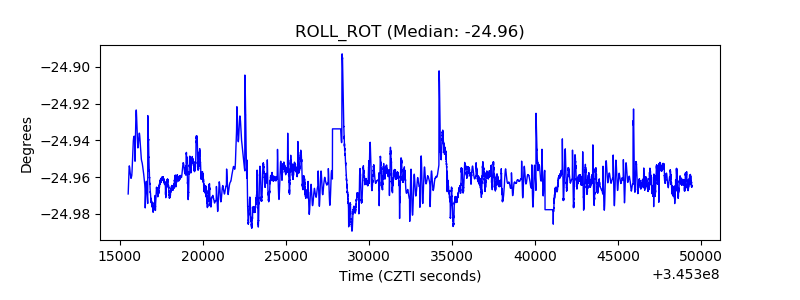 |
| _Roll_DEC | 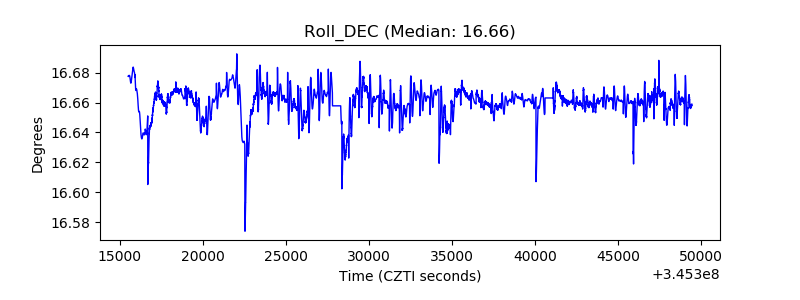 |
| _Roll_RA | 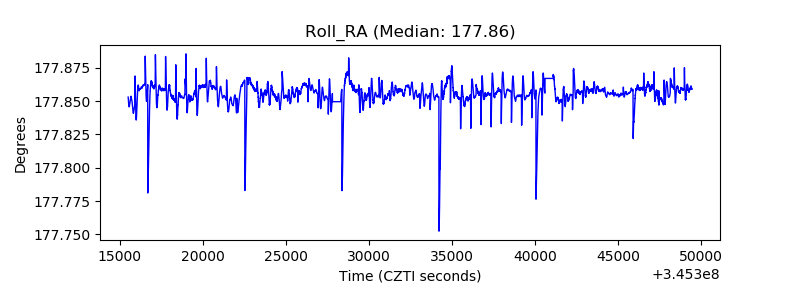 |
| Veto Counter | 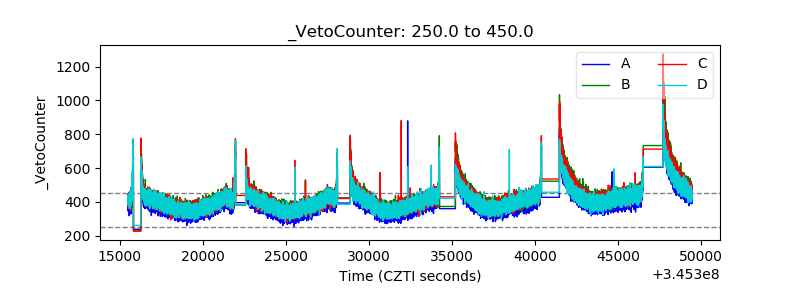 |