| Param | Original file | Final file |
|---|---|---|
| Filename | modeM0/AS1A10_045T04_9000004066_28138cztM0_level2.evt | modeM0/AS1A10_045T04_9000004066_28138cztM0_level2_quad_clean.evt |
| Size (bytes) | 540,823,680 | 110,998,080 |
| Size | 515.8 MB | 105.9 MB |
| Events in quadrant A | 3,507,338 | 739,579 |
| Events in quadrant B | 3,477,155 | 770,019 |
| Events in quadrant C | 3,411,274 | 717,478 |
| Events in quadrant D | 5,534,922 | 673,613 |
| Mode M0 | |||
|---|---|---|---|
| Quadrant | BADHDUFLAG | Total packets | Discarded packets |
| A | 0 | 14455 | 0 |
| B | 0 | 14328 | 0 |
| C | 0 | 14141 | 0 |
| D | 0 | 20791 | 0 |
| Mode M9 | |||
|---|---|---|---|
| Quadrant | BADHDUFLAG | Total packets | Discarded packets |
| A | 0 | 18 | 0 |
| B | 0 | 19 | 0 |
| C | 0 | 19 | 0 |
| D | 0 | 19 | 0 |
| Quadrant | Total seconds | Saturated seconds | Saturation percentage |
|---|---|---|---|
| A | 6611 | 61 | 0.922705% |
| B | 6611 | 63 | 0.952957% |
| C | 6611 | 89 | 1.346241% |
| D | 6611 | 563 | 8.516110% |
Noise dominated data is calculated using 1-second bins in cleaned event files. If a bin has >2000 counts, and if more than 50% of those come from <1% of pixels, then it is considered to be noise-dominated and hence unusable.
| Quadrant | # 1 sec bins | Bins with >0 counts | Bins with >2000 counts | High rate bins dominated by noise | Noise dominated (total time) | Noise dominated (detector-on time) | Marked lightcurve |
|---|---|---|---|---|---|---|---|
| A | 7881 | 6612 | 14 | 14 | 0.18% | 0.21% | 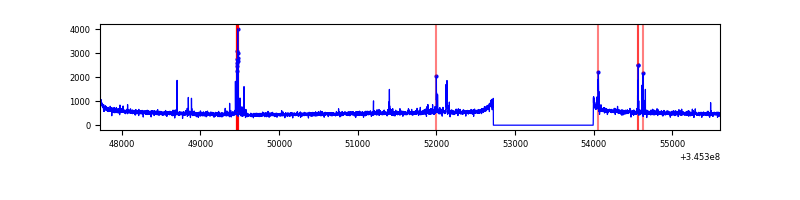 |
| B | 7881 | 6612 | 4 | 4 | 0.05% | 0.06% | 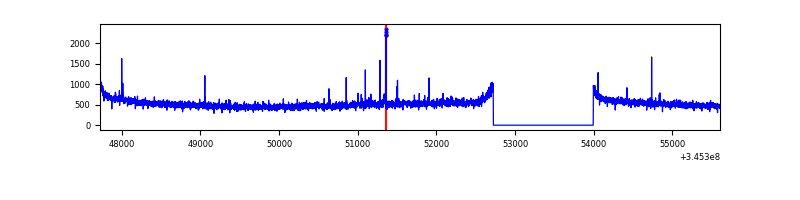 |
| C | 7881 | 6612 | 0 | 0 | 0.00% | 0.00% |  |
| D | 7881 | 6612 | 472 | 472 | 5.99% | 7.14% | 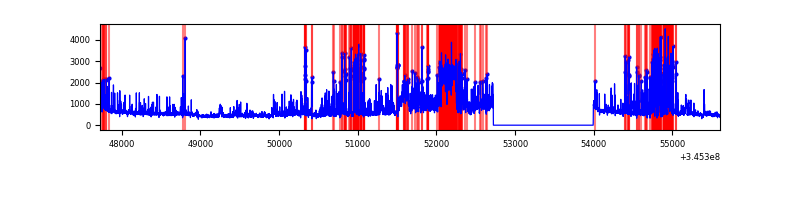 |
Top three noisy pixels from each quadrant. If the there are fewer than three noisy pixels in the level2.evt file, extra rows are filled as -1
| Pixel properties | Quadrant properties | ||||||
|---|---|---|---|---|---|---|---|
| Quadrant | DetID | PixID | Counts | Sigma | Mean | Median | Sigma |
| A | 4 | 2 | 84398 | 481.02 | 871 | 858 | 173.7 |
| A | 12 | 16 | 43931 | 248.01 | 871 | 858 | 173.7 |
| A | 12 | 194 | 12711 | 68.25 | 871 | 858 | 173.7 |
| B | 0 | 183 | 21386 | 125.7 | 875 | 854 | 163.3 |
| B | 12 | 111 | 19693 | 115.34 | 875 | 854 | 163.3 |
| B | 11 | 111 | 17503 | 101.93 | 875 | 854 | 163.3 |
| C | 14 | 238 | 137033 | 701.64 | 836 | 842 | 194.1 |
| C | 1 | 16 | 7905 | 36.39 | 836 | 842 | 194.1 |
| C | 3 | 233 | 7511 | 34.36 | 836 | 842 | 194.1 |
| D | 1 | 52 | 1523522 | 8147.63 | 793 | 770 | 186.9 |
| D | 2 | 250 | 569589 | 3043.52 | 793 | 770 | 186.9 |
| D | 8 | 195 | 311335 | 1661.71 | 793 | 770 | 186.9 |
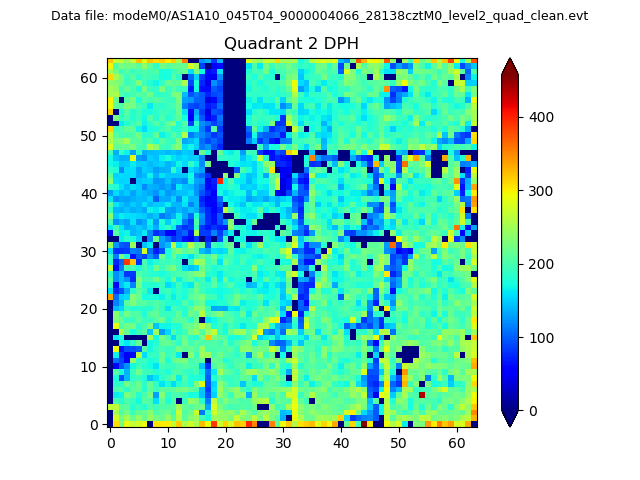
Histogram calculated using DETX and DETY for each event in the final _common_clean file
| Quadrant A |  |
 |
Quadrant B |
|---|---|---|---|
| Quadrant D |  |
 |
Quadrant C |
| Plot type | Count rate plots | Images |
|---|---|---|
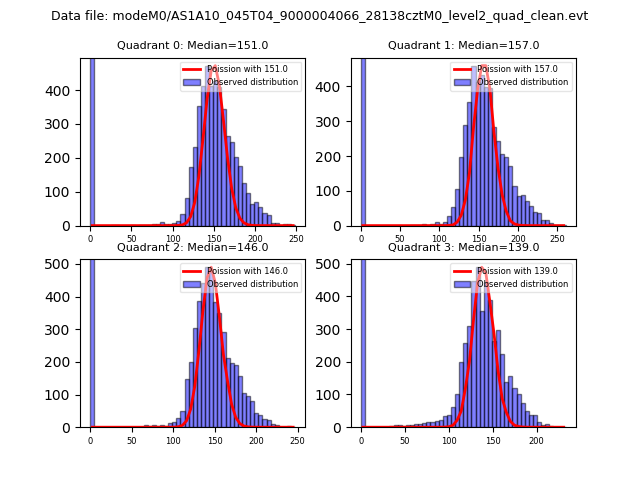
| Comparison with Poisson distribution Blue bars denote a histogram of data divided into 1 sec bins. Red curve is a Poisson curve with rate = median count rate of data. |
 |
 |
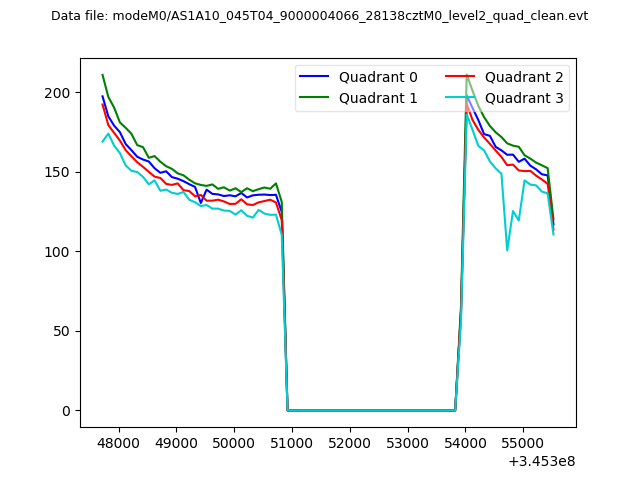
| Quadrant-wise count rates Data is divided into 100 sec bins |
 |
|
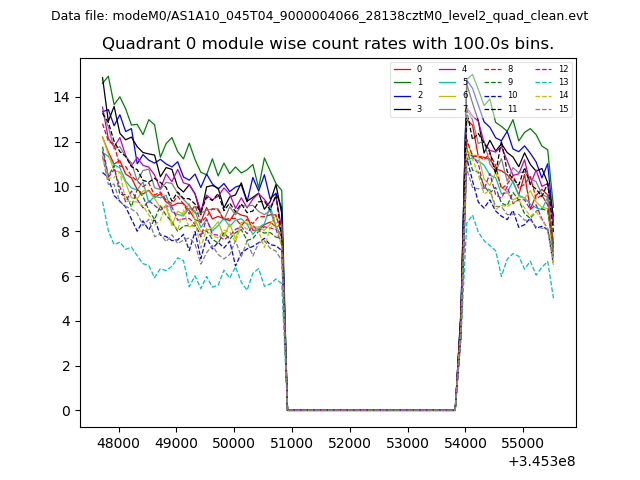
| Module-wise count rates for Quadrant A Data is divided into 100 sec bins |
 |
 |
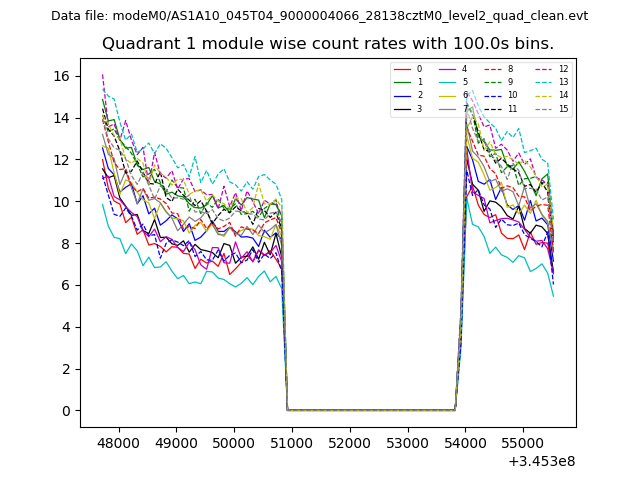
| Module-wise count rates for Quadrant B Data is divided into 100 sec bins |
 |
 |
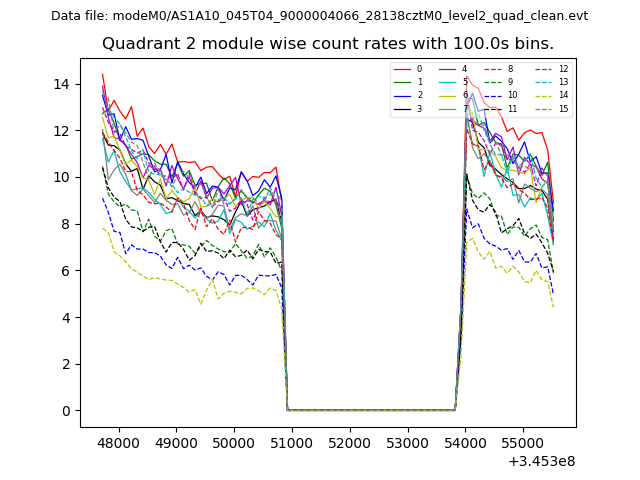
| Module-wise count rates for Quadrant C Data is divided into 100 sec bins |
 |
 |
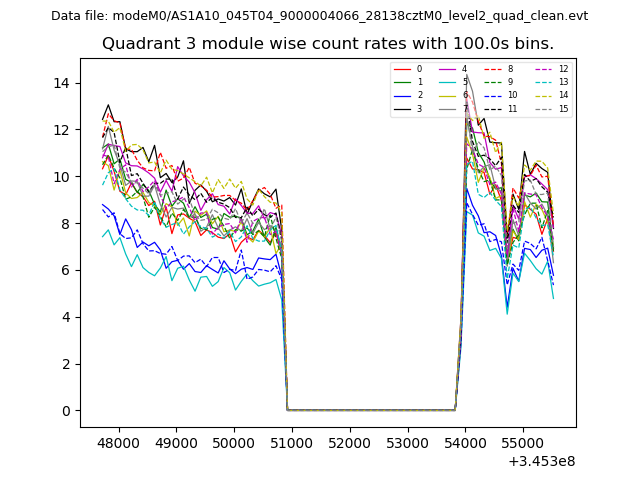
| Module-wise count rates for Quadrant D Data is divided into 100 sec bins |
 |
 |
| Parameter | Plot |
|---|---|
| CZT HV Monitor | 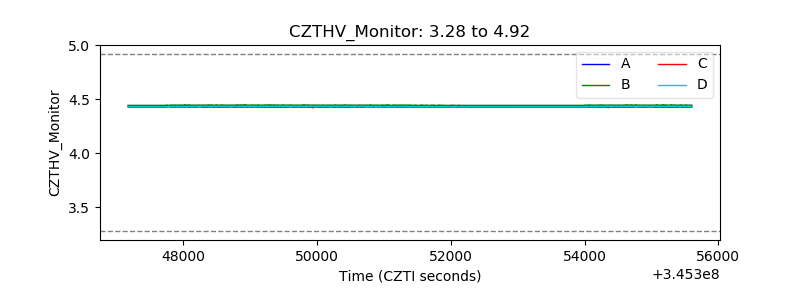 |
| D_VDD | 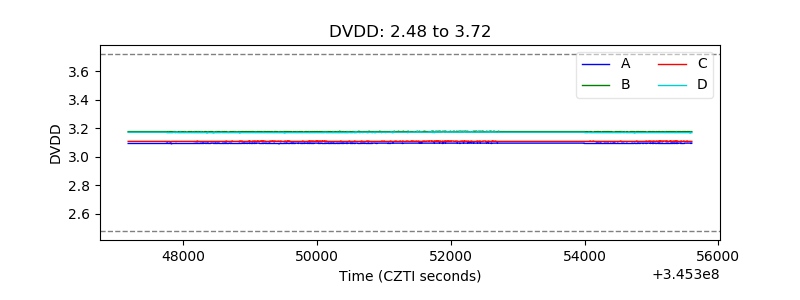 |
| Temperature 1 | 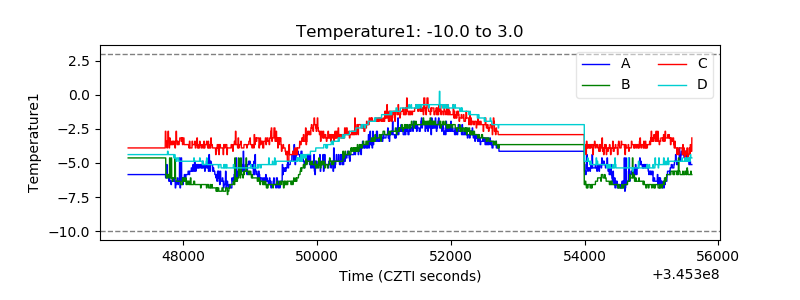 |
| Veto HV Monitor | 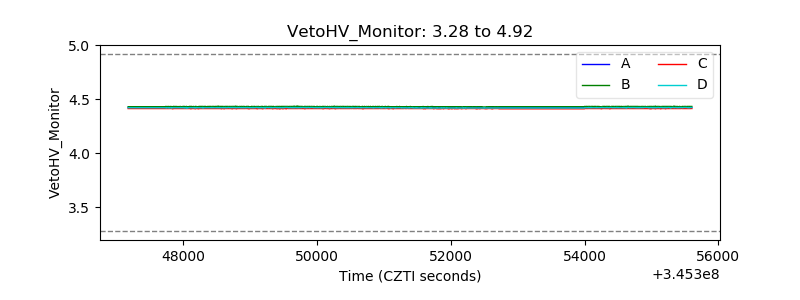 |
| Veto LLD | 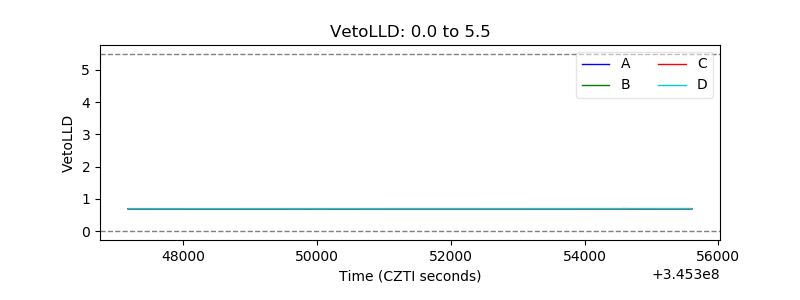 |
| Alpha Counter | 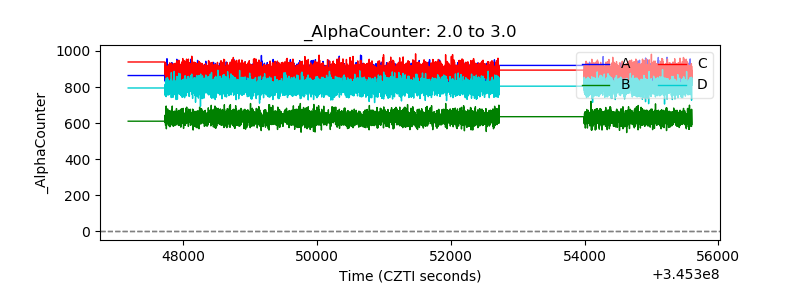 |
| _CPM_Rate | 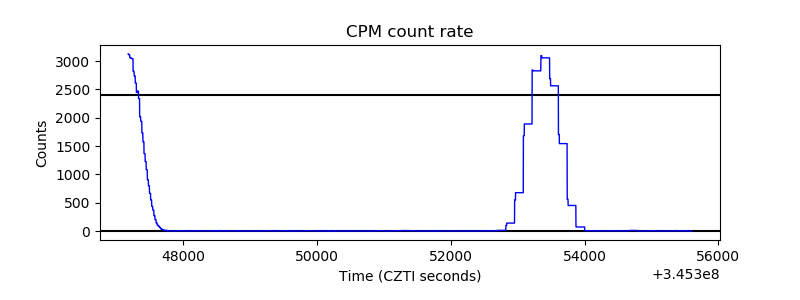 |
| CZT Counter | 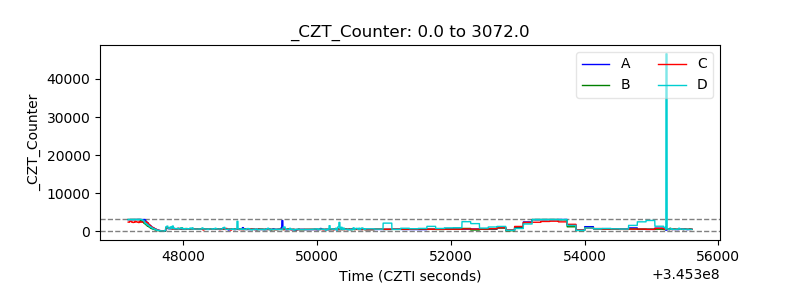 |
| +2.5 Volts monitor |  |
| +5 Volts monitor | 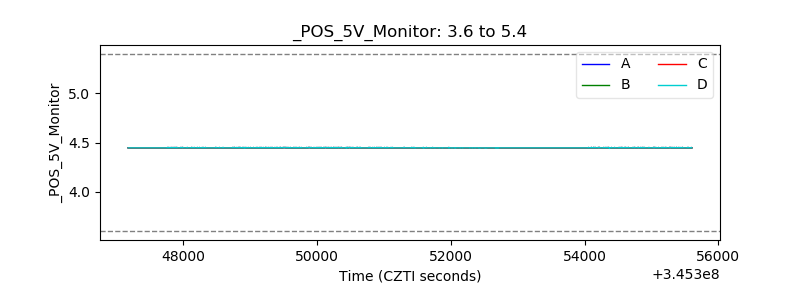 |
| _ROLL_ROT | 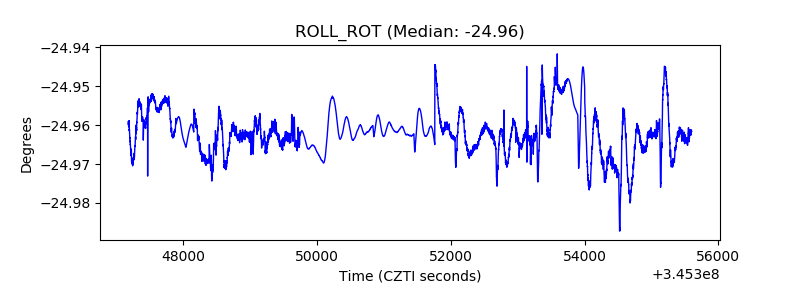 |
| _Roll_DEC | 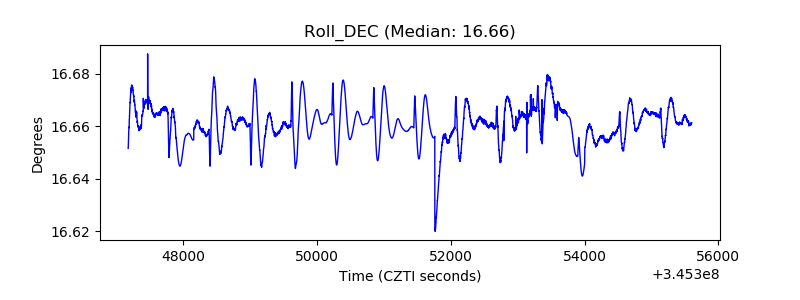 |
| _Roll_RA | 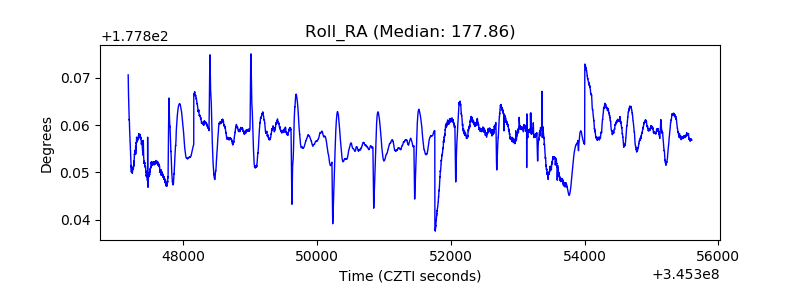 |
| Veto Counter | 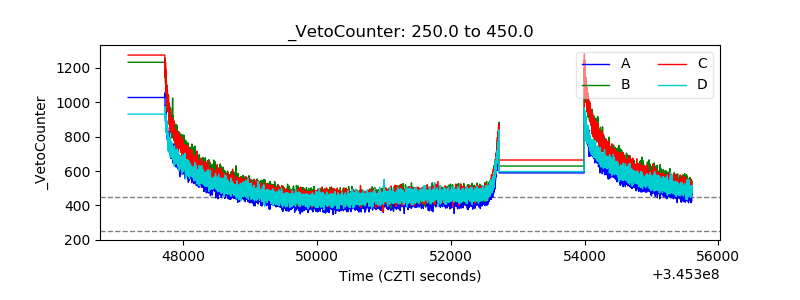 |