| Param | Original file | Final file |
|---|---|---|
| Filename | modeM0/AS1A10_045T04_9000004066_28139cztM0_level2.evt | modeM0/AS1A10_045T04_9000004066_28139cztM0_level2_quad_clean.evt |
| Size (bytes) | 478,575,360 | 88,067,520 |
| Size | 456.4 MB | 84.0 MB |
| Events in quadrant A | 3,047,656 | 575,000 |
| Events in quadrant B | 3,285,775 | 597,111 |
| Events in quadrant C | 3,087,185 | 559,227 |
| Events in quadrant D | 4,673,174 | 523,672 |
| Mode M0 | |||
|---|---|---|---|
| Quadrant | BADHDUFLAG | Total packets | Discarded packets |
| A | 0 | 12456 | 0 |
| B | 0 | 13337 | 0 |
| C | 0 | 12563 | 0 |
| D | 0 | 17685 | 0 |
| Mode M9 | |||
|---|---|---|---|
| Quadrant | BADHDUFLAG | Total packets | Discarded packets |
| A | 0 | 13 | 0 |
| B | 0 | 13 | 0 |
| C | 0 | 13 | 0 |
| D | 0 | 13 | 0 |
| Quadrant | Total seconds | Saturated seconds | Saturation percentage |
|---|---|---|---|
| A | 5896 | 40 | 0.678426% |
| B | 5896 | 53 | 0.898915% |
| C | 5896 | 71 | 1.204206% |
| D | 5896 | 296 | 5.020353% |
Noise dominated data is calculated using 1-second bins in cleaned event files. If a bin has >2000 counts, and if more than 50% of those come from <1% of pixels, then it is considered to be noise-dominated and hence unusable.
| Quadrant | # 1 sec bins | Bins with >0 counts | Bins with >2000 counts | High rate bins dominated by noise | Noise dominated (total time) | Noise dominated (detector-on time) | Marked lightcurve |
|---|---|---|---|---|---|---|---|
| A | 7206 | 5897 | 3 | 3 | 0.04% | 0.05% | 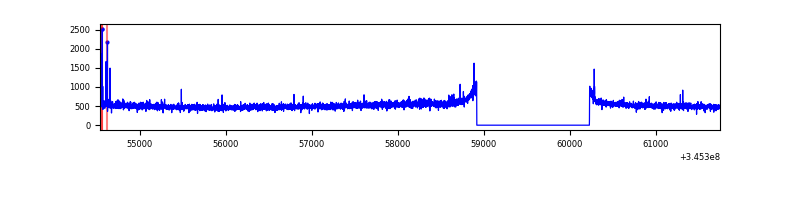 |
| B | 7206 | 5897 | 1 | 1 | 0.01% | 0.02% | 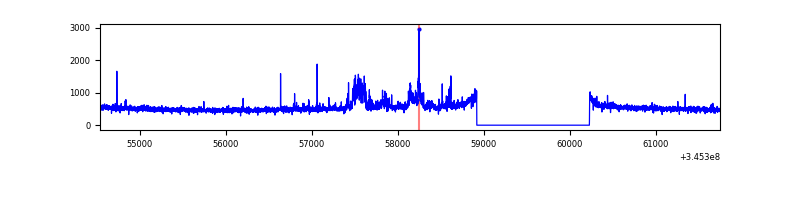 |
| C | 7206 | 5897 | 0 | 0 | 0.00% | 0.00% | 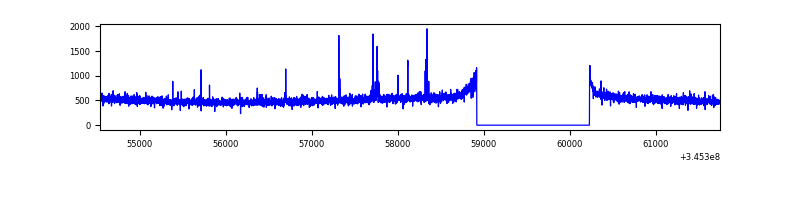 |
| D | 7206 | 5897 | 247 | 247 | 3.43% | 4.19% | 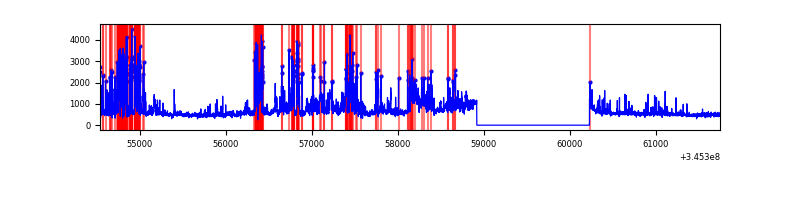 |
Top three noisy pixels from each quadrant. If the there are fewer than three noisy pixels in the level2.evt file, extra rows are filled as -1
| Pixel properties | Quadrant properties | ||||||
|---|---|---|---|---|---|---|---|
| Quadrant | DetID | PixID | Counts | Sigma | Mean | Median | Sigma |
| A | 4 | 2 | 29296 | 185.0 | 776 | 762 | 154.2 |
| A | 0 | 13 | 20066 | 125.16 | 776 | 762 | 154.2 |
| A | 13 | 254 | 10690 | 64.37 | 776 | 762 | 154.2 |
| B | 15 | 32 | 184799 | 1280.4 | 774 | 758 | 143.7 |
| B | 10 | 245 | 35862 | 244.22 | 774 | 758 | 143.7 |
| B | 10 | 246 | 17749 | 118.21 | 774 | 758 | 143.7 |
| C | 14 | 238 | 122944 | 706.28 | 744 | 752 | 173.0 |
| C | 2 | 16 | 46901 | 266.75 | 744 | 752 | 173.0 |
| C | 3 | 233 | 11206 | 60.43 | 744 | 752 | 173.0 |
| D | 1 | 52 | 1543230 | 8935.78 | 730 | 712 | 172.6 |
| D | 8 | 195 | 240170 | 1387.17 | 730 | 712 | 172.6 |
| D | 2 | 250 | 67343 | 385.99 | 730 | 712 | 172.6 |
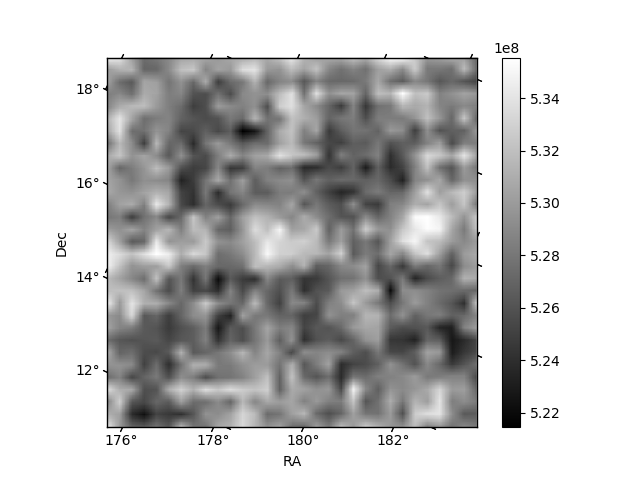
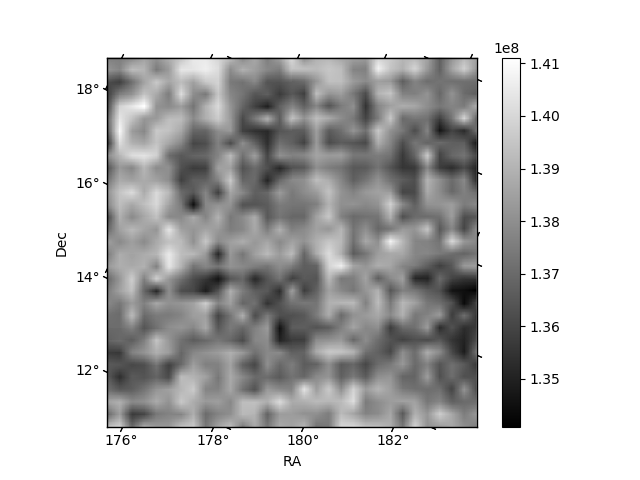
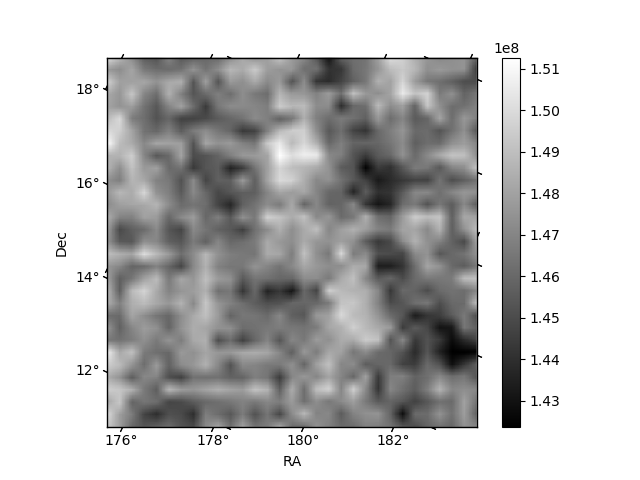
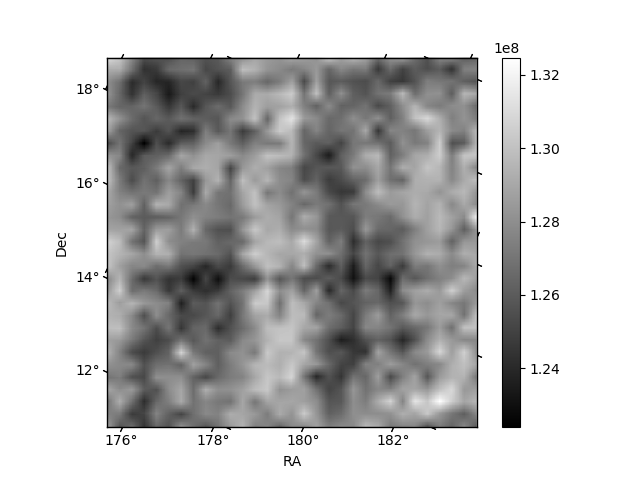
Histogram calculated using DETX and DETY for each event in the final _common_clean file
| Quadrant A | 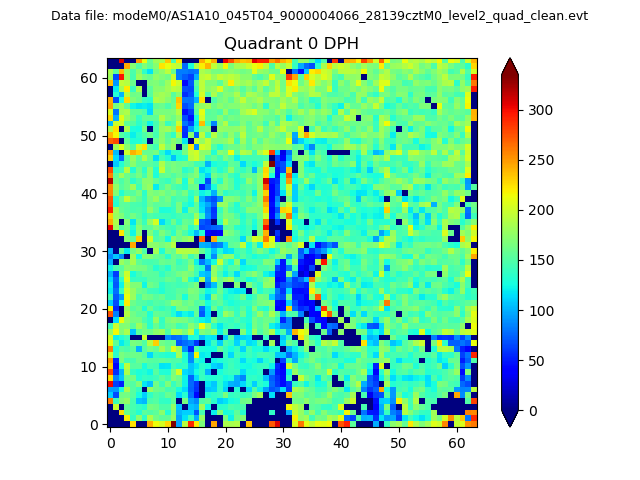 |
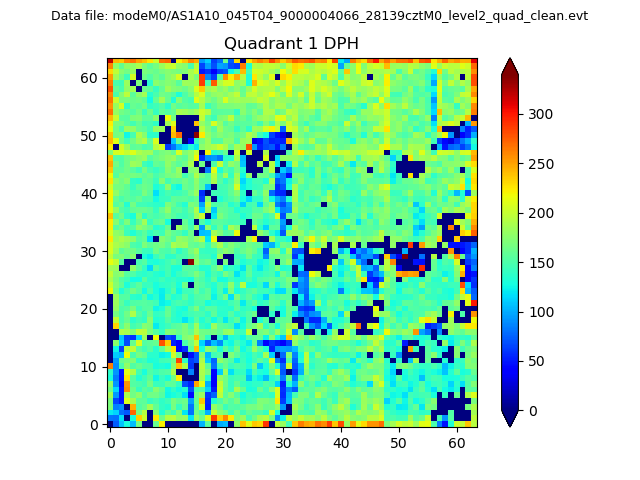 |
Quadrant B |
|---|---|---|---|
| Quadrant D | 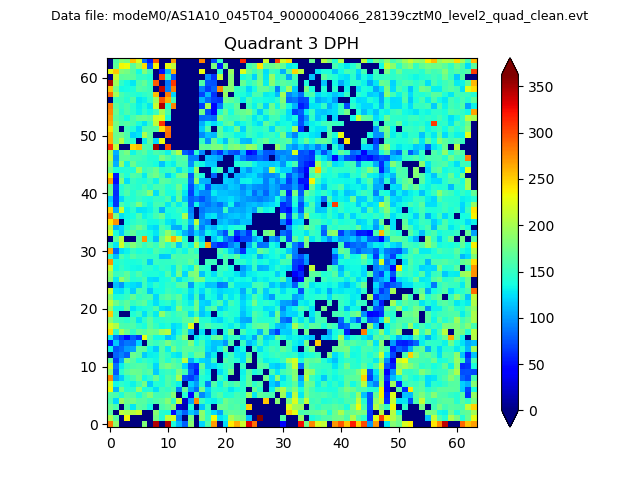 |
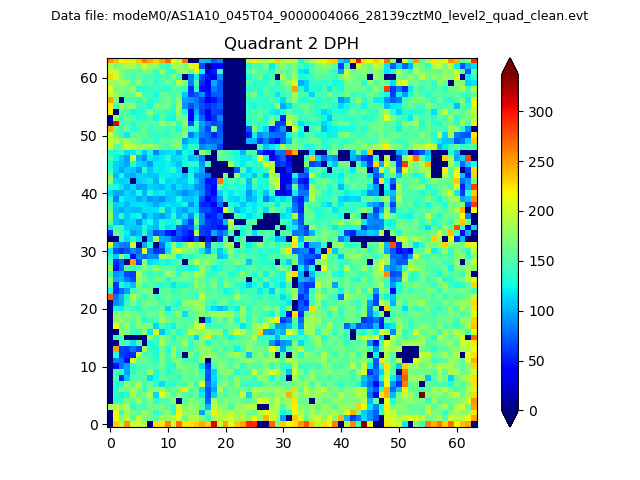 |
Quadrant C |
| Plot type | Count rate plots | Images |
|---|---|---|
| Comparison with Poisson distribution Blue bars denote a histogram of data divided into 1 sec bins. Red curve is a Poisson curve with rate = median count rate of data. |
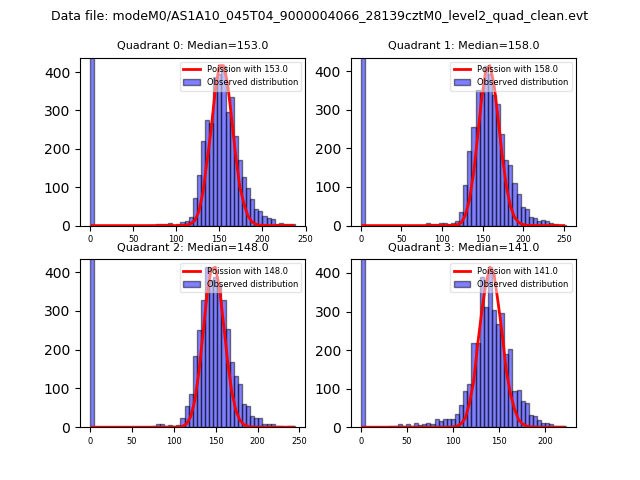 |
 |
| Quadrant-wise count rates Data is divided into 100 sec bins |
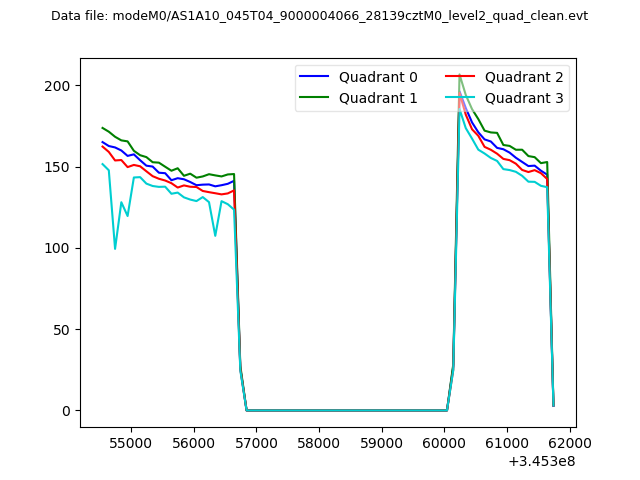 |
|
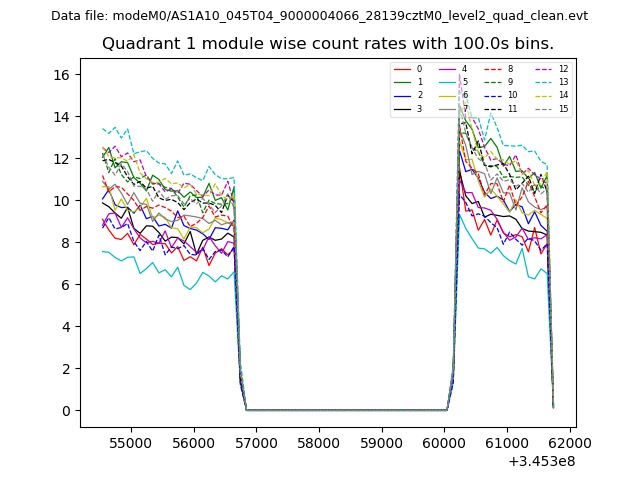
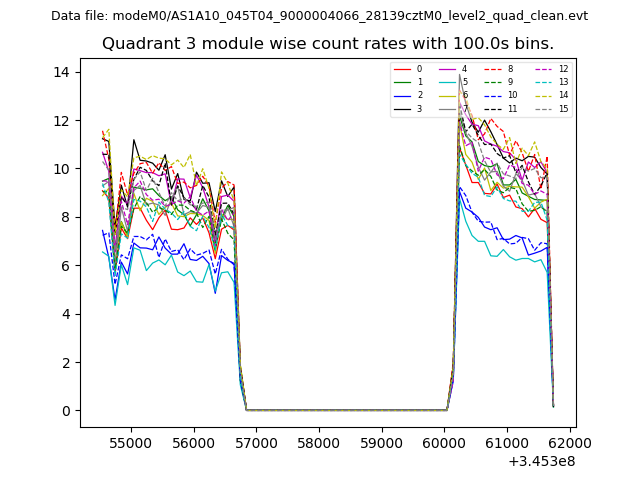
| Module-wise count rates for Quadrant A Data is divided into 100 sec bins |
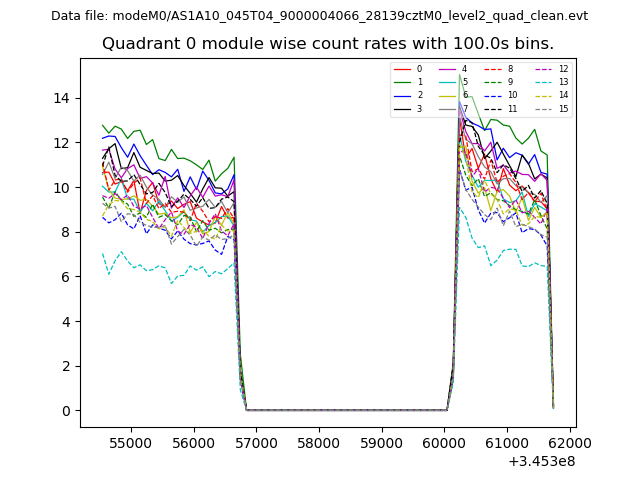 |
 |
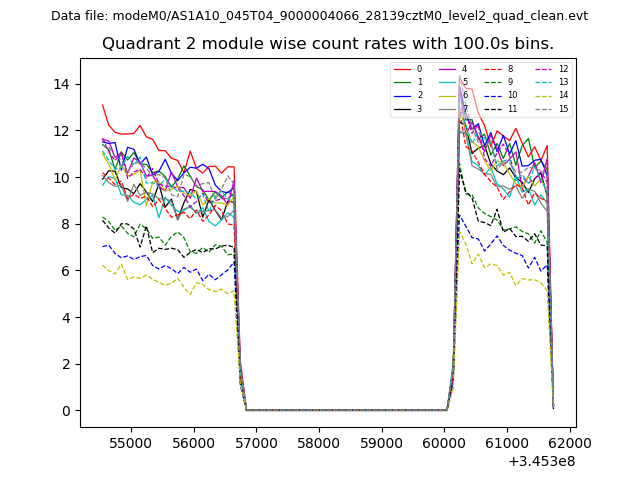
| Module-wise count rates for Quadrant B Data is divided into 100 sec bins |
 |
 |
| Module-wise count rates for Quadrant C Data is divided into 100 sec bins |
 |
 |
| Module-wise count rates for Quadrant D Data is divided into 100 sec bins |
 |
 |
| Parameter | Plot |
|---|---|
| CZT HV Monitor | 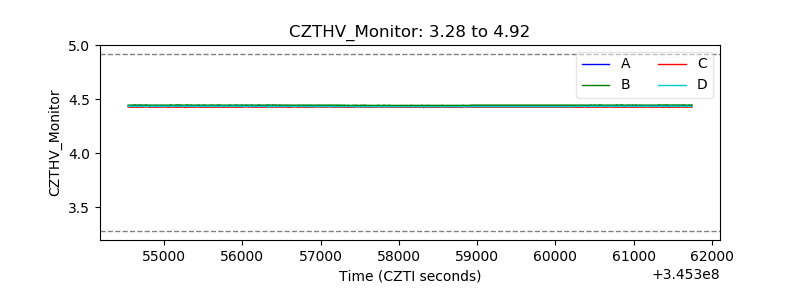 |
| D_VDD | 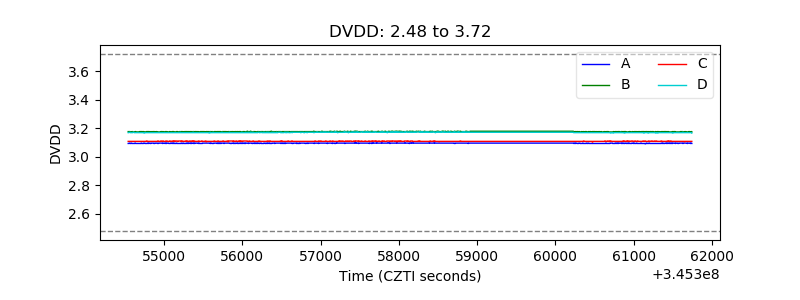 |
| Temperature 1 | 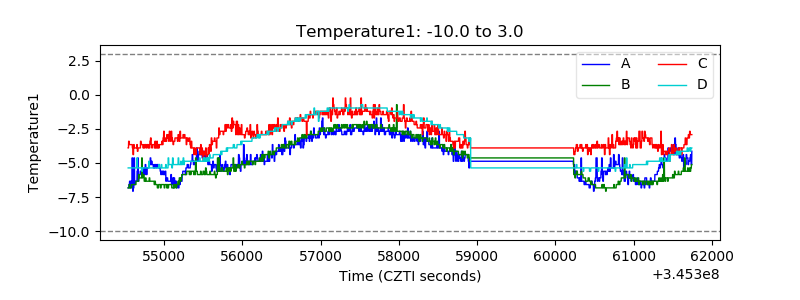 |
| Veto HV Monitor | 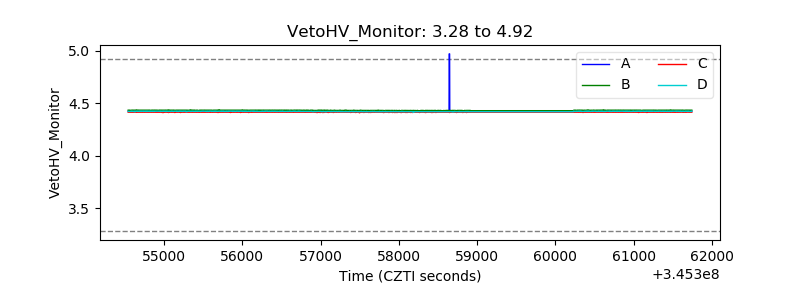 |
| Veto LLD | 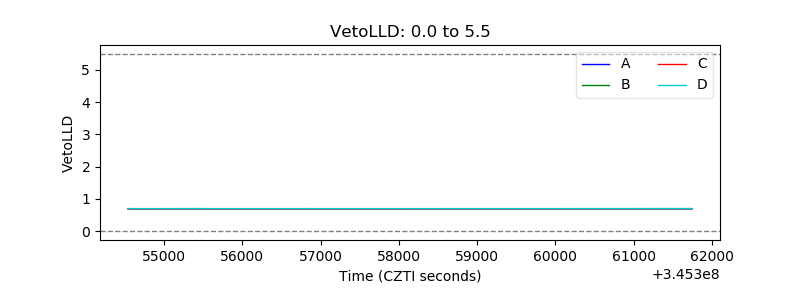 |
| Alpha Counter | 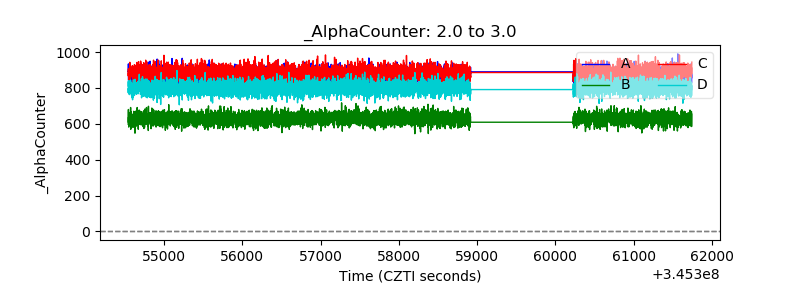 |
| _CPM_Rate | 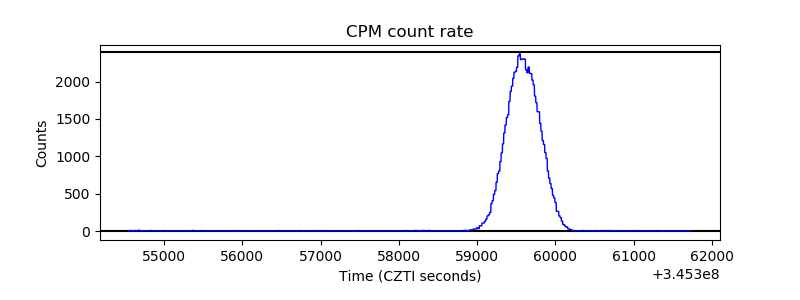 |
| CZT Counter | 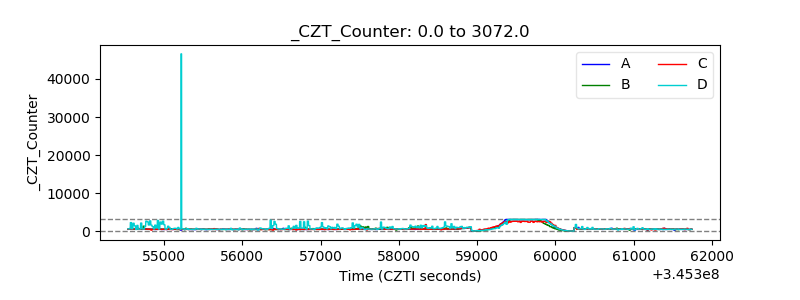 |
| +2.5 Volts monitor | 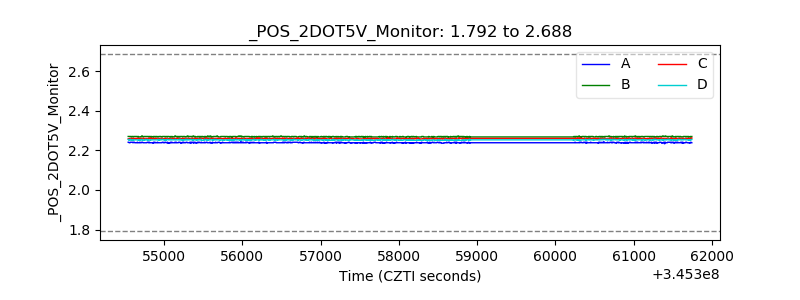 |
| +5 Volts monitor | 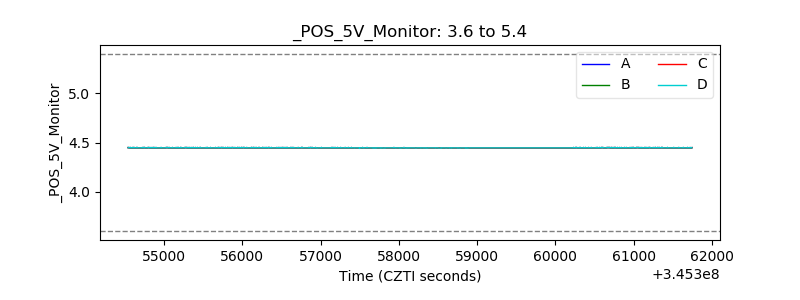 |
| _ROLL_ROT | 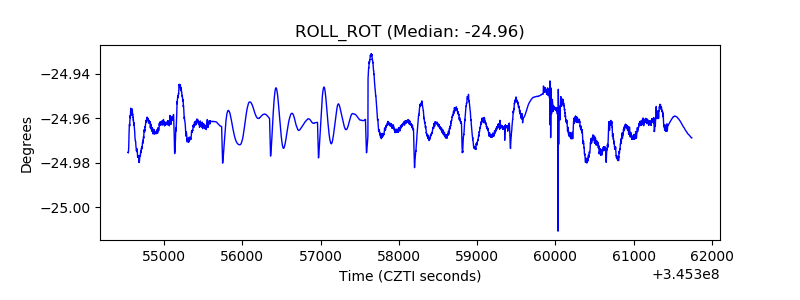 |
| _Roll_DEC | 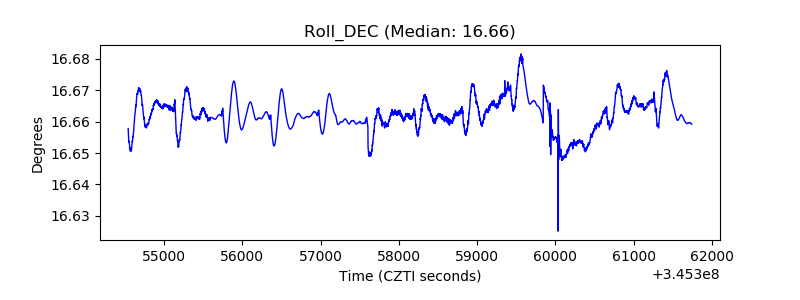 |
| _Roll_RA | 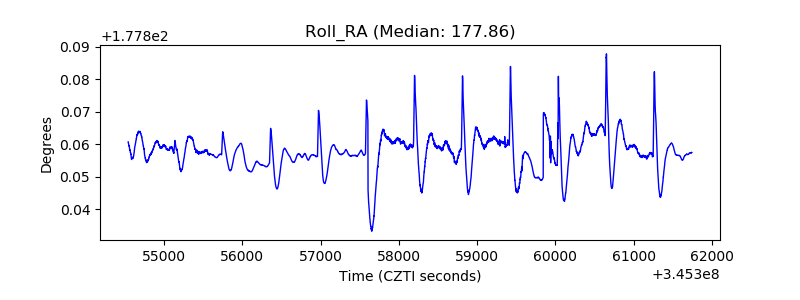 |
| Veto Counter | 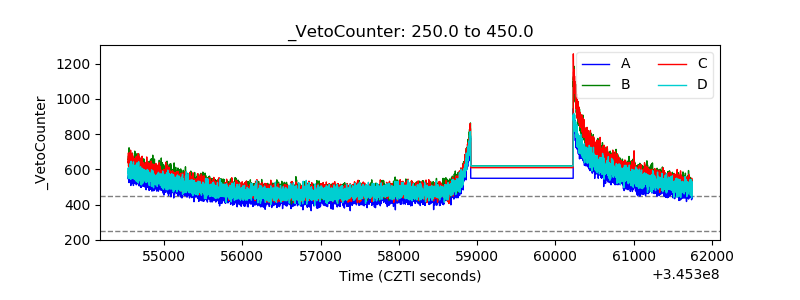 |