| Param | Original file | Final file |
|---|---|---|
| Filename | modeM0/AS1A10_045T04_9000004066_28140cztM0_level2.evt | modeM0/AS1A10_045T04_9000004066_28140cztM0_level2_quad_clean.evt |
| Size (bytes) | 470,445,120 | 86,935,680 |
| Size | 448.7 MB | 82.9 MB |
| Events in quadrant A | 3,074,880 | 562,105 |
| Events in quadrant B | 3,498,997 | 577,900 |
| Events in quadrant C | 3,084,284 | 547,145 |
| Events in quadrant D | 4,183,011 | 527,423 |
| Mode M0 | |||
|---|---|---|---|
| Quadrant | BADHDUFLAG | Total packets | Discarded packets |
| A | 0 | 12535 | 0 |
| B | 0 | 13948 | 0 |
| C | 0 | 12537 | 0 |
| D | 0 | 16231 | 0 |
| Mode M9 | |||
|---|---|---|---|
| Quadrant | BADHDUFLAG | Total packets | Discarded packets |
| A | 0 | 13 | 0 |
| B | 0 | 13 | 0 |
| C | 0 | 13 | 0 |
| D | 0 | 13 | 0 |
| Quadrant | Total seconds | Saturated seconds | Saturation percentage |
|---|---|---|---|
| A | 5985 | 41 | 0.685046% |
| B | 5985 | 121 | 2.021721% |
| C | 5985 | 72 | 1.203008% |
| D | 5985 | 233 | 3.893066% |
Noise dominated data is calculated using 1-second bins in cleaned event files. If a bin has >2000 counts, and if more than 50% of those come from <1% of pixels, then it is considered to be noise-dominated and hence unusable.
| Quadrant | # 1 sec bins | Bins with >0 counts | Bins with >2000 counts | High rate bins dominated by noise | Noise dominated (total time) | Noise dominated (detector-on time) | Marked lightcurve |
|---|---|---|---|---|---|---|---|
| A | 7270 | 5986 | 1 | 1 | 0.01% | 0.02% |  |
| B | 7270 | 5986 | 52 | 52 | 0.72% | 0.87% |  |
| C | 7270 | 5986 | 1 | 1 | 0.01% | 0.02% |  |
| D | 7270 | 5986 | 203 | 203 | 2.79% | 3.39% |  |
Top three noisy pixels from each quadrant. If the there are fewer than three noisy pixels in the level2.evt file, extra rows are filled as -1
| Pixel properties | Quadrant properties | ||||||
|---|---|---|---|---|---|---|---|
| Quadrant | DetID | PixID | Counts | Sigma | Mean | Median | Sigma |
| A | 15 | 174 | 28841 | 179.21 | 785 | 772 | 156.6 |
| A | 0 | 13 | 13792 | 83.13 | 785 | 772 | 156.6 |
| A | 13 | 254 | 10749 | 63.7 | 785 | 772 | 156.6 |
| B | 15 | 32 | 384686 | 2612.75 | 775 | 757 | 146.9 |
| B | 10 | 245 | 25175 | 166.17 | 775 | 757 | 146.9 |
| B | 4 | 200 | 20601 | 135.04 | 775 | 757 | 146.9 |
| C | 14 | 238 | 122922 | 697.23 | 749 | 755 | 175.2 |
| C | 3 | 233 | 25183 | 139.41 | 749 | 755 | 175.2 |
| C | 2 | 16 | 14830 | 80.33 | 749 | 755 | 175.2 |
| D | 1 | 52 | 437723 | 2455.7 | 745 | 728 | 178.0 |
| D | 12 | 233 | 422111 | 2367.97 | 745 | 728 | 178.0 |
| D | 2 | 250 | 250461 | 1403.38 | 745 | 728 | 178.0 |
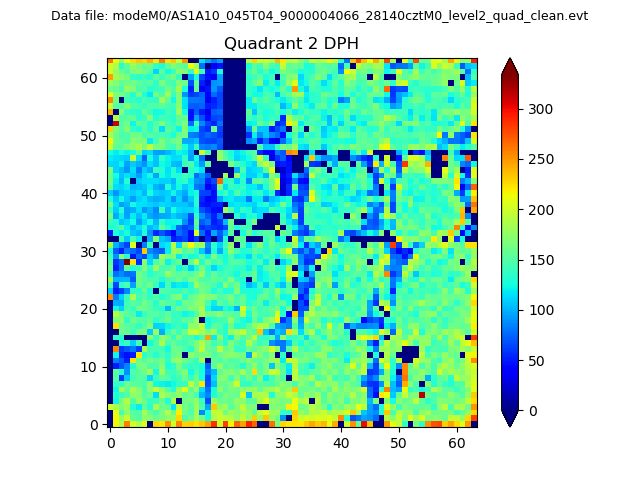
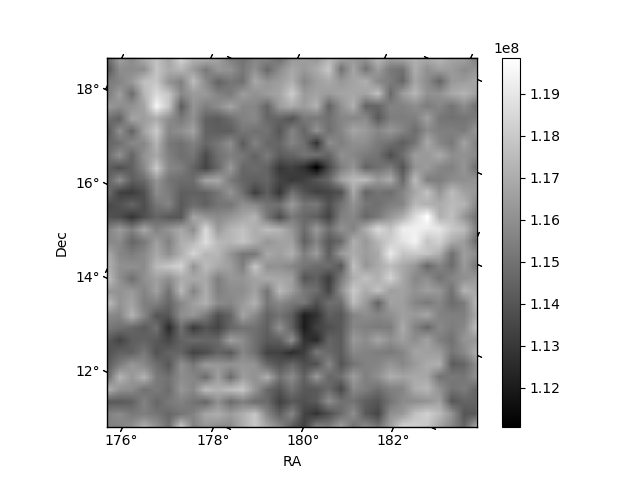
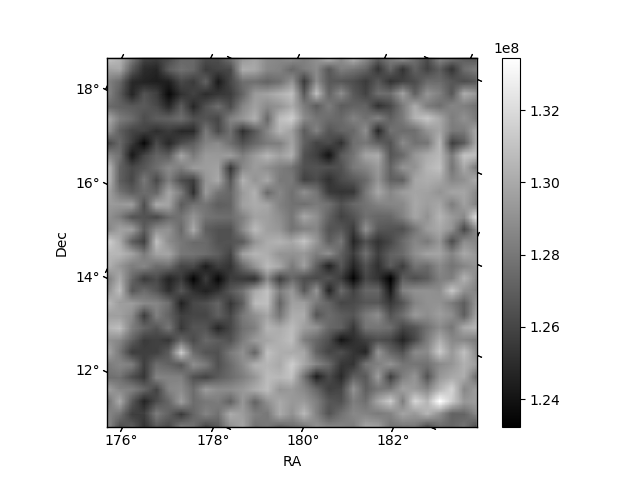
Histogram calculated using DETX and DETY for each event in the final _common_clean file
| Quadrant A | 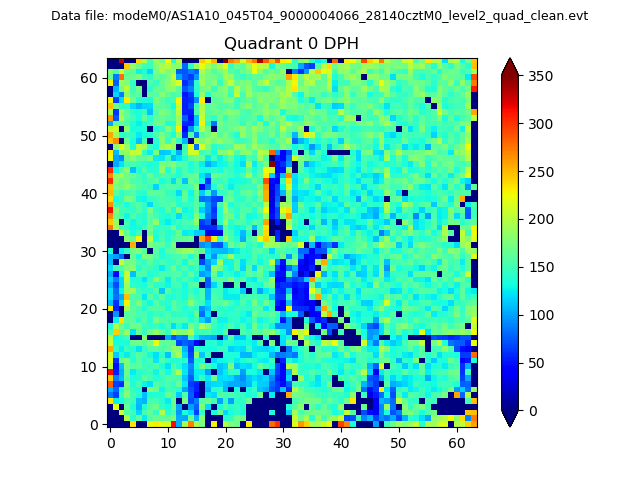 |
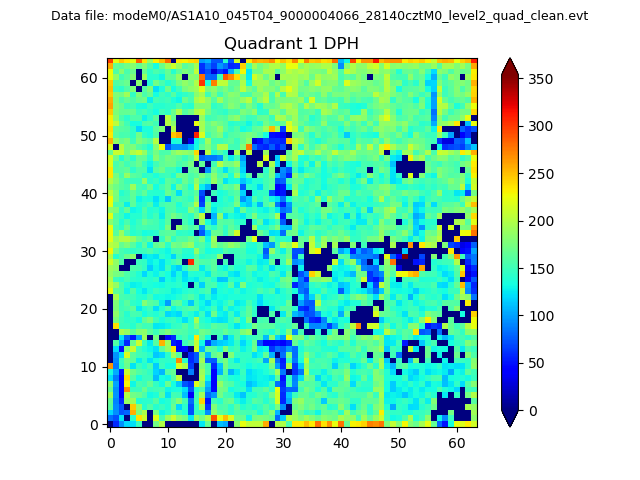 |
Quadrant B |
|---|---|---|---|
| Quadrant D | 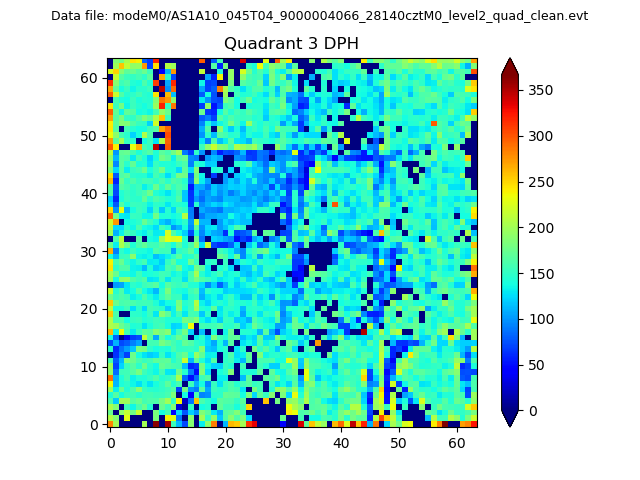 |
 |
Quadrant C |
| Plot type | Count rate plots | Images |
|---|---|---|
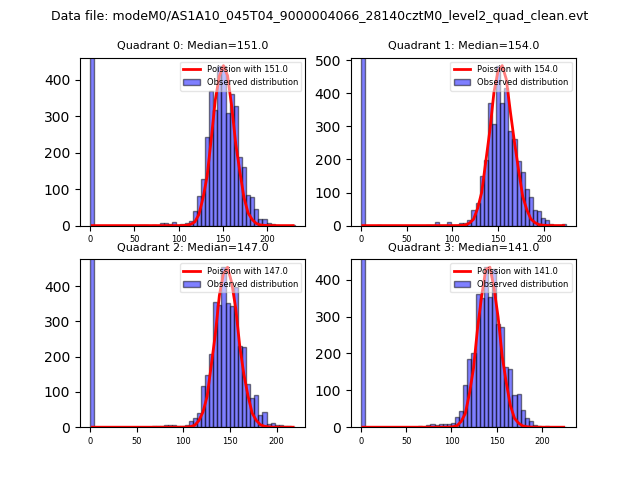
| Comparison with Poisson distribution Blue bars denote a histogram of data divided into 1 sec bins. Red curve is a Poisson curve with rate = median count rate of data. |
 |
 |
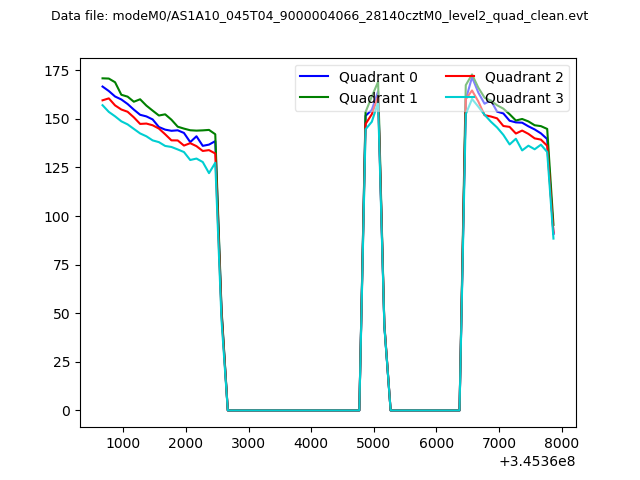
| Quadrant-wise count rates Data is divided into 100 sec bins |
 |
|
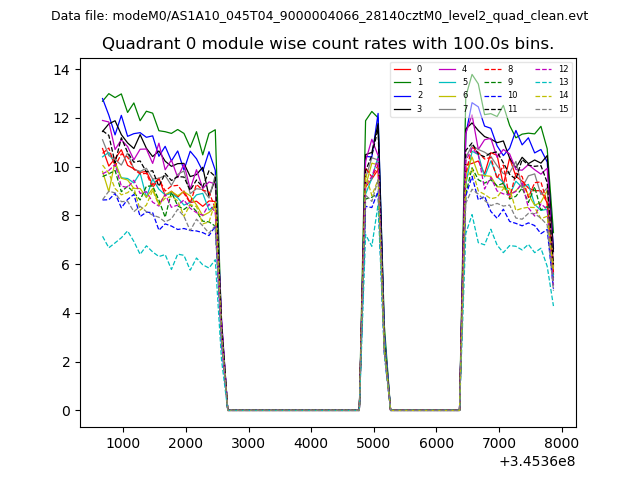
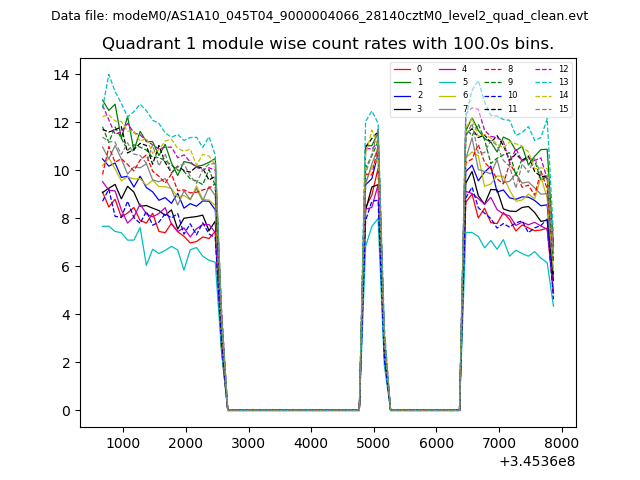
| Module-wise count rates for Quadrant A Data is divided into 100 sec bins |
 |
 |
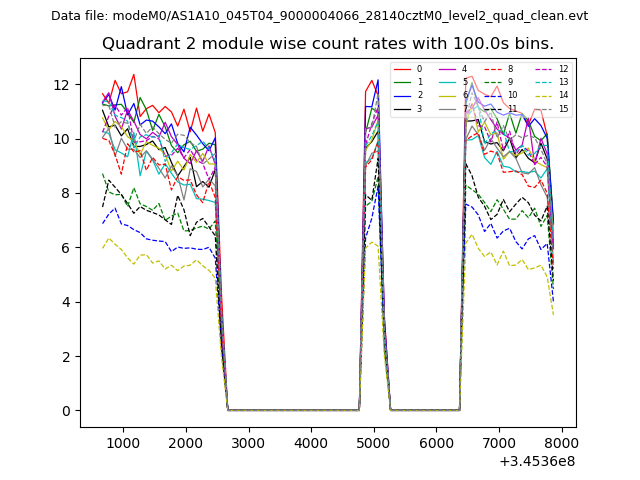
| Module-wise count rates for Quadrant B Data is divided into 100 sec bins |
 |
 |
| Module-wise count rates for Quadrant C Data is divided into 100 sec bins |
 |
 |
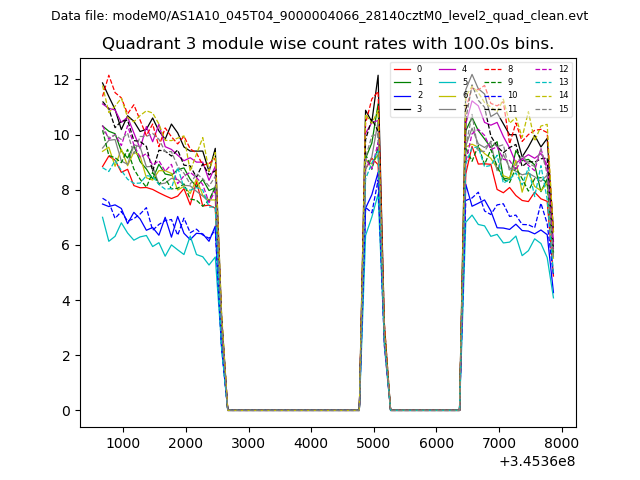
| Module-wise count rates for Quadrant D Data is divided into 100 sec bins |
 |
 |
| Parameter | Plot |
|---|---|
| CZT HV Monitor | 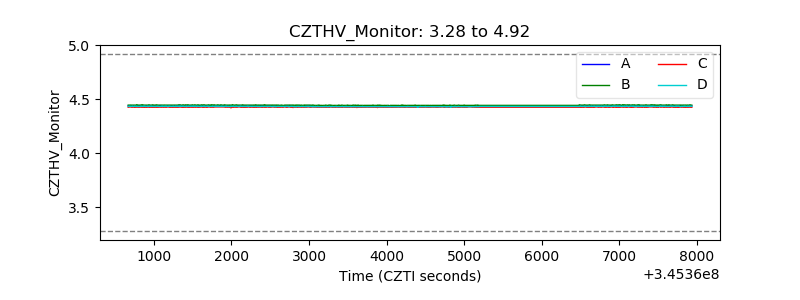 |
| D_VDD | 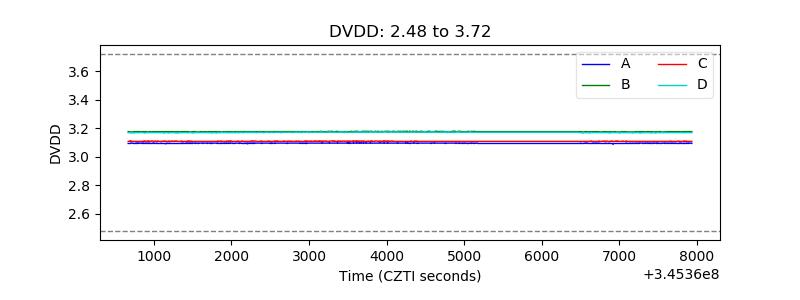 |
| Temperature 1 | 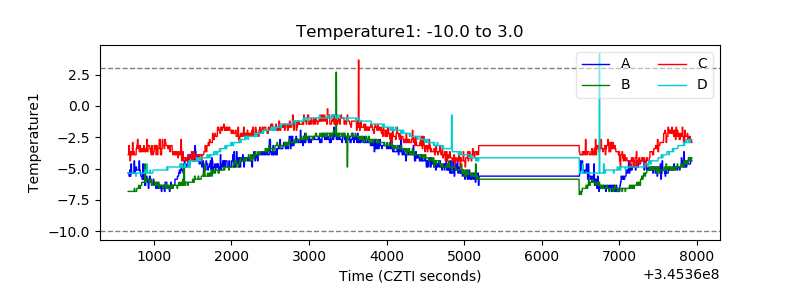 |
| Veto HV Monitor | 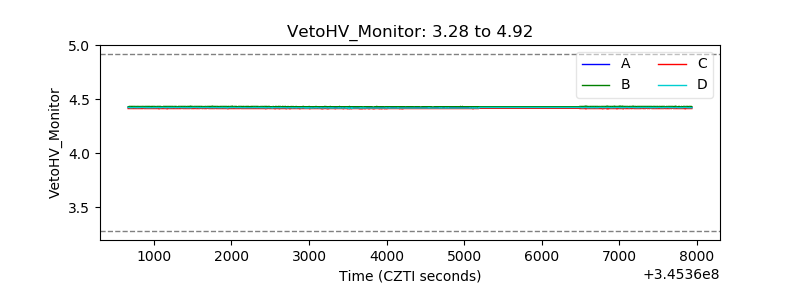 |
| Veto LLD | 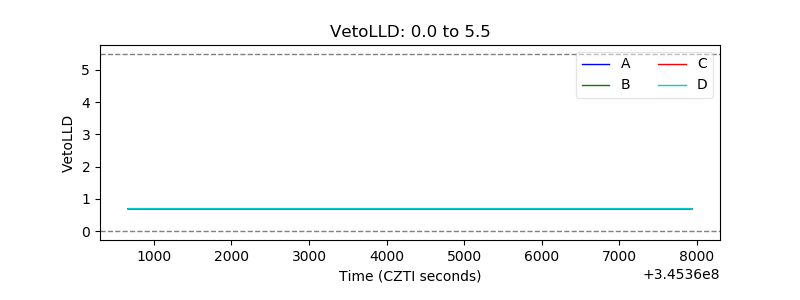 |
| Alpha Counter | 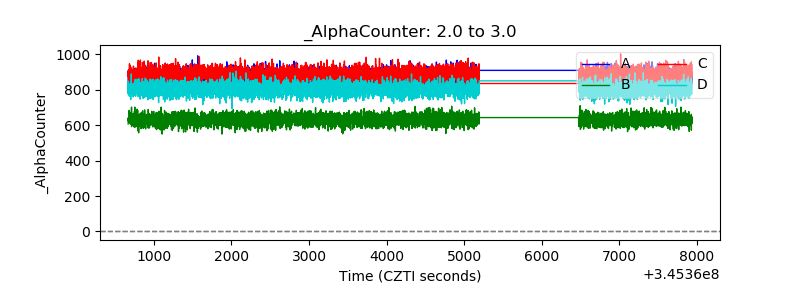 |
| _CPM_Rate | 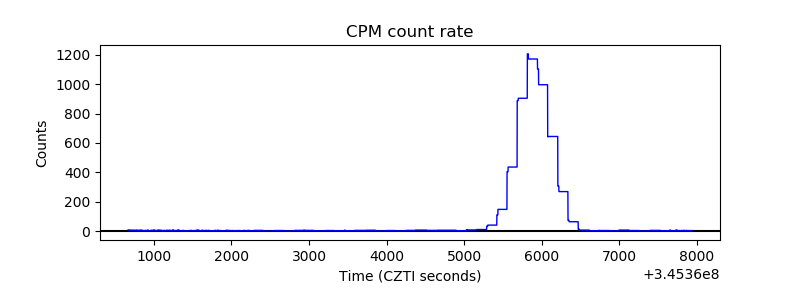 |
| CZT Counter | 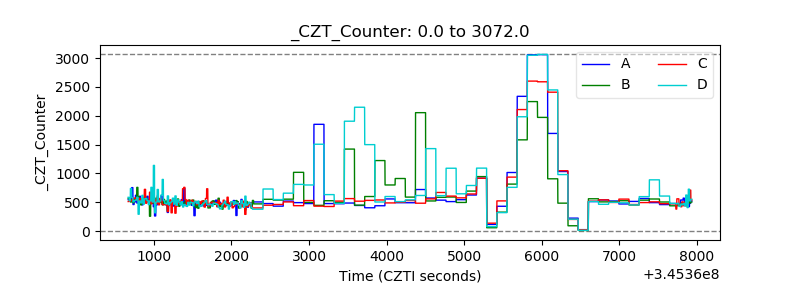 |
| +2.5 Volts monitor |  |
| +5 Volts monitor |  |
| _ROLL_ROT |  |
| _Roll_DEC | 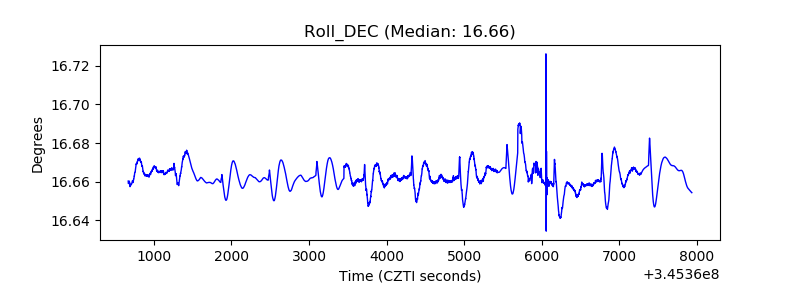 |
| _Roll_RA | 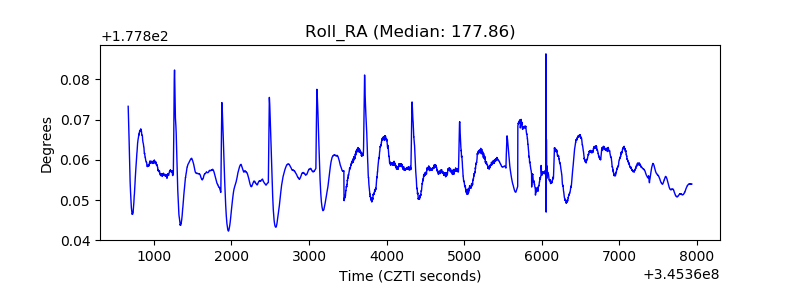 |
| Veto Counter | 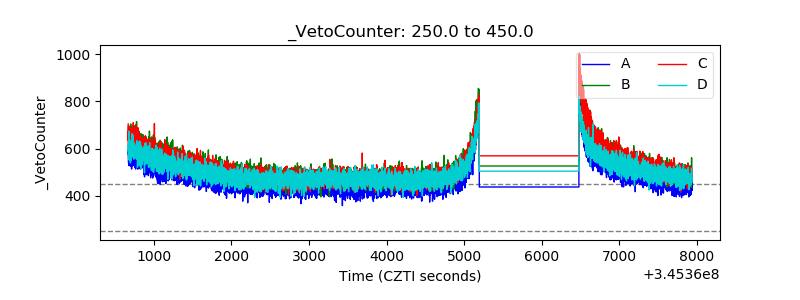 |