| Param | Original file | Final file |
|---|---|---|
| Filename | modeM0/AS1A10_045T04_9000004066_28141cztM0_level2.evt | modeM0/AS1A10_045T04_9000004066_28141cztM0_level2_quad_clean.evt |
| Size (bytes) | 451,097,280 | 77,808,960 |
| Size | 430.2 MB | 74.2 MB |
| Events in quadrant A | 2,886,670 | 496,439 |
| Events in quadrant B | 3,454,385 | 503,518 |
| Events in quadrant C | 3,000,239 | 482,869 |
| Events in quadrant D | 3,929,250 | 470,898 |
| Mode M0 | |||
|---|---|---|---|
| Quadrant | BADHDUFLAG | Total packets | Discarded packets |
| A | 0 | 11902 | 0 |
| B | 0 | 13744 | 0 |
| C | 0 | 12270 | 0 |
| D | 0 | 15325 | 0 |
| Mode M9 | |||
|---|---|---|---|
| Quadrant | BADHDUFLAG | Total packets | Discarded packets |
| A | 0 | 12 | 0 |
| B | 0 | 12 | 0 |
| C | 0 | 12 | 0 |
| D | 0 | 12 | 0 |
| Quadrant | Total seconds | Saturated seconds | Saturation percentage |
|---|---|---|---|
| A | 5761 | 60 | 1.041486% |
| B | 5761 | 175 | 3.037667% |
| C | 5760 | 102 | 1.770833% |
| D | 5760 | 265 | 4.600694% |
Noise dominated data is calculated using 1-second bins in cleaned event files. If a bin has >2000 counts, and if more than 50% of those come from <1% of pixels, then it is considered to be noise-dominated and hence unusable.
| Quadrant | # 1 sec bins | Bins with >0 counts | Bins with >2000 counts | High rate bins dominated by noise | Noise dominated (total time) | Noise dominated (detector-on time) | Marked lightcurve |
|---|---|---|---|---|---|---|---|
| A | 6856 | 5762 | 0 | 0 | 0.00% | 0.00% | 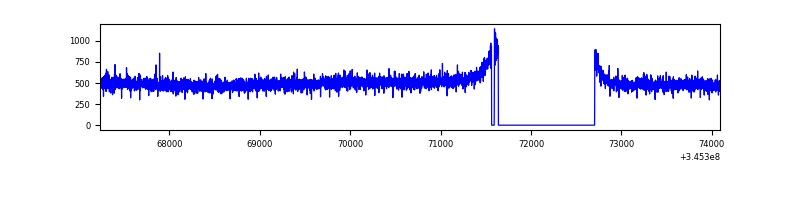 |
| B | 6856 | 5763 | 63 | 63 | 0.92% | 1.09% | 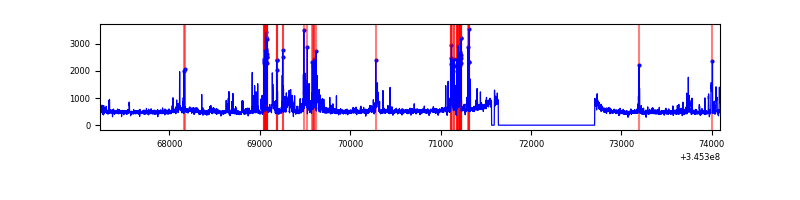 |
| C | 6855 | 5761 | 1 | 1 | 0.01% | 0.02% | 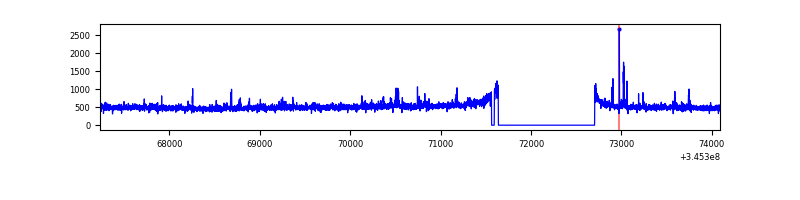 |
| D | 6855 | 5762 | 196 | 196 | 2.86% | 3.40% | 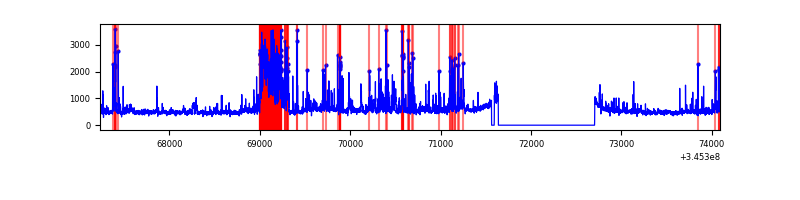 |
Top three noisy pixels from each quadrant. If the there are fewer than three noisy pixels in the level2.evt file, extra rows are filled as -1
| Pixel properties | Quadrant properties | ||||||
|---|---|---|---|---|---|---|---|
| Quadrant | DetID | PixID | Counts | Sigma | Mean | Median | Sigma |
| A | 0 | 13 | 22028 | 141.01 | 742 | 727 | 151.1 |
| A | 13 | 254 | 10489 | 64.62 | 742 | 727 | 151.1 |
| A | 3 | 137 | 6898 | 40.85 | 742 | 727 | 151.1 |
| B | 10 | 245 | 436261 | 3144.13 | 726 | 709 | 138.5 |
| B | 15 | 32 | 73390 | 524.66 | 726 | 709 | 138.5 |
| B | 4 | 80 | 69295 | 495.1 | 726 | 709 | 138.5 |
| C | 3 | 233 | 120759 | 718.4 | 708 | 714 | 167.1 |
| C | 14 | 238 | 112995 | 671.93 | 708 | 714 | 167.1 |
| C | 1 | 16 | 5506 | 28.68 | 708 | 714 | 167.1 |
| D | 12 | 233 | 596667 | 3480.94 | 709 | 691 | 171.2 |
| D | 1 | 52 | 357495 | 2084.0 | 709 | 691 | 171.2 |
| D | 8 | 195 | 195677 | 1138.86 | 709 | 691 | 171.2 |
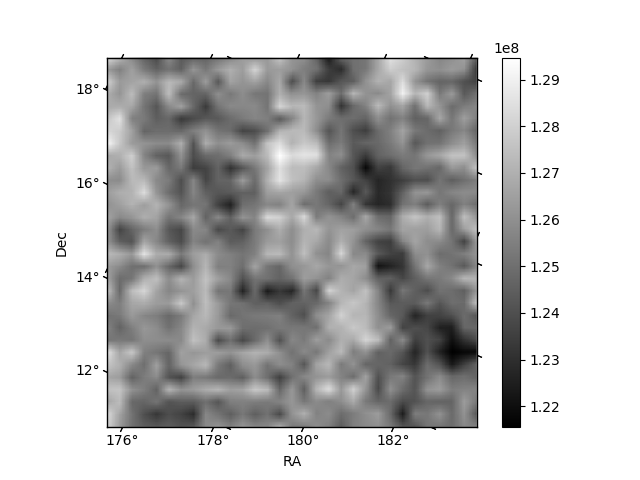
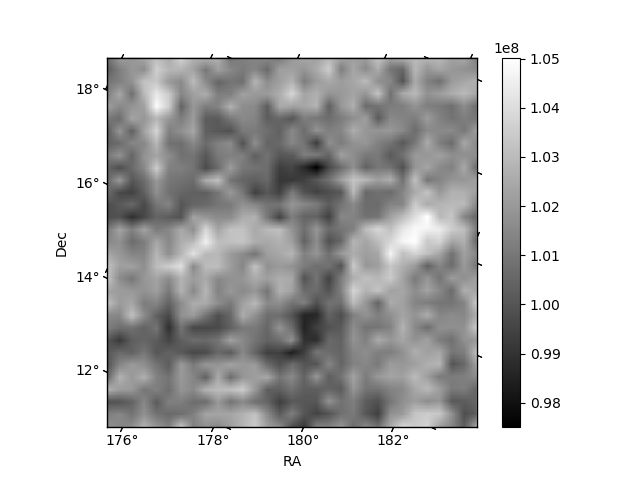
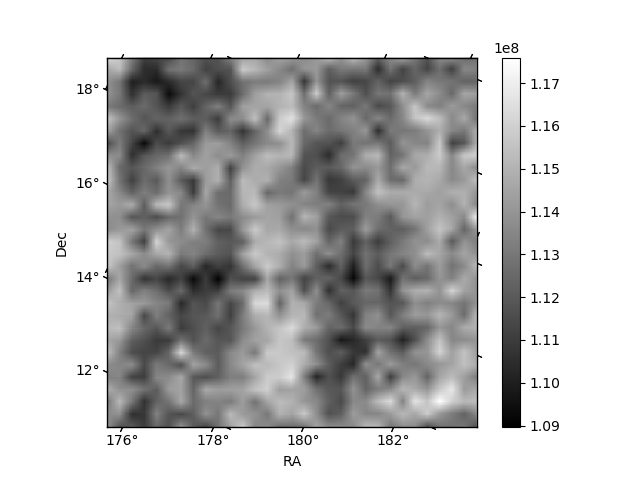
Histogram calculated using DETX and DETY for each event in the final _common_clean file
| Quadrant A | 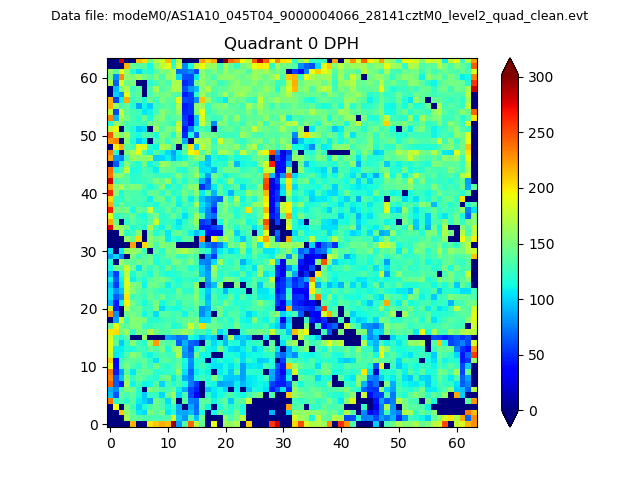 |
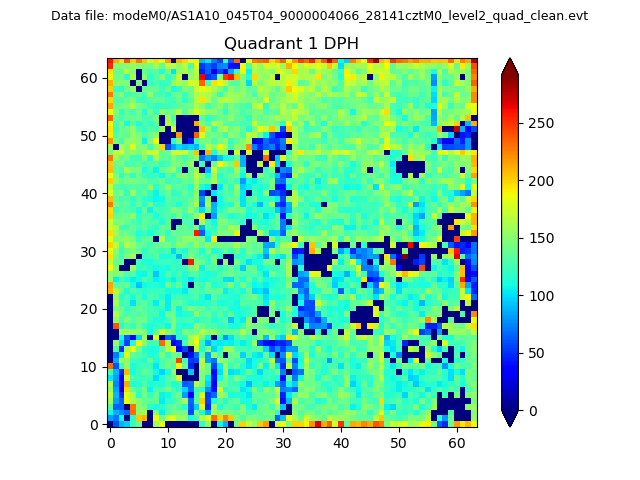 |
Quadrant B |
|---|---|---|---|
| Quadrant D |  |
 |
Quadrant C |
| Plot type | Count rate plots | Images |
|---|---|---|
| Comparison with Poisson distribution Blue bars denote a histogram of data divided into 1 sec bins. Red curve is a Poisson curve with rate = median count rate of data. |
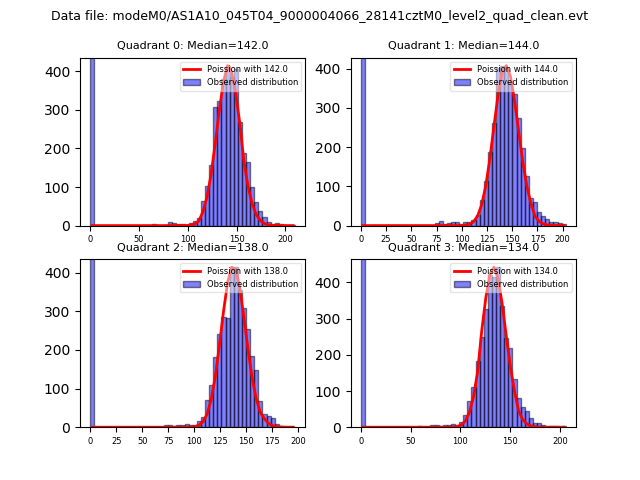 |
 |
| Quadrant-wise count rates Data is divided into 100 sec bins |
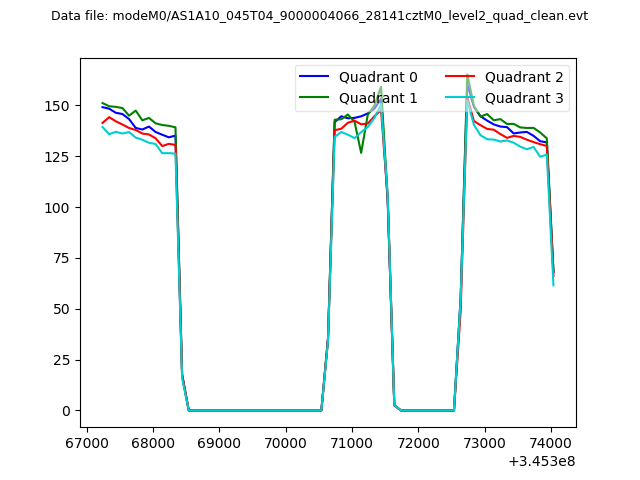 |
|
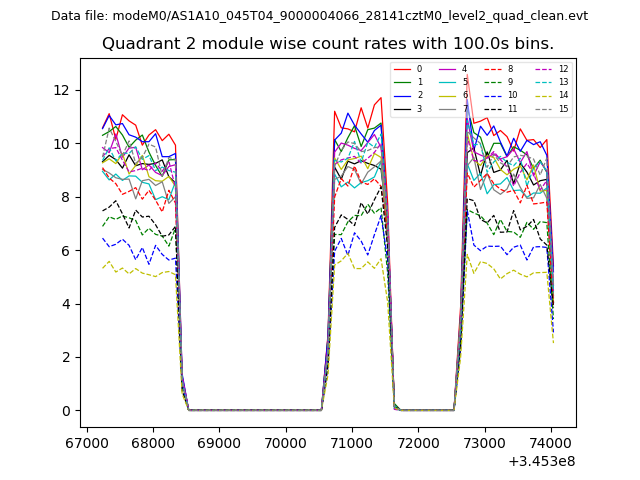
| Module-wise count rates for Quadrant A Data is divided into 100 sec bins |
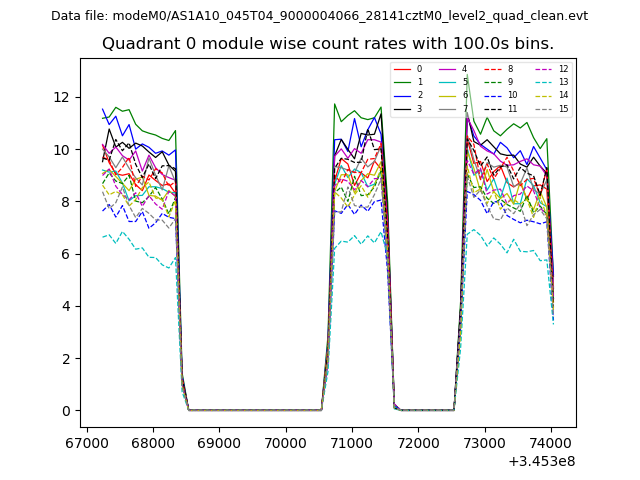 |
 |
| Module-wise count rates for Quadrant B Data is divided into 100 sec bins |
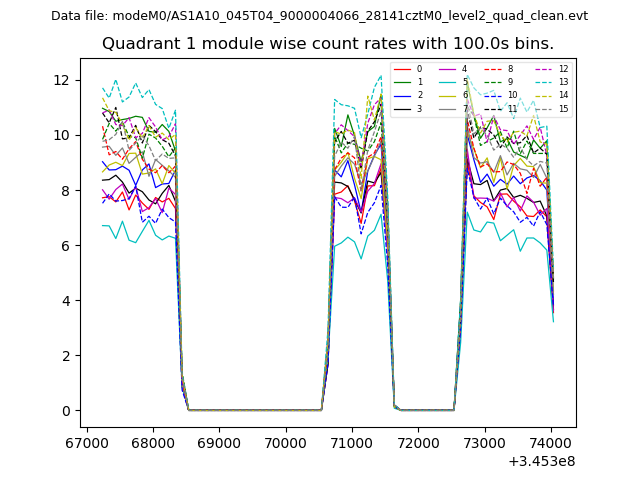 |
 |
| Module-wise count rates for Quadrant C Data is divided into 100 sec bins |
 |
 |
| Module-wise count rates for Quadrant D Data is divided into 100 sec bins |
 |
 |
| Parameter | Plot |
|---|---|
| CZT HV Monitor | 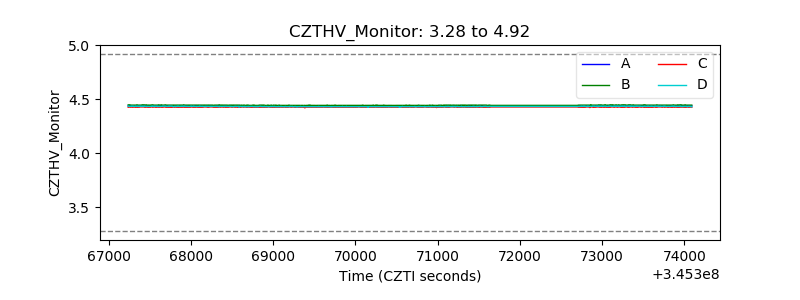 |
| D_VDD | 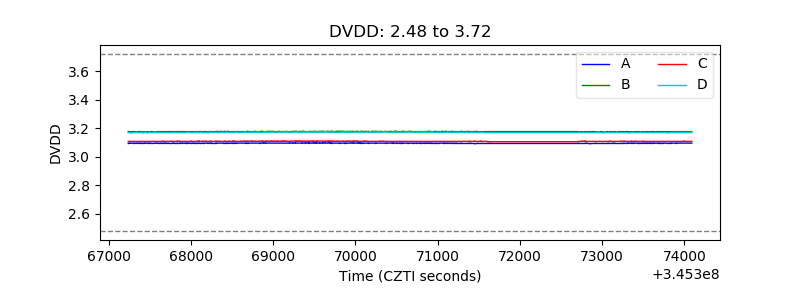 |
| Temperature 1 | 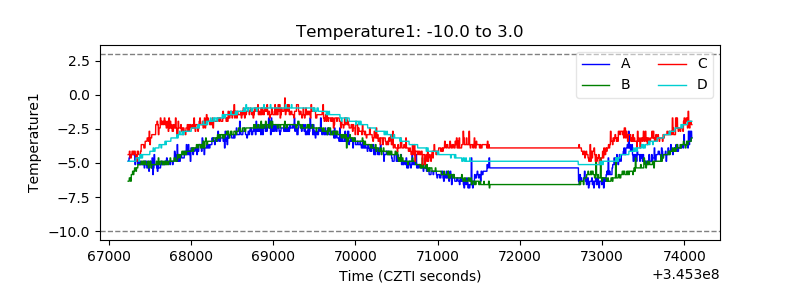 |
| Veto HV Monitor | 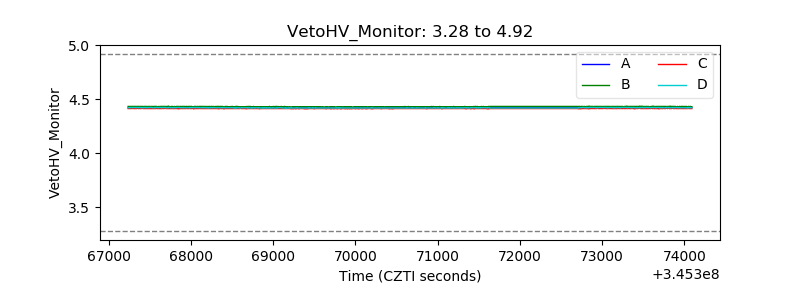 |
| Veto LLD | 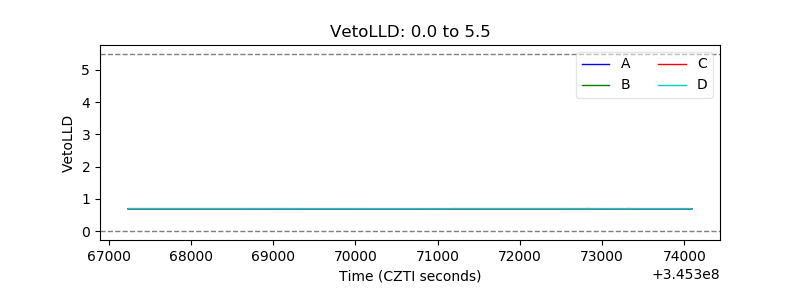 |
| Alpha Counter | 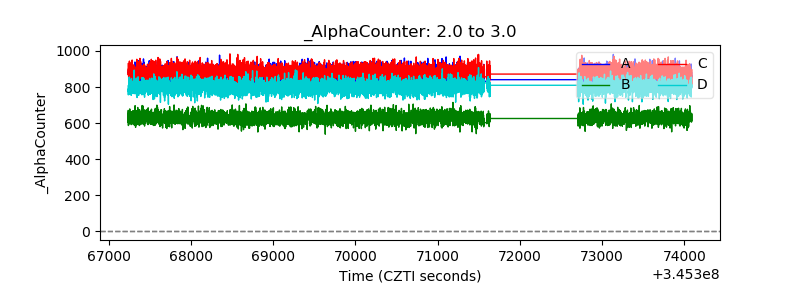 |
| _CPM_Rate |  |
| CZT Counter | 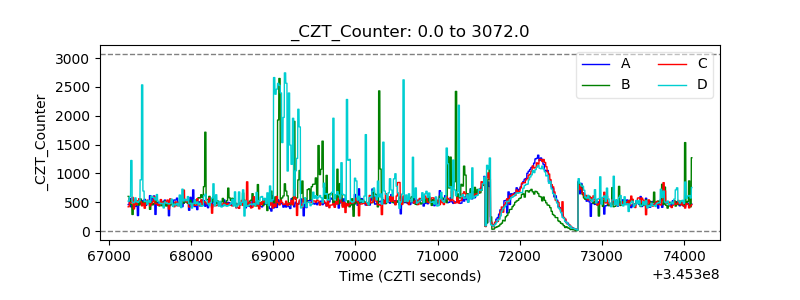 |
| +2.5 Volts monitor |  |
| +5 Volts monitor |  |
| _ROLL_ROT | 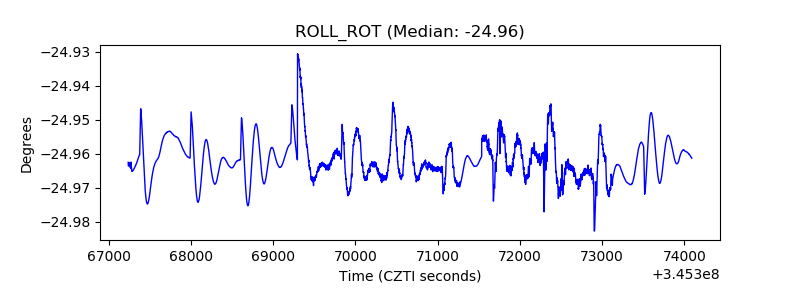 |
| _Roll_DEC | 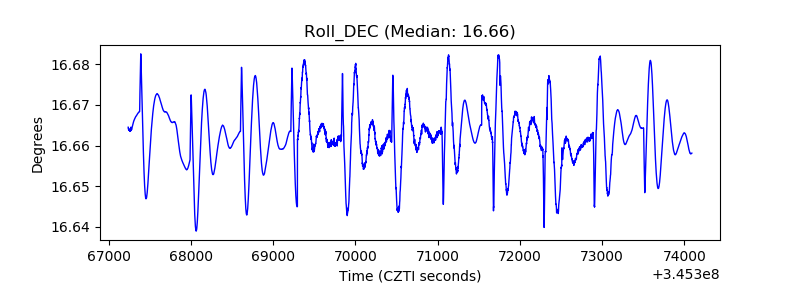 |
| _Roll_RA | 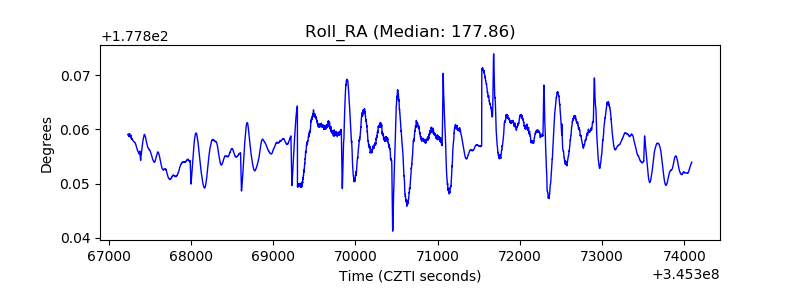 |
| Veto Counter |  |