| Param | Original file | Final file |
|---|---|---|
| Filename | modeM0/AS1A10_045T04_9000004066_28142cztM0_level2.evt | modeM0/AS1A10_045T04_9000004066_28142cztM0_level2_quad_clean.evt |
| Size (bytes) | 546,851,520 | 94,201,920 |
| Size | 521.5 MB | 89.8 MB |
| Events in quadrant A | 3,340,844 | 605,386 |
| Events in quadrant B | 3,759,048 | 611,630 |
| Events in quadrant C | 3,613,409 | 589,402 |
| Events in quadrant D | 5,382,282 | 567,496 |
| Mode M0 | |||
|---|---|---|---|
| Quadrant | BADHDUFLAG | Total packets | Discarded packets |
| A | 0 | 14100 | 0 |
| B | 0 | 15334 | 0 |
| C | 0 | 14811 | 0 |
| D | 0 | 20507 | 0 |
| Mode M9 | |||
|---|---|---|---|
| Quadrant | BADHDUFLAG | Total packets | Discarded packets |
| A | 0 | 8 | 0 |
| B | 0 | 9 | 0 |
| C | 0 | 9 | 0 |
| D | 0 | 9 | 0 |
| Quadrant | Total seconds | Saturated seconds | Saturation percentage |
|---|---|---|---|
| A | 6868 | 98 | 1.426907% |
| B | 6868 | 176 | 2.562609% |
| C | 6868 | 135 | 1.965638% |
| D | 6868 | 400 | 5.824112% |
Noise dominated data is calculated using 1-second bins in cleaned event files. If a bin has >2000 counts, and if more than 50% of those come from <1% of pixels, then it is considered to be noise-dominated and hence unusable.
| Quadrant | # 1 sec bins | Bins with >0 counts | Bins with >2000 counts | High rate bins dominated by noise | Noise dominated (total time) | Noise dominated (detector-on time) | Marked lightcurve |
|---|---|---|---|---|---|---|---|
| A | 7608 | 6868 | 0 | 0 | 0.00% | 0.00% | 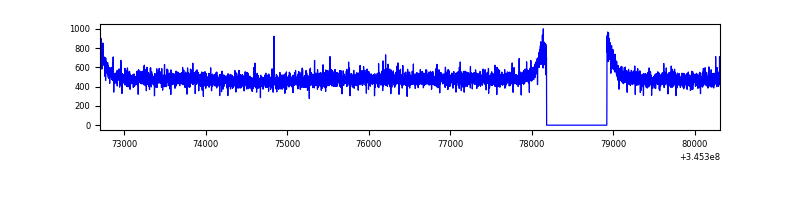 |
| B | 7608 | 6869 | 38 | 38 | 0.50% | 0.55% | 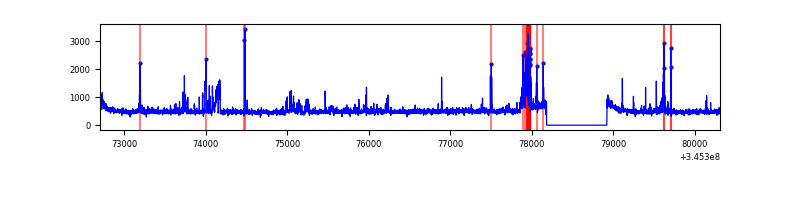 |
| C | 7608 | 6868 | 6 | 6 | 0.08% | 0.09% | 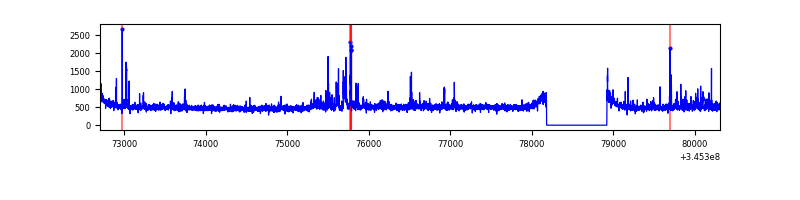 |
| D | 7608 | 6868 | 292 | 292 | 3.84% | 4.25% | 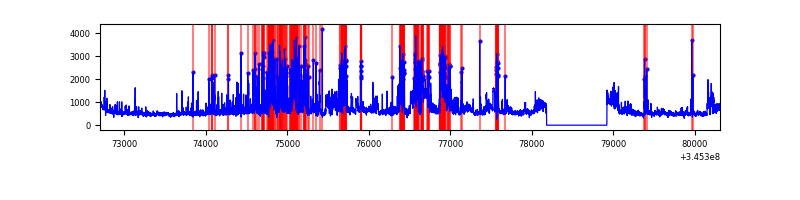 |
Top three noisy pixels from each quadrant. If the there are fewer than three noisy pixels in the level2.evt file, extra rows are filled as -1
| Pixel properties | Quadrant properties | ||||||
|---|---|---|---|---|---|---|---|
| Quadrant | DetID | PixID | Counts | Sigma | Mean | Median | Sigma |
| A | 13 | 254 | 12197 | 65.0 | 864 | 844 | 174.7 |
| A | 3 | 137 | 8318 | 42.79 | 864 | 844 | 174.7 |
| A | 0 | 13 | 7588 | 38.61 | 864 | 844 | 174.7 |
| B | 10 | 245 | 264978 | 1626.54 | 850 | 829 | 162.4 |
| B | 10 | 246 | 75363 | 458.95 | 850 | 829 | 162.4 |
| B | 15 | 32 | 51417 | 311.5 | 850 | 829 | 162.4 |
| C | 3 | 233 | 192576 | 988.53 | 826 | 830 | 194.0 |
| C | 14 | 238 | 133315 | 683.02 | 826 | 830 | 194.0 |
| C | 2 | 16 | 63134 | 321.2 | 826 | 830 | 194.0 |
| D | 1 | 52 | 1129769 | 5745.52 | 824 | 802 | 196.5 |
| D | 12 | 2 | 416359 | 2114.85 | 824 | 802 | 196.5 |
| D | 2 | 250 | 225973 | 1145.94 | 824 | 802 | 196.5 |
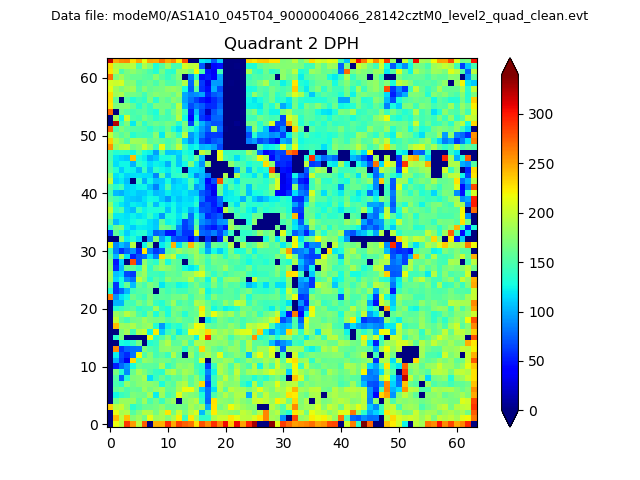
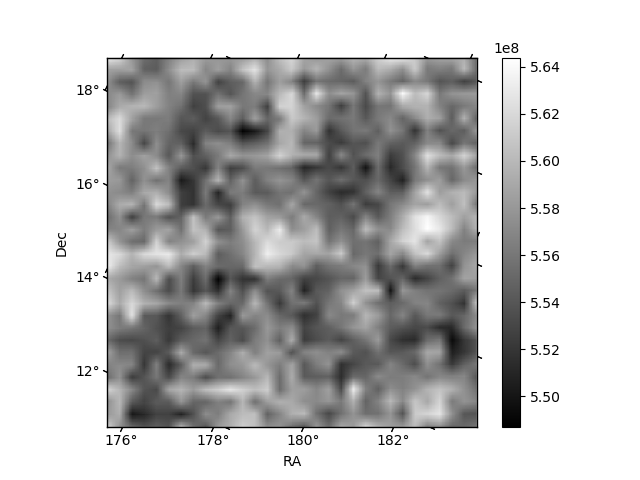
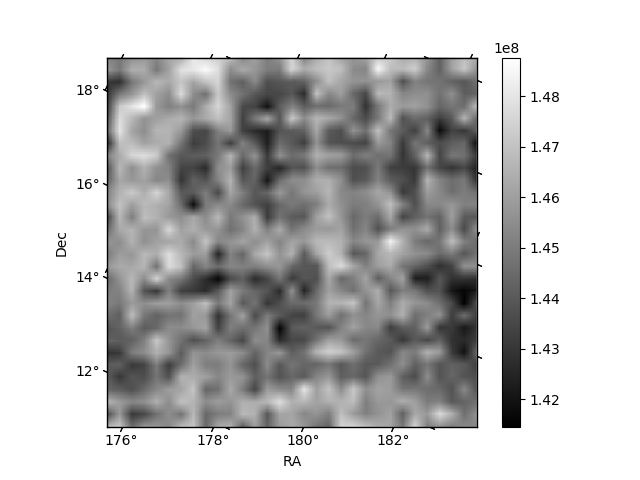
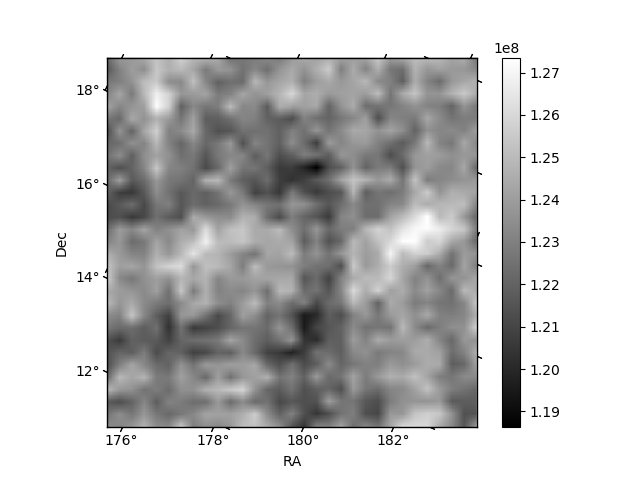
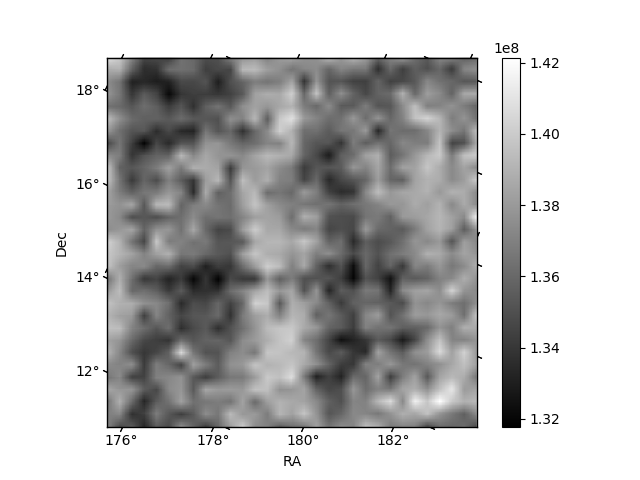
Histogram calculated using DETX and DETY for each event in the final _common_clean file
| Quadrant A | 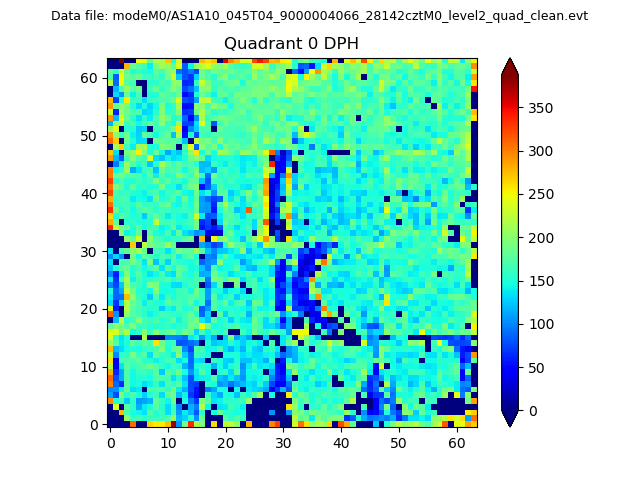 |
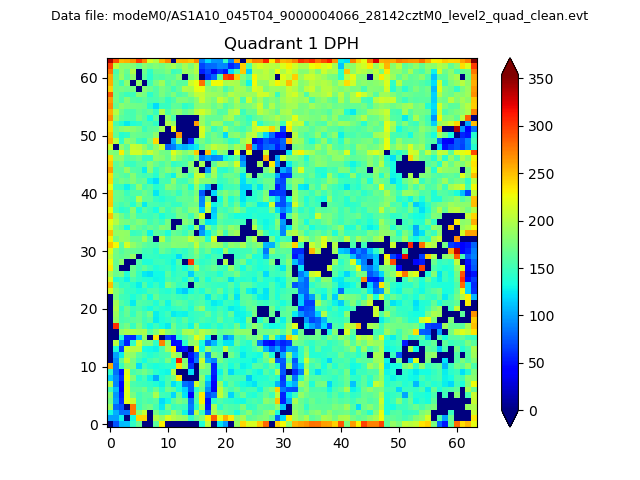 |
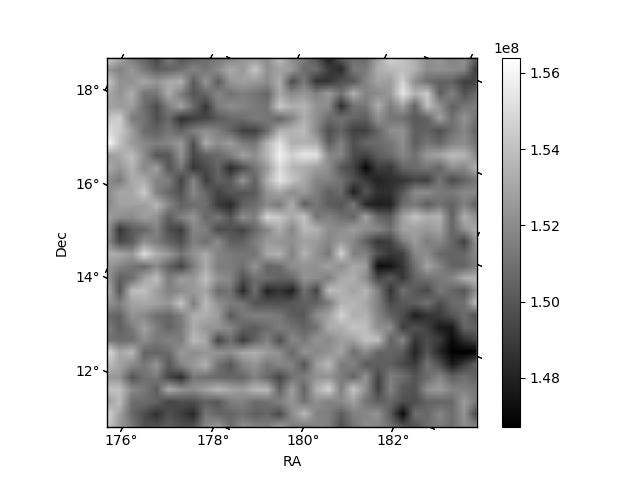
Quadrant B |
|---|---|---|---|
| Quadrant D | 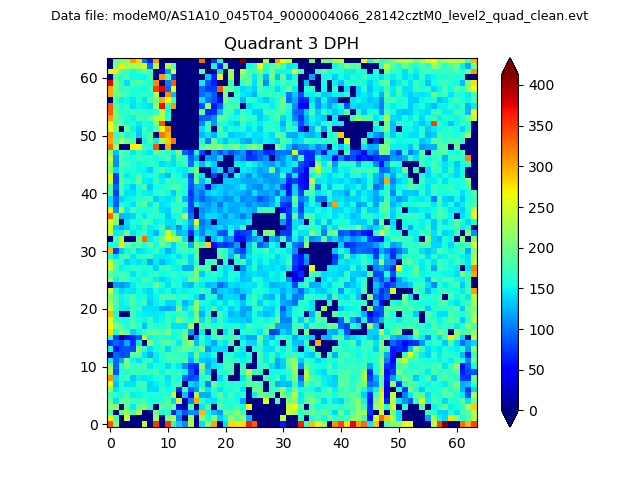 |
 |
Quadrant C |
| Plot type | Count rate plots | Images |
|---|---|---|
| Comparison with Poisson distribution Blue bars denote a histogram of data divided into 1 sec bins. Red curve is a Poisson curve with rate = median count rate of data. |
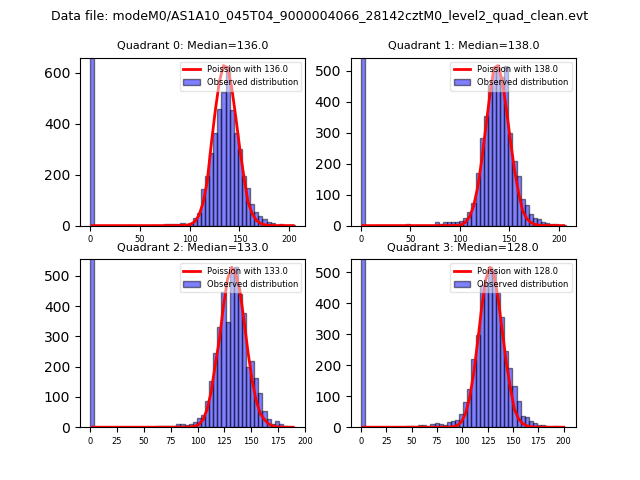 |
 |
| Quadrant-wise count rates Data is divided into 100 sec bins |
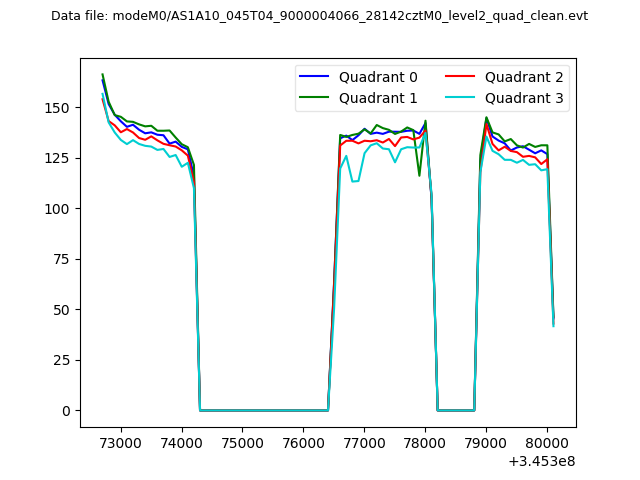 |
|
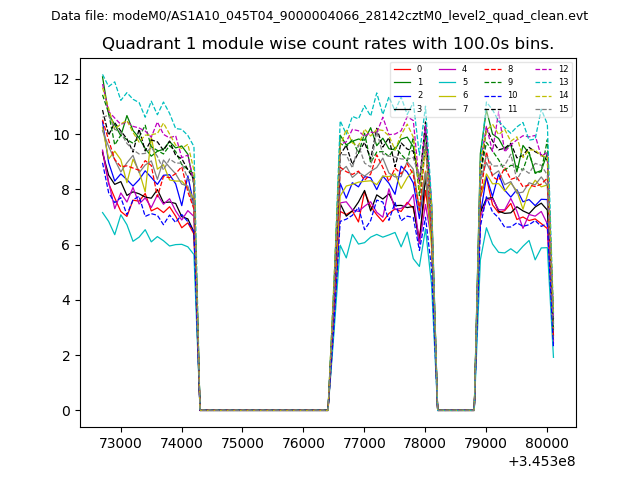
| Module-wise count rates for Quadrant A Data is divided into 100 sec bins |
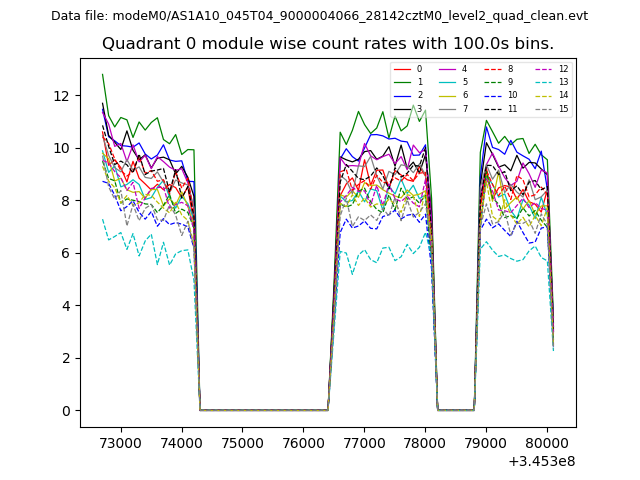 |
 |
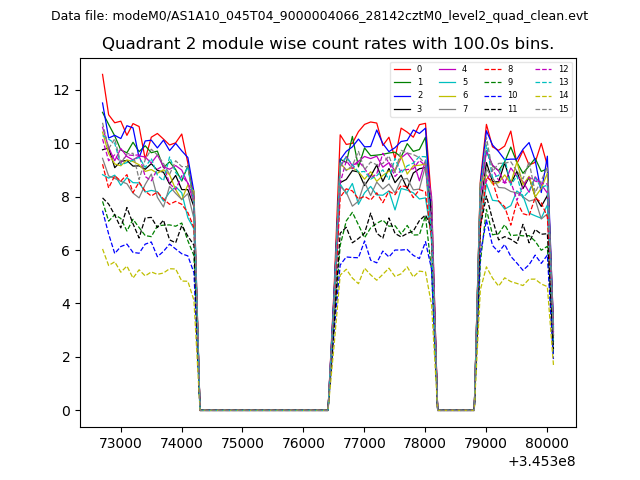
| Module-wise count rates for Quadrant B Data is divided into 100 sec bins |
 |
 |
| Module-wise count rates for Quadrant C Data is divided into 100 sec bins |
 |
 |
| Module-wise count rates for Quadrant D Data is divided into 100 sec bins |
 |
 |
| Parameter | Plot |
|---|---|
| CZT HV Monitor | 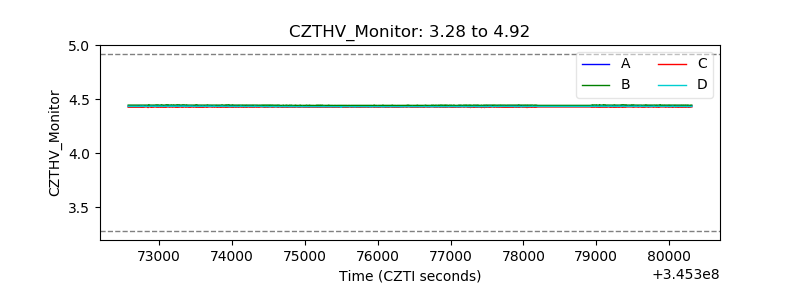 |
| D_VDD |  |
| Temperature 1 | 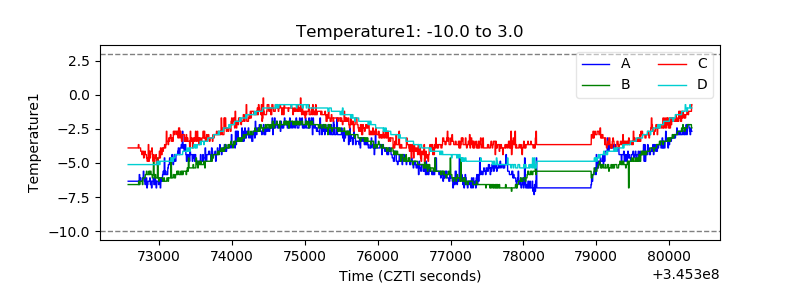 |
| Veto HV Monitor | 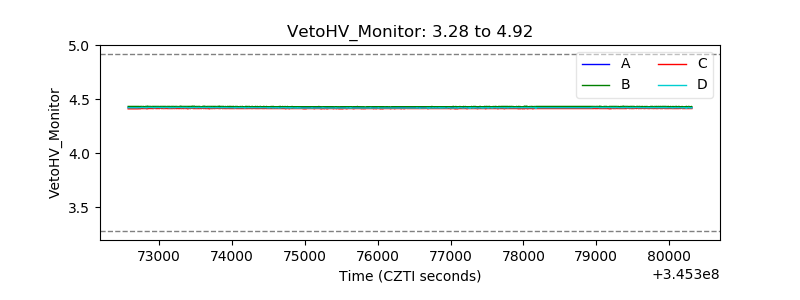 |
| Veto LLD | 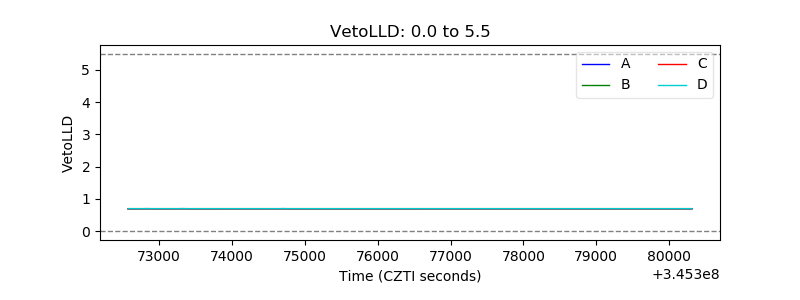 |
| Alpha Counter | 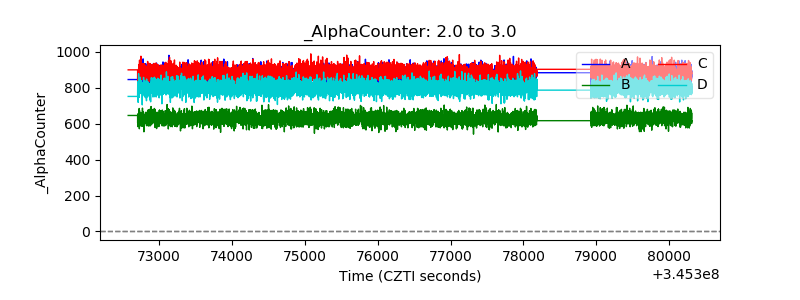 |
| _CPM_Rate | 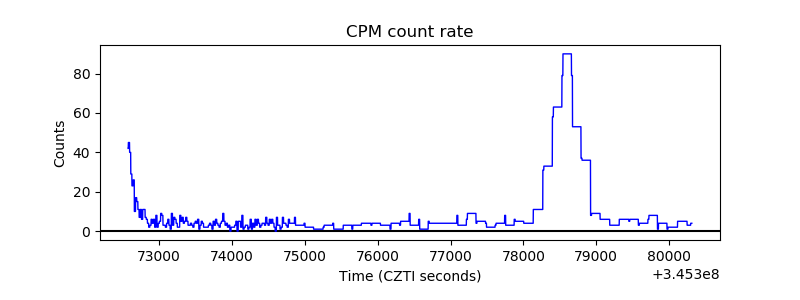 |
| CZT Counter | 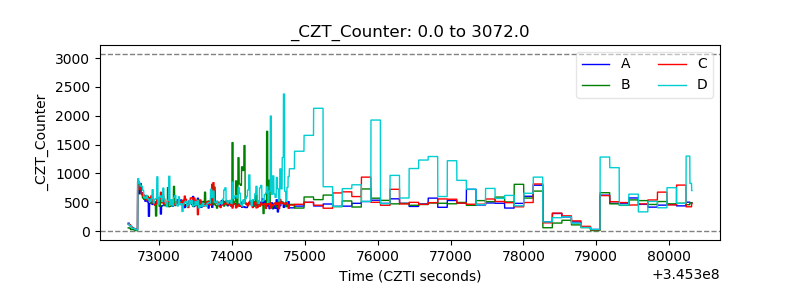 |
| +2.5 Volts monitor |  |
| +5 Volts monitor |  |
| _ROLL_ROT |  |
| _Roll_DEC |  |
| _Roll_RA | 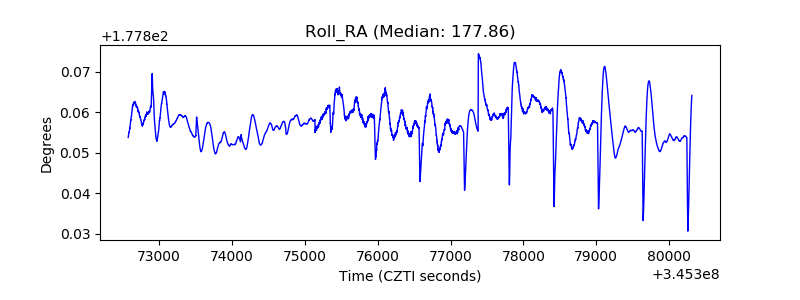 |
| Veto Counter |  |