| Param | Original file | Final file |
|---|---|---|
| Filename | modeM0/AS1A10_045T04_9000004066_28143cztM0_level2.evt | modeM0/AS1A10_045T04_9000004066_28143cztM0_level2_quad_clean.evt |
| Size (bytes) | 555,422,400 | 89,760,960 |
| Size | 529.7 MB | 85.6 MB |
| Events in quadrant A | 3,527,425 | 561,956 |
| Events in quadrant B | 3,768,365 | 571,528 |
| Events in quadrant C | 3,691,851 | 545,260 |
| Events in quadrant D | 5,337,784 | 530,536 |
| Mode M0 | |||
|---|---|---|---|
| Quadrant | BADHDUFLAG | Total packets | Discarded packets |
| A | 0 | 15073 | 0 |
| B | 0 | 15736 | 0 |
| C | 0 | 15434 | 0 |
| D | 0 | 20842 | 0 |
| Mode M9 | |||
|---|---|---|---|
| Quadrant | BADHDUFLAG | Total packets | Discarded packets |
| A | 0 | 3 | 0 |
| B | 0 | 3 | 0 |
| C | 0 | 3 | 0 |
| D | 0 | 3 | 0 |
| Quadrant | Total seconds | Saturated seconds | Saturation percentage |
|---|---|---|---|
| A | 7305 | 162 | 2.217659% |
| B | 7306 | 200 | 2.737476% |
| C | 7306 | 218 | 2.983849% |
| D | 7305 | 286 | 3.915127% |
Noise dominated data is calculated using 1-second bins in cleaned event files. If a bin has >2000 counts, and if more than 50% of those come from <1% of pixels, then it is considered to be noise-dominated and hence unusable.
| Quadrant | # 1 sec bins | Bins with >0 counts | Bins with >2000 counts | High rate bins dominated by noise | Noise dominated (total time) | Noise dominated (detector-on time) | Marked lightcurve |
|---|---|---|---|---|---|---|---|
| A | 7595 | 7305 | 0 | 0 | 0.00% | 0.00% | 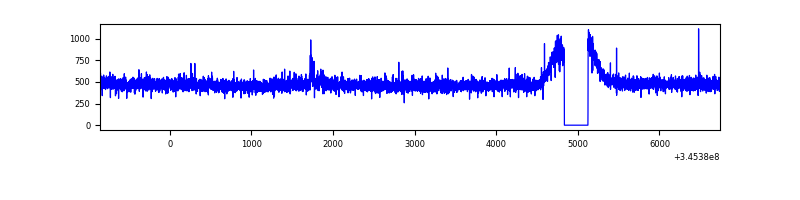 |
| B | 7596 | 7306 | 29 | 29 | 0.38% | 0.40% | 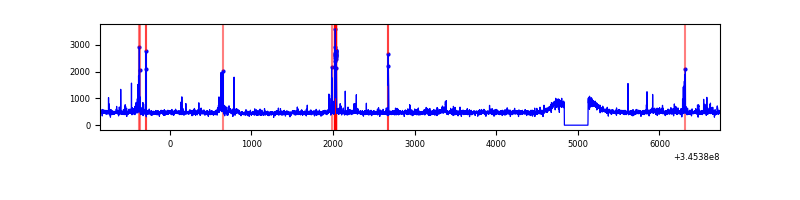 |
| C | 7596 | 7306 | 3 | 3 | 0.04% | 0.04% | 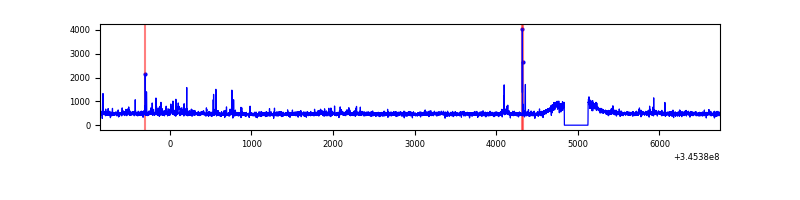 |
| D | 7595 | 7305 | 140 | 140 | 1.84% | 1.92% | 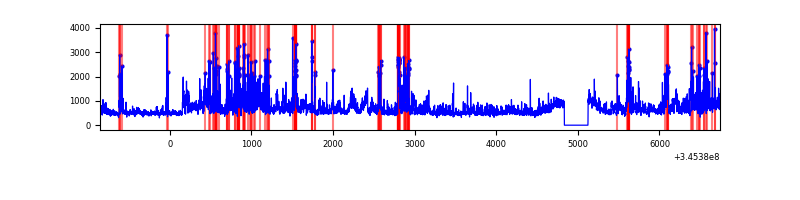 |
Top three noisy pixels from each quadrant. If the there are fewer than three noisy pixels in the level2.evt file, extra rows are filled as -1
| Pixel properties | Quadrant properties | ||||||
|---|---|---|---|---|---|---|---|
| Quadrant | DetID | PixID | Counts | Sigma | Mean | Median | Sigma |
| A | 13 | 254 | 13087 | 65.88 | 911 | 891 | 185.1 |
| A | 15 | 174 | 12659 | 63.57 | 911 | 891 | 185.1 |
| A | 3 | 137 | 9031 | 43.97 | 911 | 891 | 185.1 |
| B | 10 | 246 | 102941 | 587.54 | 895 | 872 | 173.7 |
| B | 10 | 245 | 88754 | 505.88 | 895 | 872 | 173.7 |
| B | 15 | 32 | 23702 | 131.42 | 895 | 872 | 173.7 |
| C | 14 | 238 | 139285 | 673.73 | 871 | 875 | 205.4 |
| C | 3 | 233 | 121311 | 586.24 | 871 | 875 | 205.4 |
| C | 15 | 208 | 23944 | 112.29 | 871 | 875 | 205.4 |
| D | 1 | 52 | 676441 | 3247.88 | 877 | 856 | 208.0 |
| D | 7 | 223 | 452410 | 2170.85 | 877 | 856 | 208.0 |
| D | 2 | 250 | 246705 | 1181.92 | 877 | 856 | 208.0 |
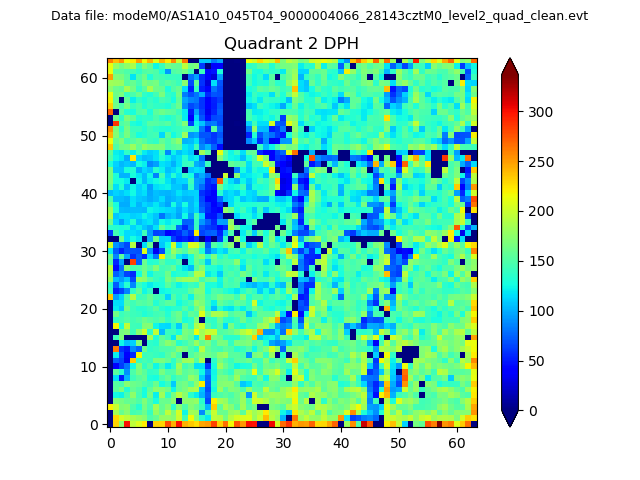
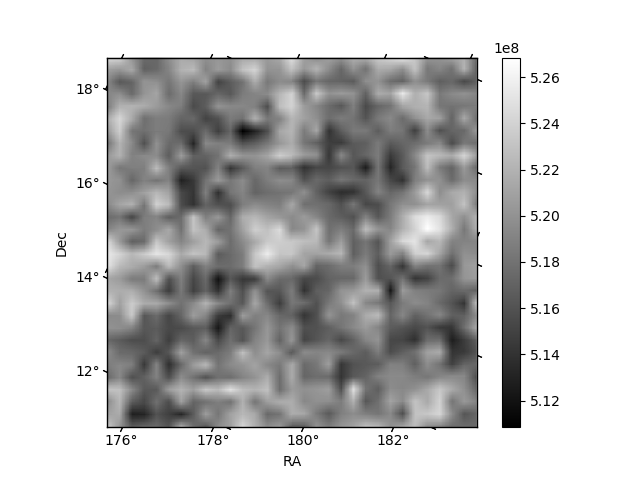
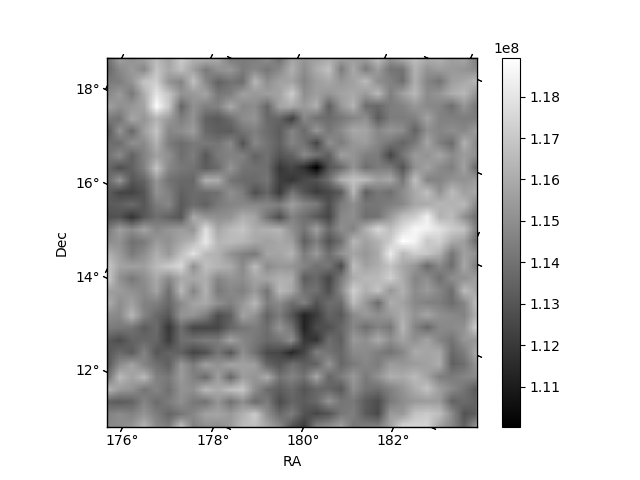
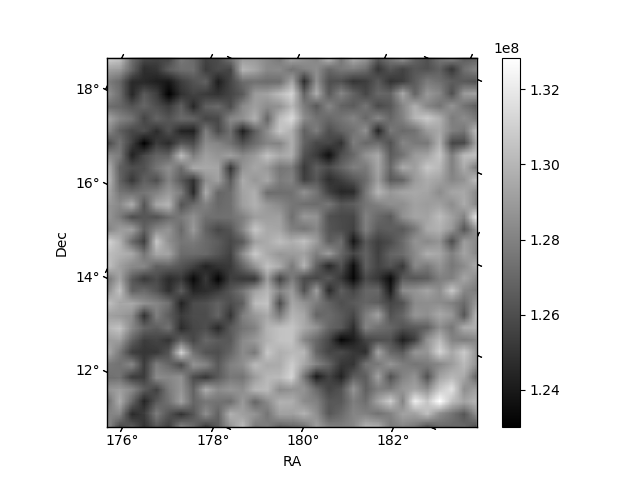
Histogram calculated using DETX and DETY for each event in the final _common_clean file
| Quadrant A | 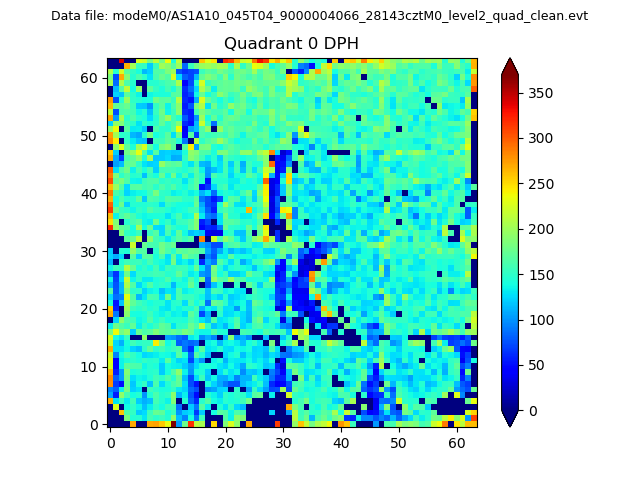 |
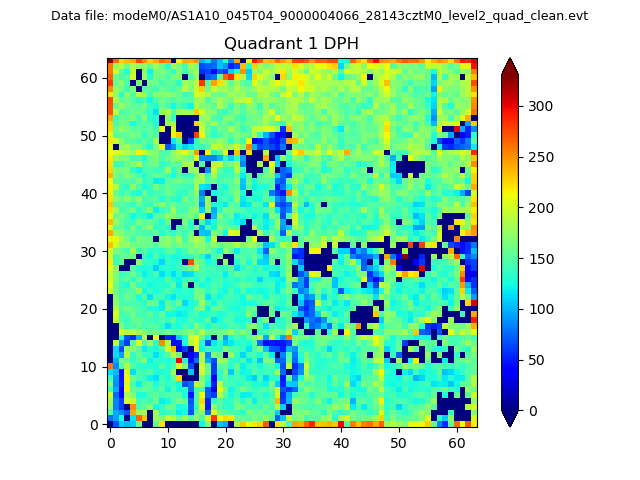 |
Quadrant B |
|---|---|---|---|
| Quadrant D | 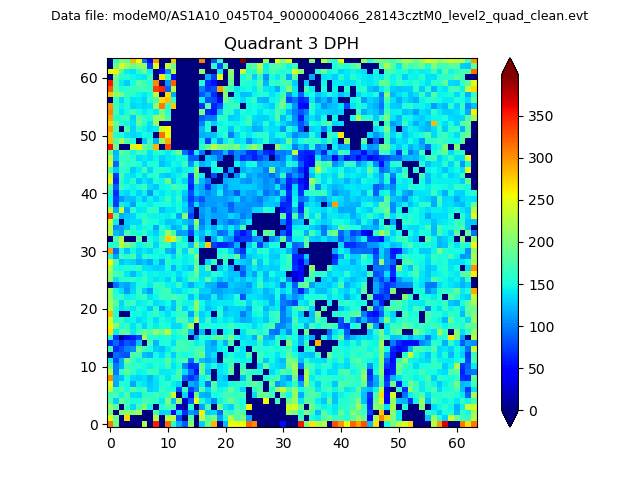 |
 |
Quadrant C |
| Plot type | Count rate plots | Images |
|---|---|---|
| Comparison with Poisson distribution Blue bars denote a histogram of data divided into 1 sec bins. Red curve is a Poisson curve with rate = median count rate of data. |
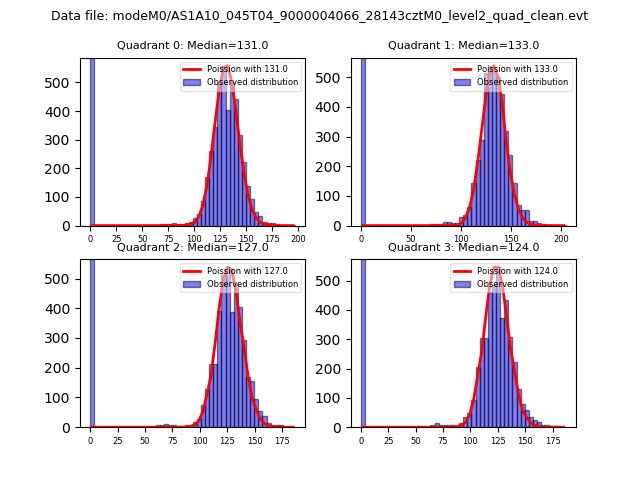 |
 |
| Quadrant-wise count rates Data is divided into 100 sec bins |
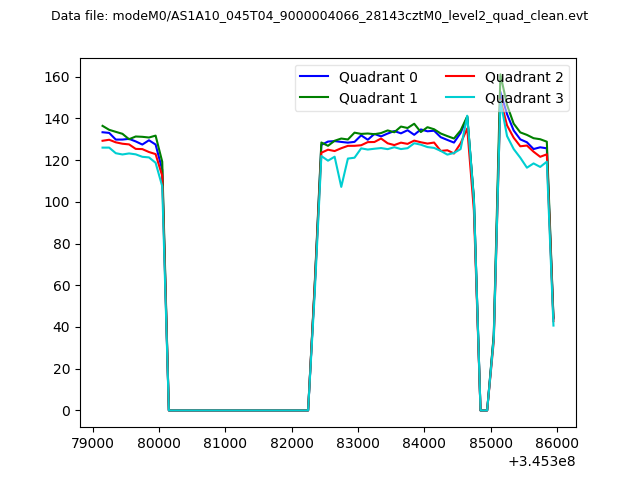 |
|
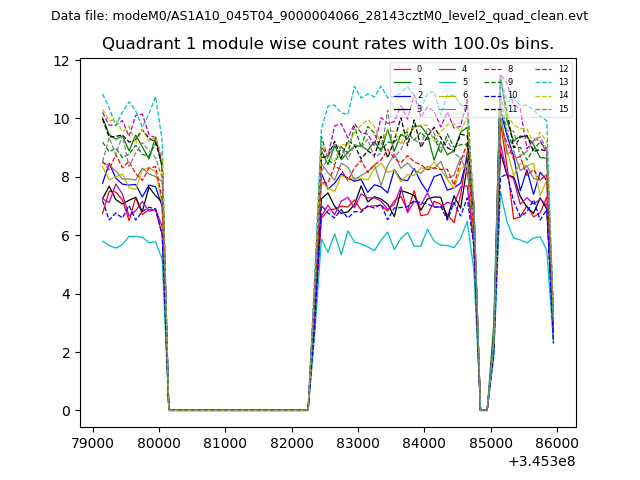
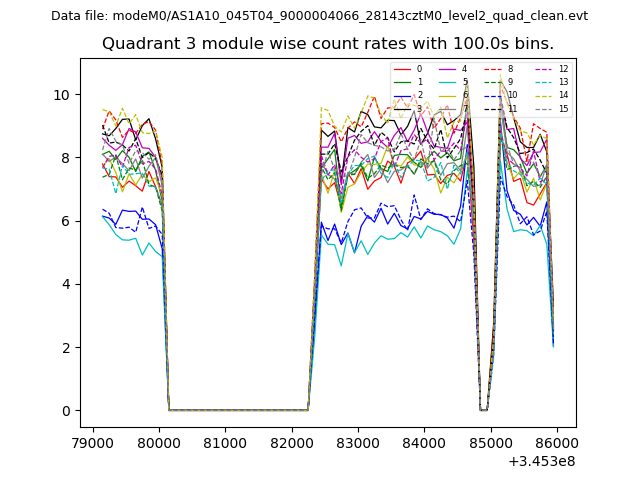
| Module-wise count rates for Quadrant A Data is divided into 100 sec bins |
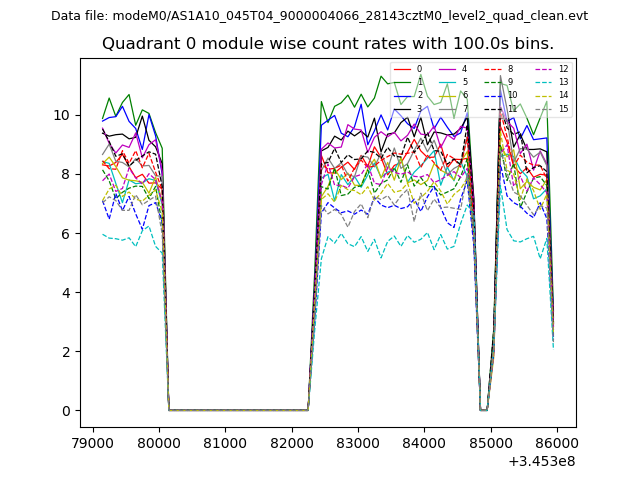 |
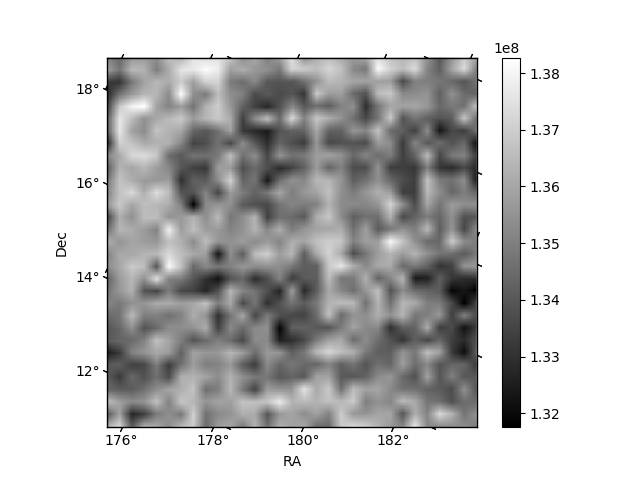 |
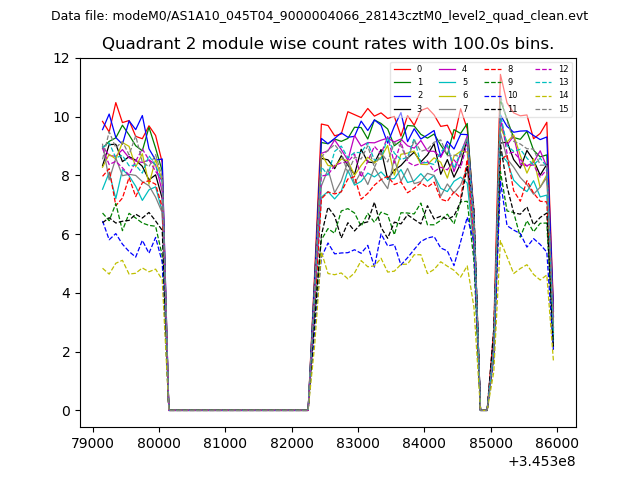
| Module-wise count rates for Quadrant B Data is divided into 100 sec bins |
 |
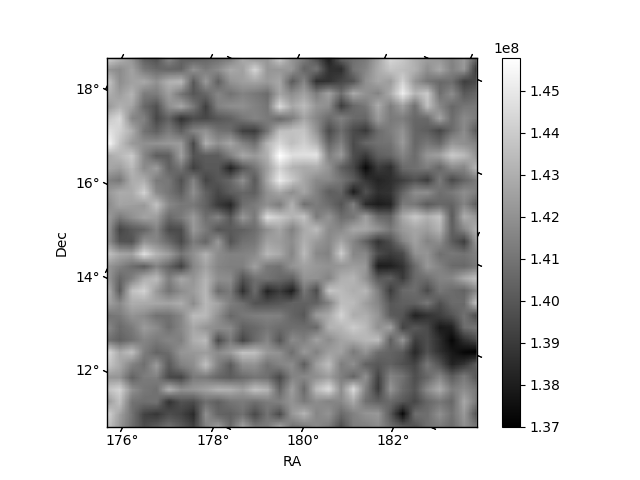 |
| Module-wise count rates for Quadrant C Data is divided into 100 sec bins |
 |
 |
| Module-wise count rates for Quadrant D Data is divided into 100 sec bins |
 |
 |
| Parameter | Plot |
|---|---|
| CZT HV Monitor | 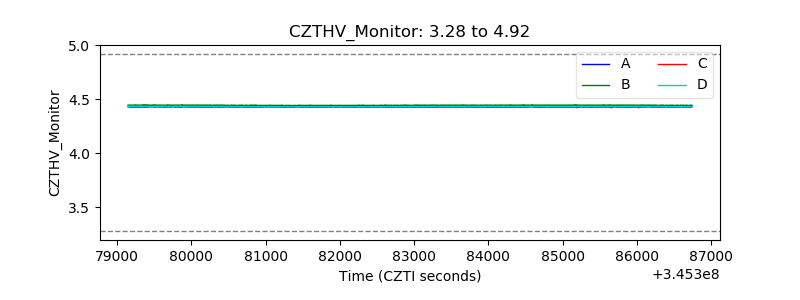 |
| D_VDD | 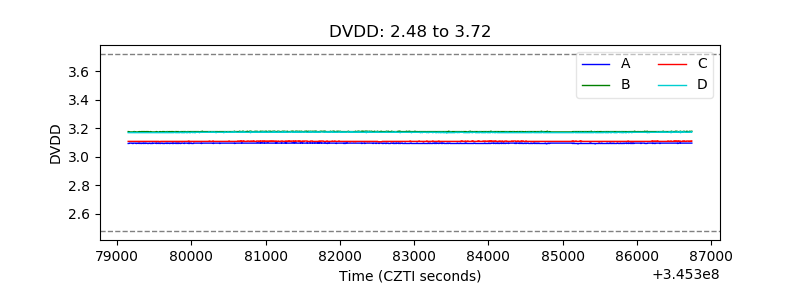 |
| Temperature 1 | 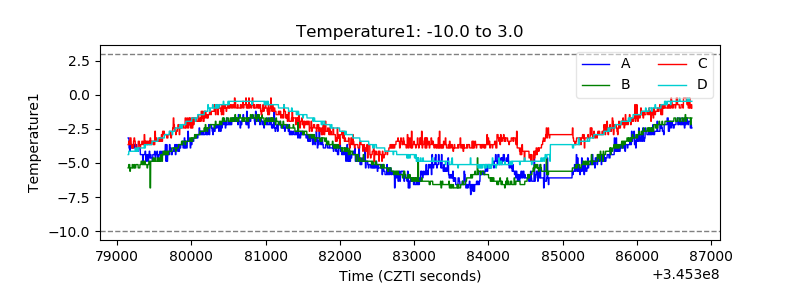 |
| Veto HV Monitor | 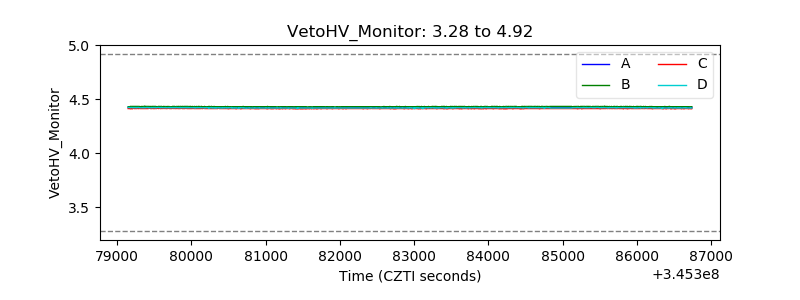 |
| Veto LLD | 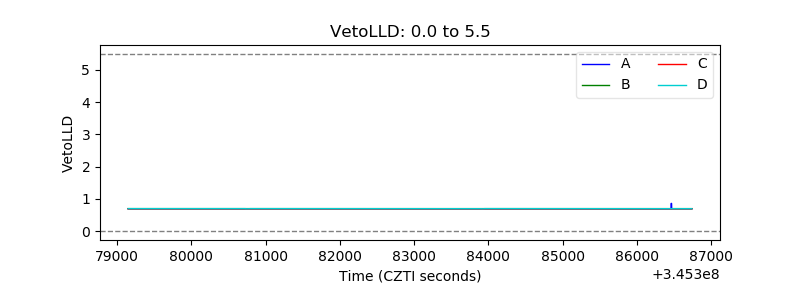 |
| Alpha Counter | 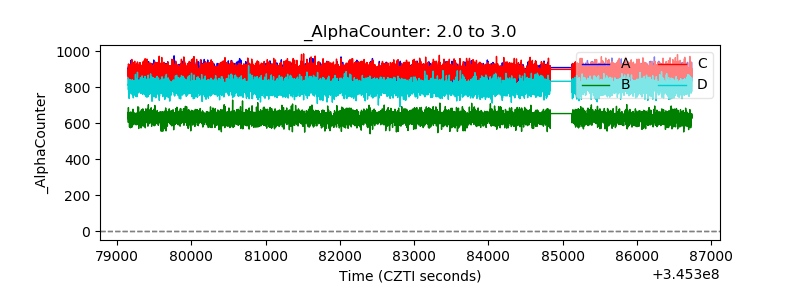 |
| _CPM_Rate | 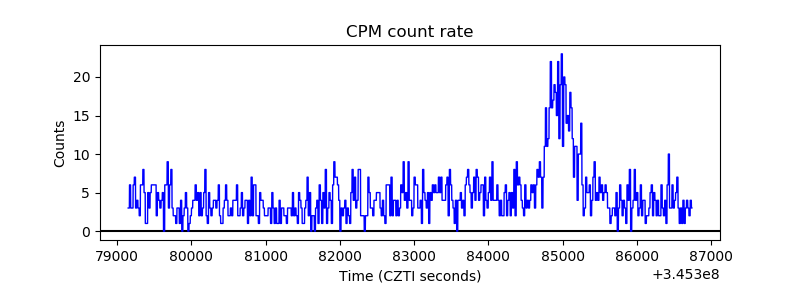 |
| CZT Counter | 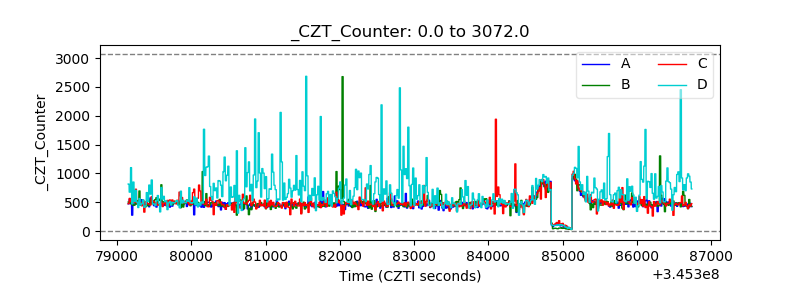 |
| +2.5 Volts monitor |  |
| +5 Volts monitor |  |
| _ROLL_ROT |  |
| _Roll_DEC | 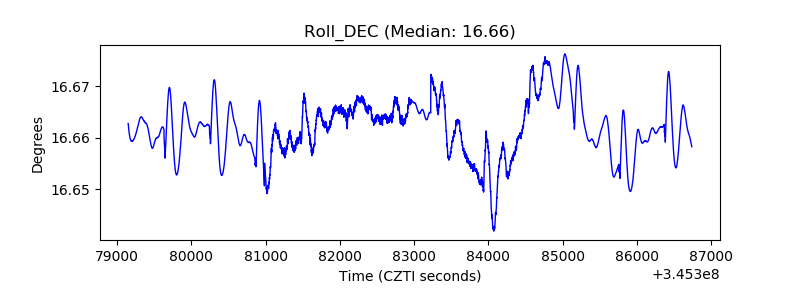 |
| _Roll_RA | 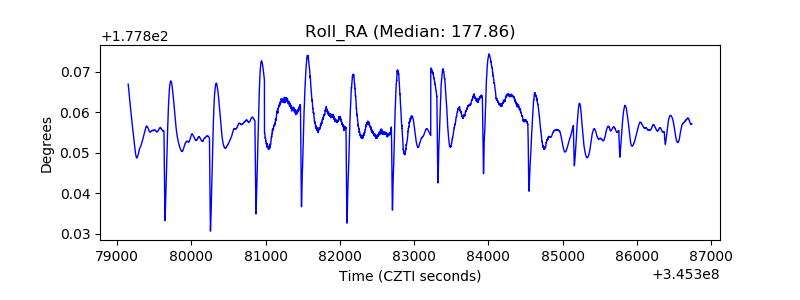 |
| Veto Counter | 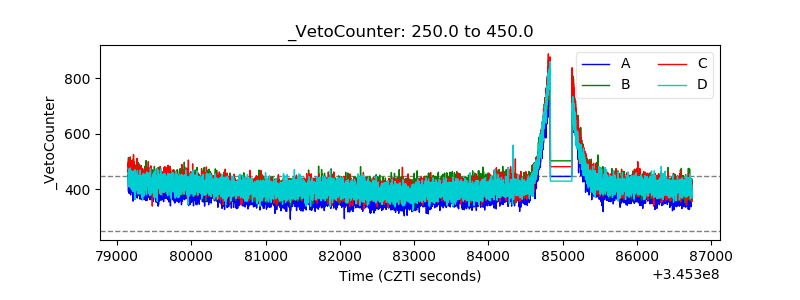 |