| Param | Original file | Final file |
|---|---|---|
| Filename | modeM0/AS1A10_045T04_9000004066_28144cztM0_level2.evt | modeM0/AS1A10_045T04_9000004066_28144cztM0_level2_quad_clean.evt |
| Size (bytes) | 587,442,240 | 89,853,120 |
| Size | 560.2 MB | 85.7 MB |
| Events in quadrant A | 3,776,776 | 556,846 |
| Events in quadrant B | 4,426,853 | 559,395 |
| Events in quadrant C | 3,822,338 | 540,228 |
| Events in quadrant D | 5,242,289 | 528,284 |
| Mode M0 | |||
|---|---|---|---|
| Quadrant | BADHDUFLAG | Total packets | Discarded packets |
| A | 0 | 16139 | 0 |
| B | 0 | 18072 | 0 |
| C | 0 | 16213 | 0 |
| D | 0 | 20742 | 0 |
| Mode M9 | |||
|---|---|---|---|
| Quadrant | BADHDUFLAG | Total packets | Discarded packets |
| A | 0 | 3 | 0 |
| B | 0 | 4 | 0 |
| C | 0 | 4 | 0 |
| D | 0 | 4 | 0 |
| Quadrant | Total seconds | Saturated seconds | Saturation percentage |
|---|---|---|---|
| A | 7704 | 194 | 2.518172% |
| B | 7704 | 331 | 4.296469% |
| C | 7704 | 258 | 3.348910% |
| D | 7704 | 288 | 3.738318% |
Noise dominated data is calculated using 1-second bins in cleaned event files. If a bin has >2000 counts, and if more than 50% of those come from <1% of pixels, then it is considered to be noise-dominated and hence unusable.
| Quadrant | # 1 sec bins | Bins with >0 counts | Bins with >2000 counts | High rate bins dominated by noise | Noise dominated (total time) | Noise dominated (detector-on time) | Marked lightcurve |
|---|---|---|---|---|---|---|---|
| A | 7884 | 7704 | 0 | 0 | 0.00% | 0.00% | 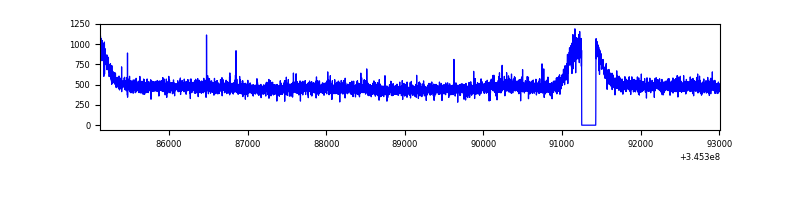 |
| B | 7884 | 7704 | 48 | 48 | 0.61% | 0.62% | 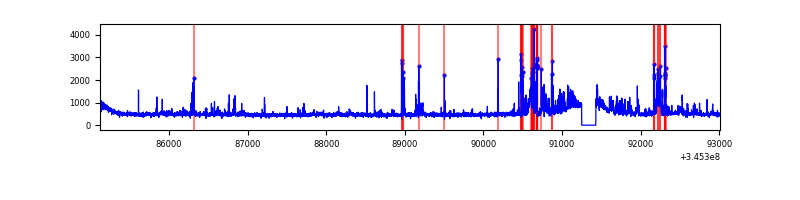 |
| C | 7884 | 7704 | 0 | 0 | 0.00% | 0.00% | 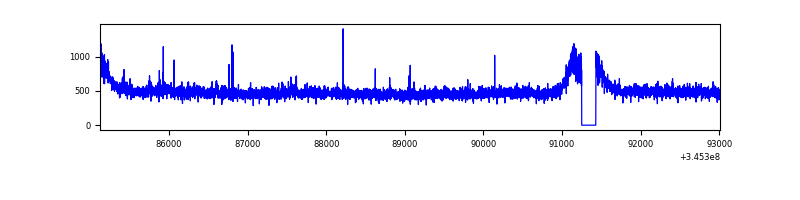 |
| D | 7884 | 7704 | 107 | 107 | 1.36% | 1.39% | 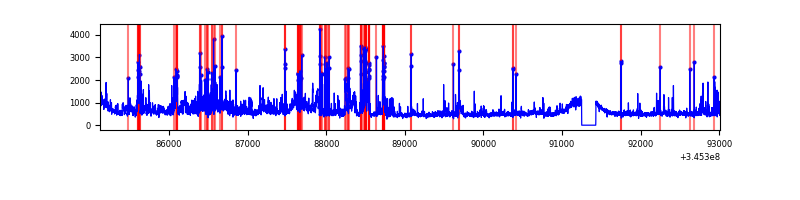 |
Top three noisy pixels from each quadrant. If the there are fewer than three noisy pixels in the level2.evt file, extra rows are filled as -1
| Pixel properties | Quadrant properties | ||||||
|---|---|---|---|---|---|---|---|
| Quadrant | DetID | PixID | Counts | Sigma | Mean | Median | Sigma |
| A | 13 | 254 | 12572 | 58.61 | 975 | 955 | 198.2 |
| A | 3 | 137 | 9750 | 44.37 | 975 | 955 | 198.2 |
| A | 0 | 226 | 8235 | 36.73 | 975 | 955 | 198.2 |
| B | 10 | 245 | 454099 | 2419.78 | 956 | 927 | 187.3 |
| B | 4 | 80 | 121461 | 643.61 | 956 | 927 | 187.3 |
| B | 10 | 246 | 64330 | 338.55 | 956 | 927 | 187.3 |
| C | 14 | 238 | 146771 | 660.71 | 933 | 937 | 220.7 |
| C | 3 | 233 | 26496 | 115.8 | 933 | 937 | 220.7 |
| C | 15 | 208 | 10863 | 44.97 | 933 | 937 | 220.7 |
| D | 1 | 52 | 701881 | 3066.39 | 946 | 920 | 228.6 |
| D | 7 | 223 | 288654 | 1258.71 | 946 | 920 | 228.6 |
| D | 2 | 250 | 203937 | 888.11 | 946 | 920 | 228.6 |
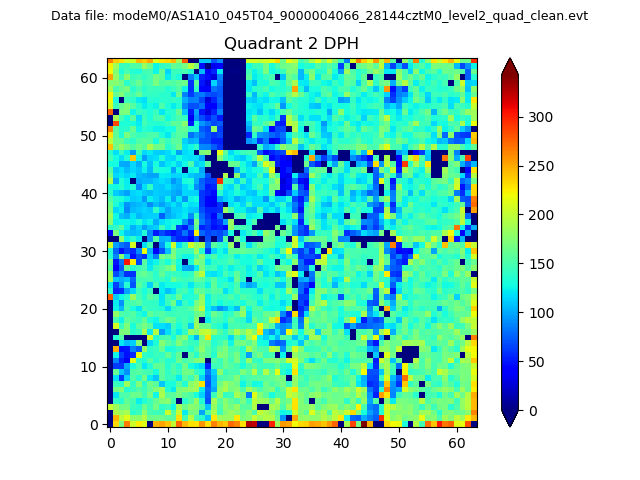
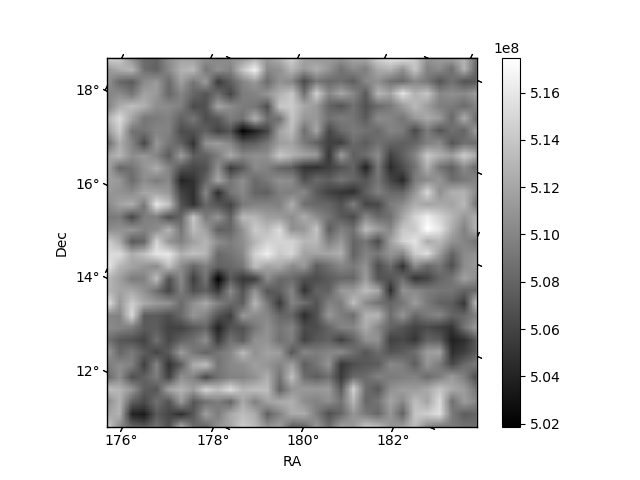
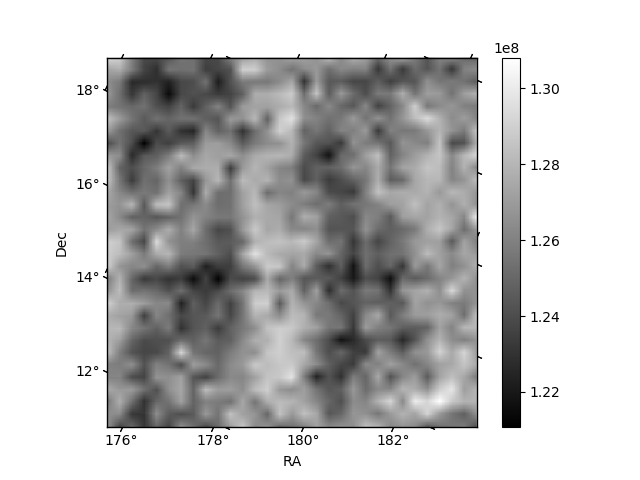
Histogram calculated using DETX and DETY for each event in the final _common_clean file
| Quadrant A | 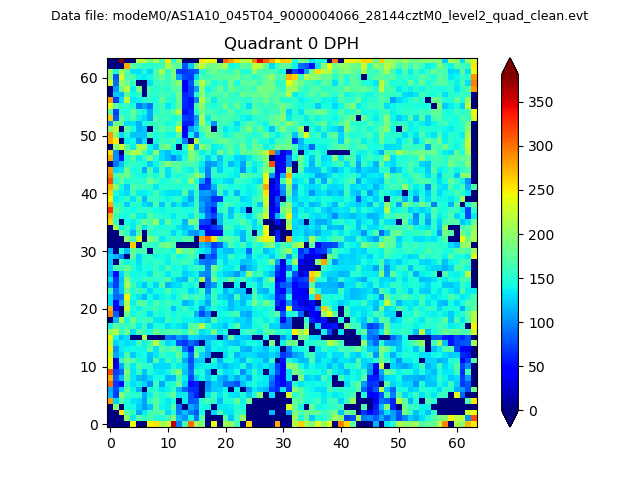 |
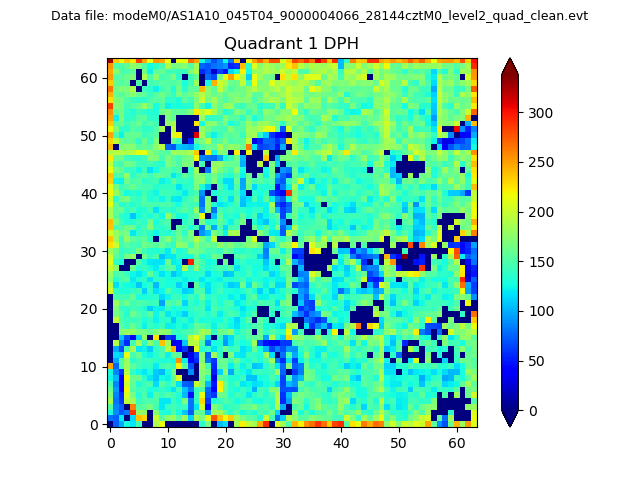 |
Quadrant B |
|---|---|---|---|
| Quadrant D | 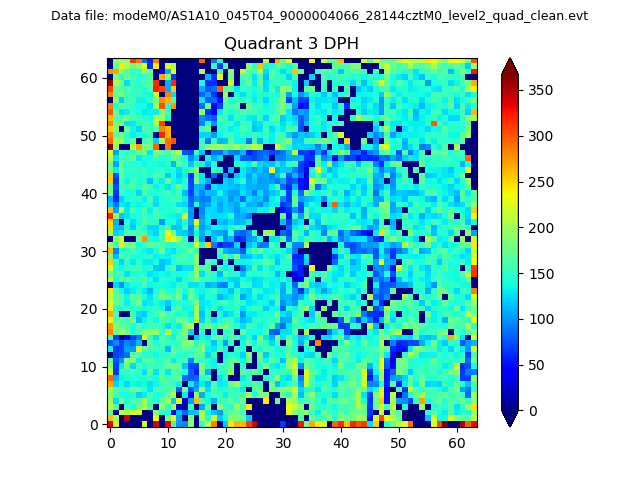 |
 |
Quadrant C |
| Plot type | Count rate plots | Images |
|---|---|---|
| Comparison with Poisson distribution Blue bars denote a histogram of data divided into 1 sec bins. Red curve is a Poisson curve with rate = median count rate of data. |
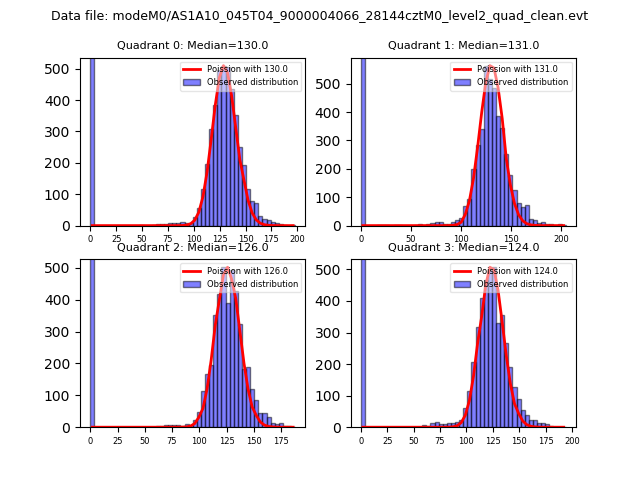 |
 |
| Quadrant-wise count rates Data is divided into 100 sec bins |
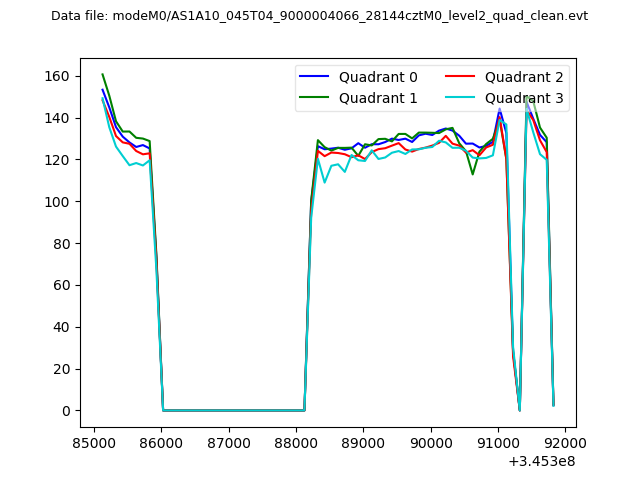 |
|
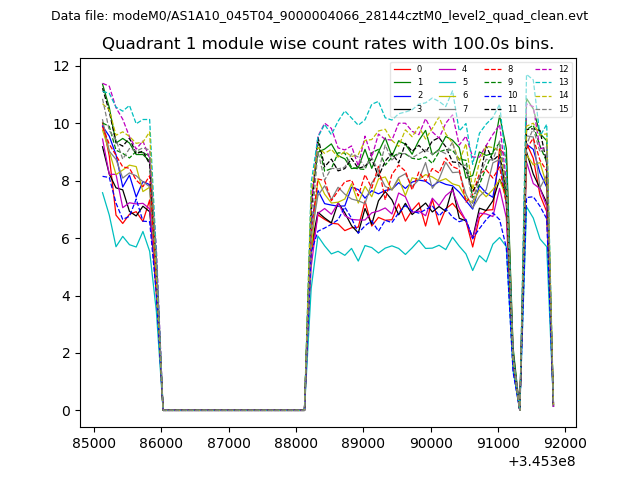
| Module-wise count rates for Quadrant A Data is divided into 100 sec bins |
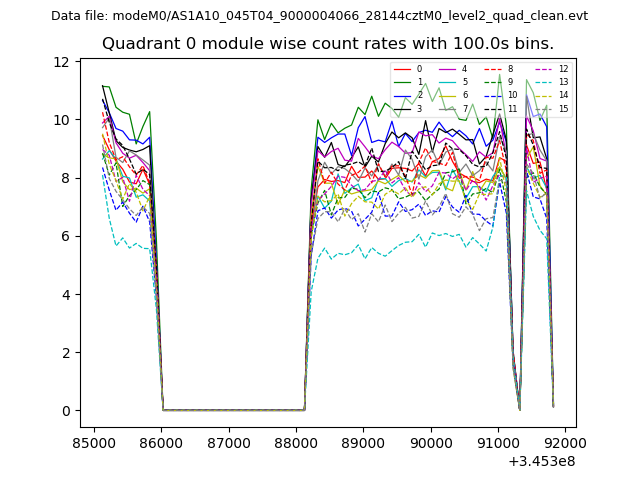 |
 |
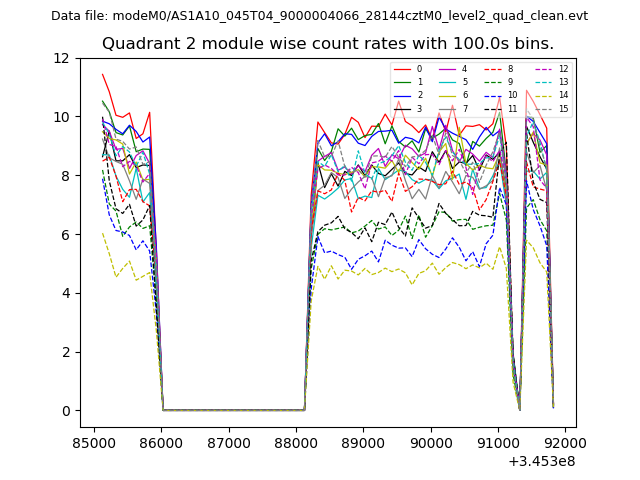
| Module-wise count rates for Quadrant B Data is divided into 100 sec bins |
 |
 |
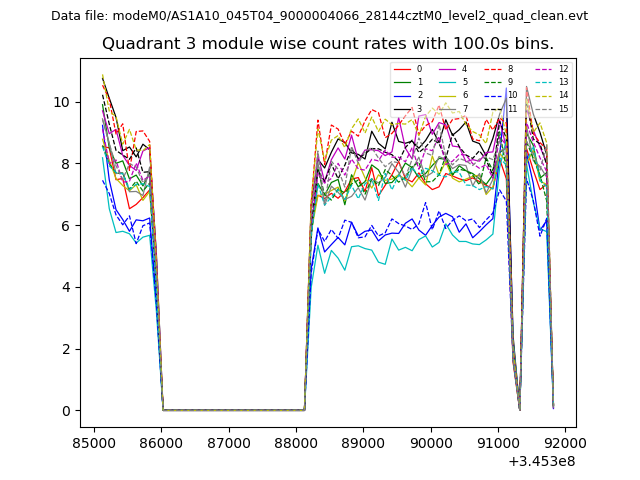
| Module-wise count rates for Quadrant C Data is divided into 100 sec bins |
 |
 |
| Module-wise count rates for Quadrant D Data is divided into 100 sec bins |
 |
 |
| Parameter | Plot |
|---|---|
| CZT HV Monitor | 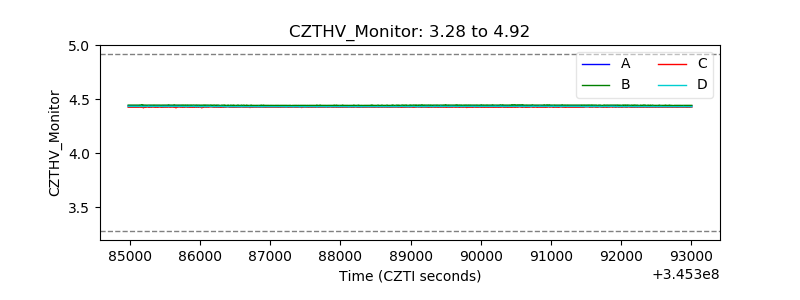 |
| D_VDD |  |
| Temperature 1 |  |
| Veto HV Monitor | 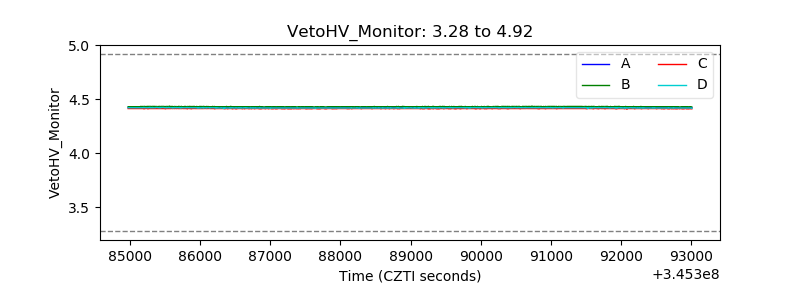 |
| Veto LLD | 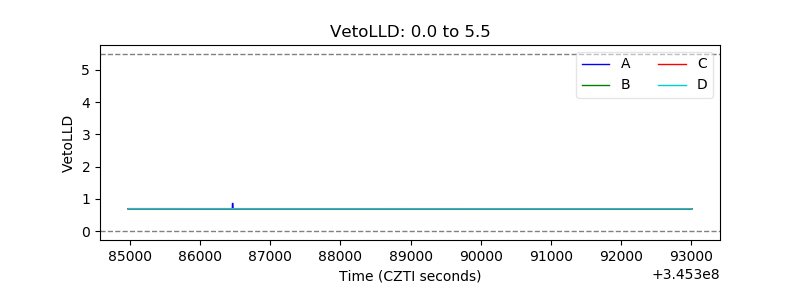 |
| Alpha Counter | 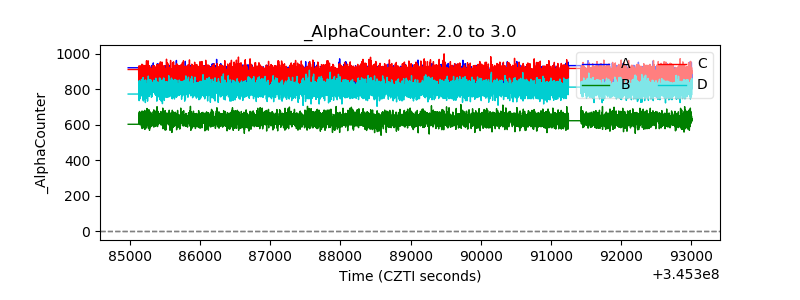 |
| _CPM_Rate | 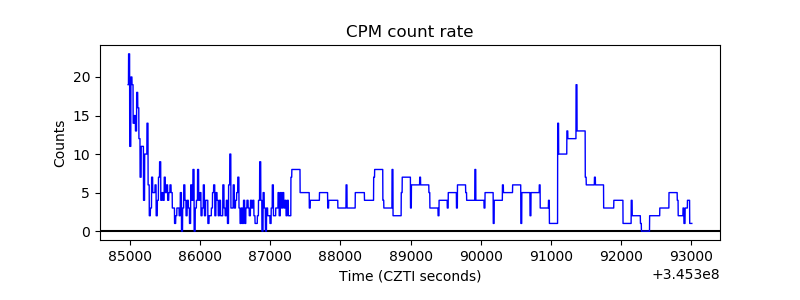 |
| CZT Counter | 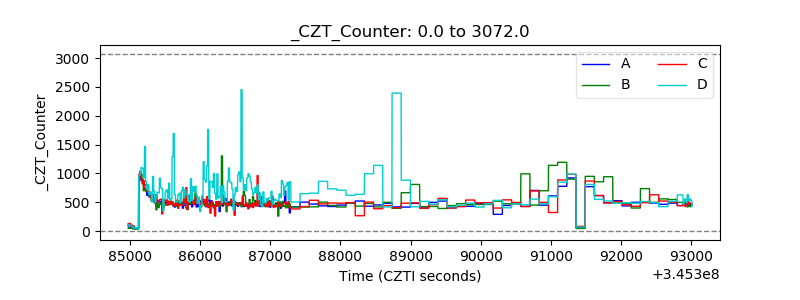 |
| +2.5 Volts monitor |  |
| +5 Volts monitor | 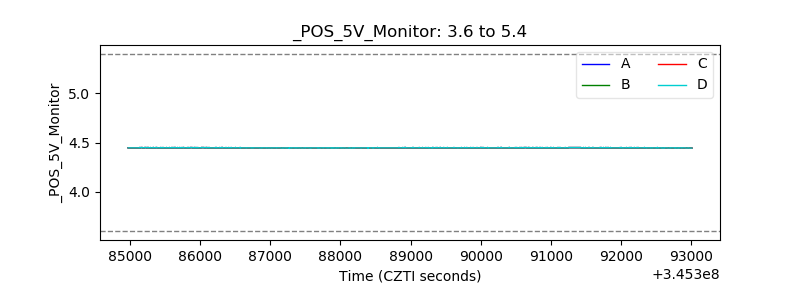 |
| _ROLL_ROT | 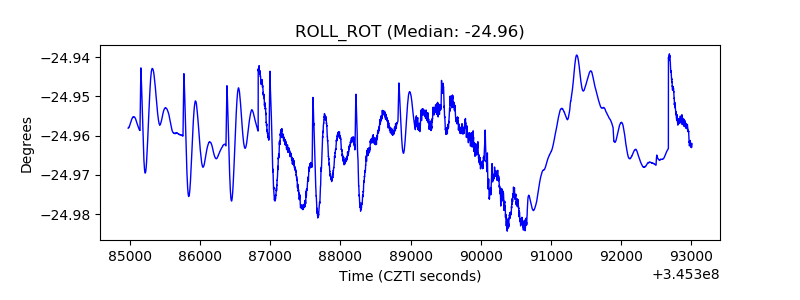 |
| _Roll_DEC | 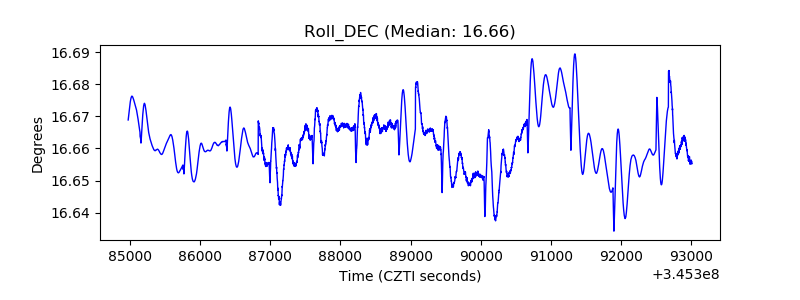 |
| _Roll_RA | 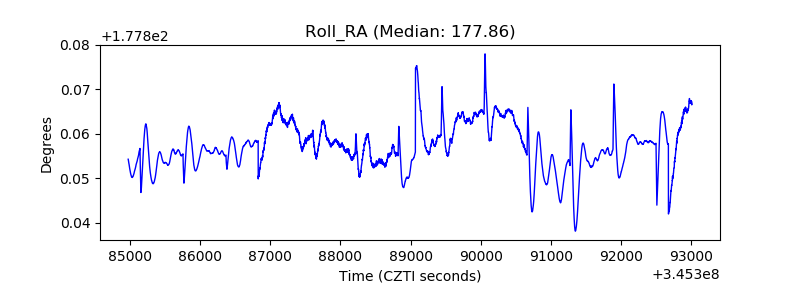 |
| Veto Counter | 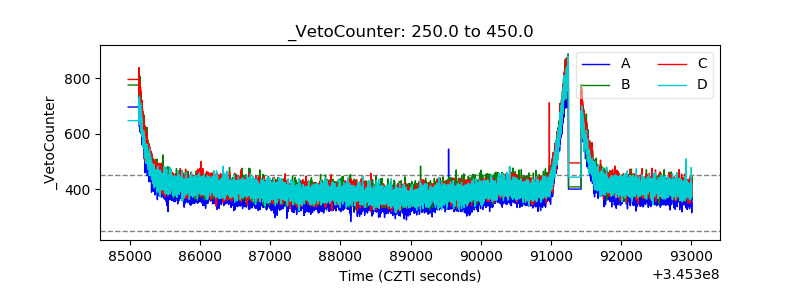 |