| Param | Original file | Final file |
|---|---|---|
| Filename | modeM0/AS1A10_045T04_9000004066_28145cztM0_level2.evt | modeM0/AS1A10_045T04_9000004066_28145cztM0_level2_quad_clean.evt |
| Size (bytes) | 562,593,600 | 78,681,600 |
| Size | 536.5 MB | 75.0 MB |
| Events in quadrant A | 3,638,600 | 472,167 |
| Events in quadrant B | 4,545,846 | 476,025 |
| Events in quadrant C | 3,725,280 | 457,829 |
| Events in quadrant D | 4,616,744 | 451,467 |
| Mode M0 | |||
|---|---|---|---|
| Quadrant | BADHDUFLAG | Total packets | Discarded packets |
| A | 0 | 15627 | 0 |
| B | 0 | 18287 | 0 |
| C | 0 | 15818 | 0 |
| D | 0 | 18704 | 0 |
| Mode M9 | |||
|---|---|---|---|
| Quadrant | BADHDUFLAG | Total packets | Discarded packets |
| A | 0 | 4 | 0 |
| B | 0 | 5 | 0 |
| C | 0 | 5 | 0 |
| D | 0 | 5 | 0 |
| Quadrant | Total seconds | Saturated seconds | Saturation percentage |
|---|---|---|---|
| A | 7548 | 70 | 0.927398% |
| B | 7548 | 223 | 2.954425% |
| C | 7547 | 148 | 1.961044% |
| D | 7547 | 127 | 1.682788% |
Noise dominated data is calculated using 1-second bins in cleaned event files. If a bin has >2000 counts, and if more than 50% of those come from <1% of pixels, then it is considered to be noise-dominated and hence unusable.
| Quadrant | # 1 sec bins | Bins with >0 counts | Bins with >2000 counts | High rate bins dominated by noise | Noise dominated (total time) | Noise dominated (detector-on time) | Marked lightcurve |
|---|---|---|---|---|---|---|---|
| A | 7943 | 7549 | 1 | 1 | 0.01% | 0.01% | 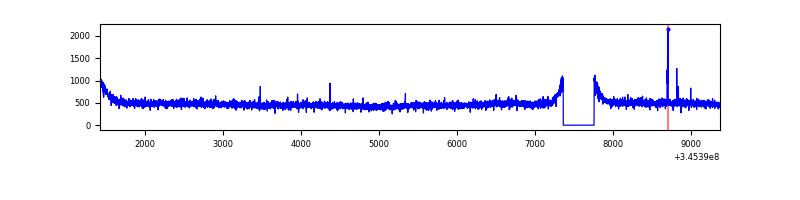 |
| B | 7943 | 7549 | 48 | 48 | 0.60% | 0.64% | 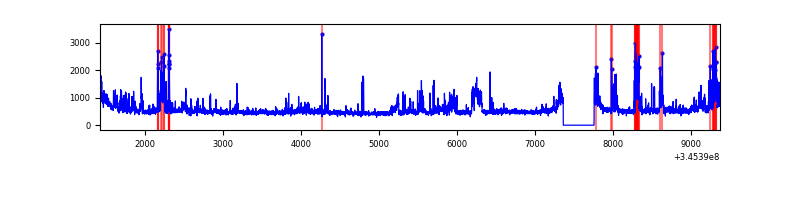 |
| C | 7942 | 7548 | 0 | 0 | 0.00% | 0.00% | 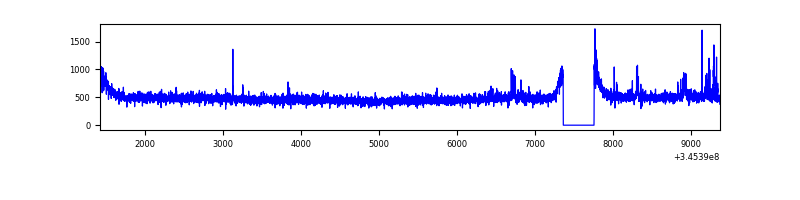 |
| D | 7942 | 7548 | 64 | 64 | 0.81% | 0.85% | 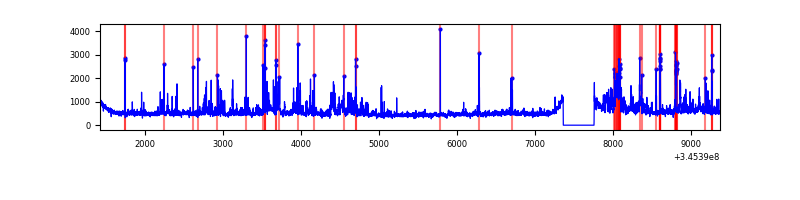 |
Top three noisy pixels from each quadrant. If the there are fewer than three noisy pixels in the level2.evt file, extra rows are filled as -1
| Pixel properties | Quadrant properties | ||||||
|---|---|---|---|---|---|---|---|
| Quadrant | DetID | PixID | Counts | Sigma | Mean | Median | Sigma |
| A | 15 | 174 | 18079 | 90.35 | 938 | 918 | 189.9 |
| A | 13 | 254 | 12591 | 61.45 | 938 | 918 | 189.9 |
| A | 3 | 137 | 9258 | 43.91 | 938 | 918 | 189.9 |
| B | 10 | 245 | 861545 | 4798.24 | 921 | 896 | 179.4 |
| B | 10 | 246 | 39549 | 215.5 | 921 | 896 | 179.4 |
| B | 12 | 111 | 22359 | 119.66 | 921 | 896 | 179.4 |
| C | 14 | 238 | 141508 | 661.62 | 897 | 903 | 212.5 |
| C | 2 | 16 | 63123 | 292.78 | 897 | 903 | 212.5 |
| C | 3 | 233 | 22116 | 99.82 | 897 | 903 | 212.5 |
| D | 1 | 52 | 505541 | 2311.01 | 907 | 881 | 218.4 |
| D | 5 | 222 | 233144 | 1063.61 | 907 | 881 | 218.4 |
| D | 8 | 195 | 122258 | 555.83 | 907 | 881 | 218.4 |
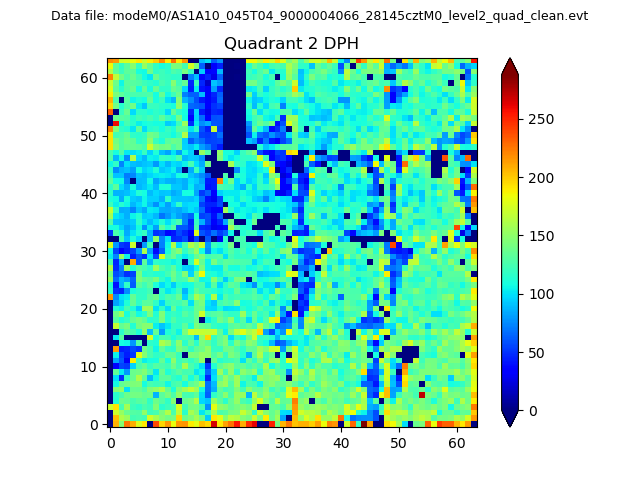
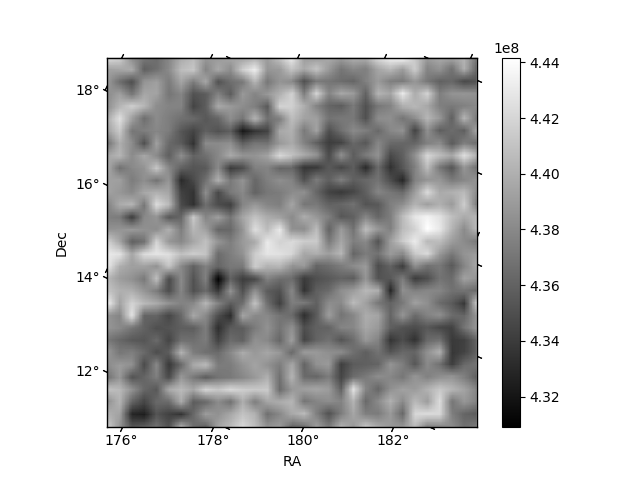
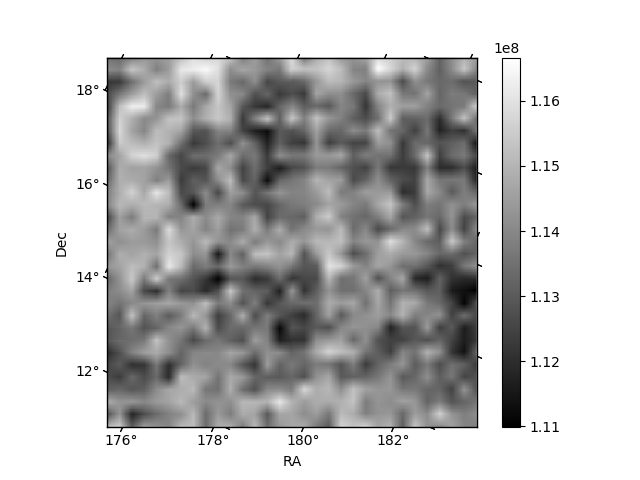
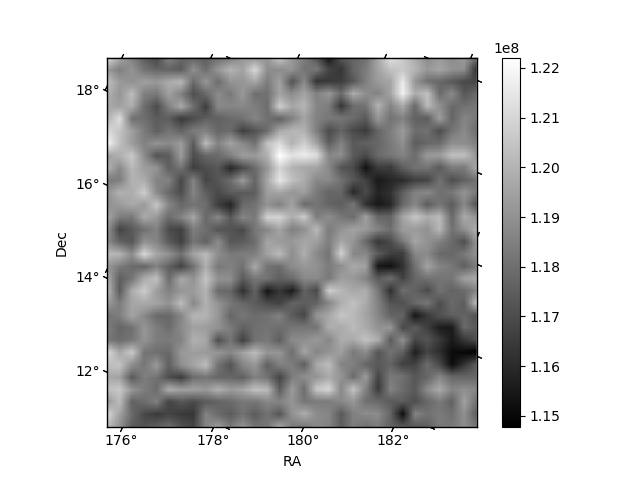
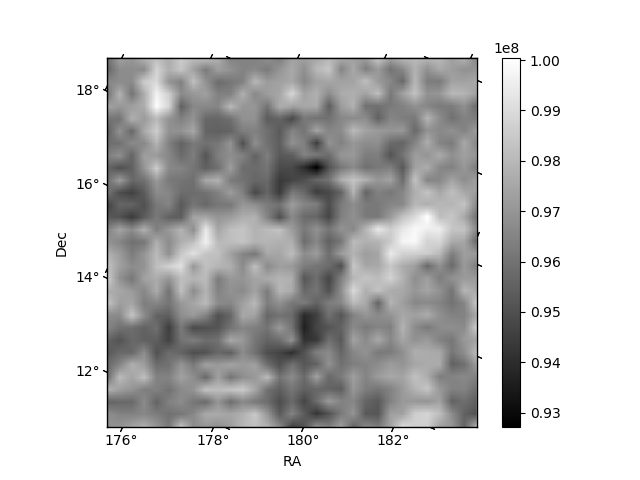
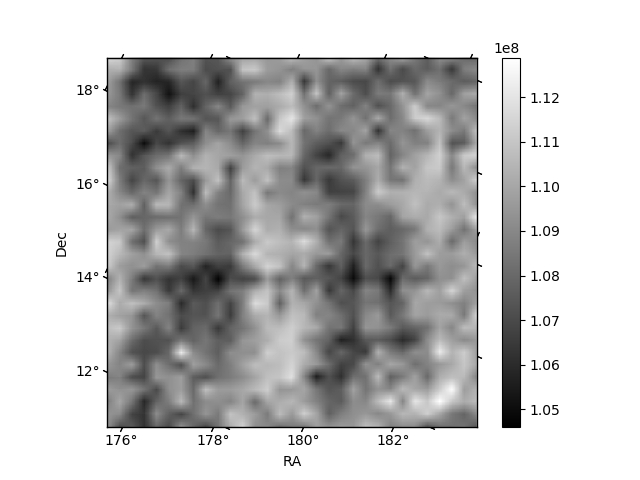
Histogram calculated using DETX and DETY for each event in the final _common_clean file
| Quadrant A | 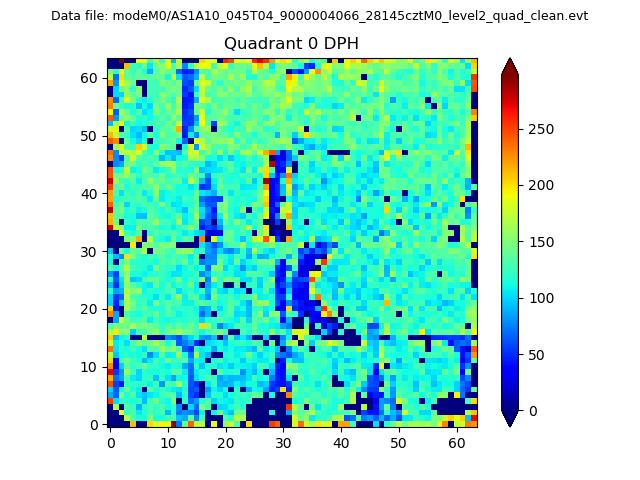 |
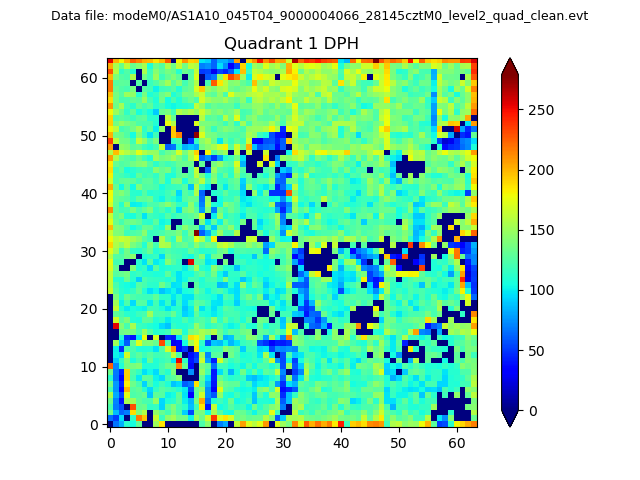 |
Quadrant B |
|---|---|---|---|
| Quadrant D | 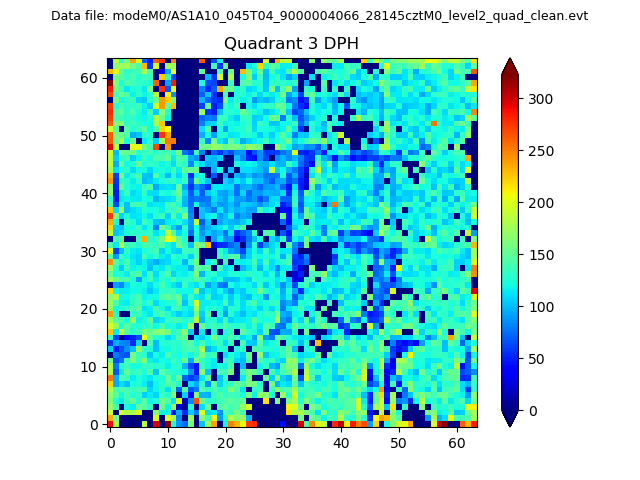 |
 |
Quadrant C |
| Plot type | Count rate plots | Images |
|---|---|---|
| Comparison with Poisson distribution Blue bars denote a histogram of data divided into 1 sec bins. Red curve is a Poisson curve with rate = median count rate of data. |
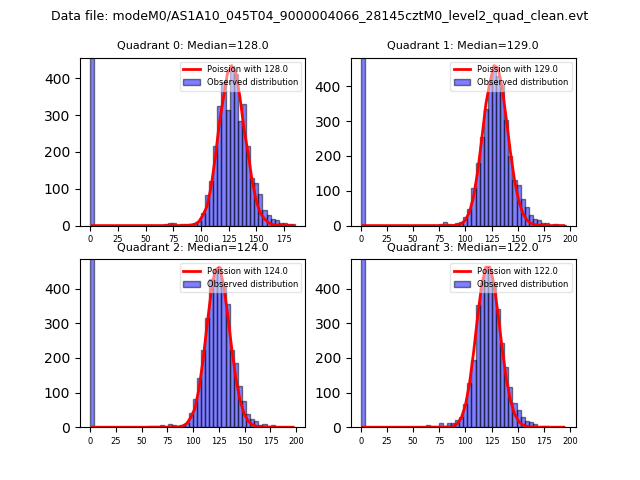 |
 |
| Quadrant-wise count rates Data is divided into 100 sec bins |
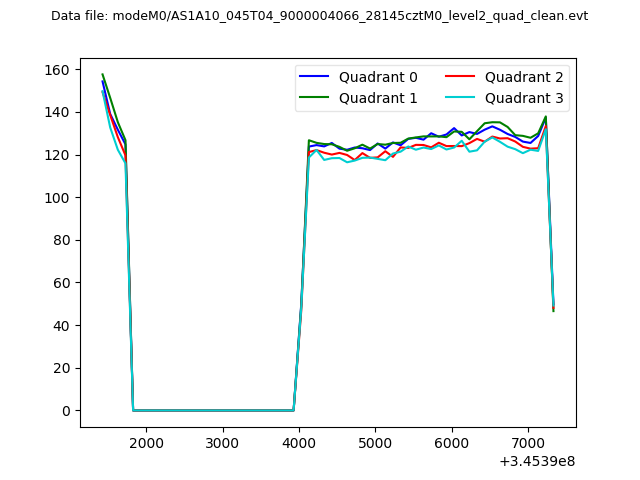 |
|
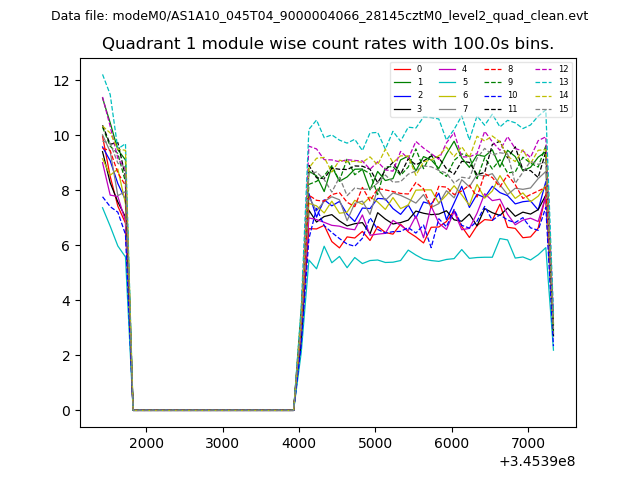
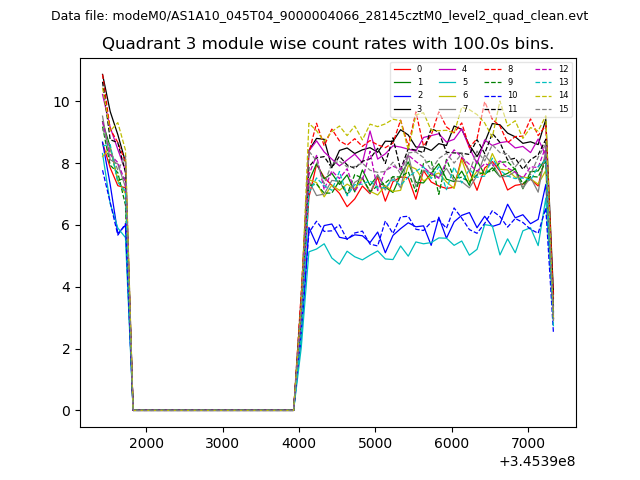
| Module-wise count rates for Quadrant A Data is divided into 100 sec bins |
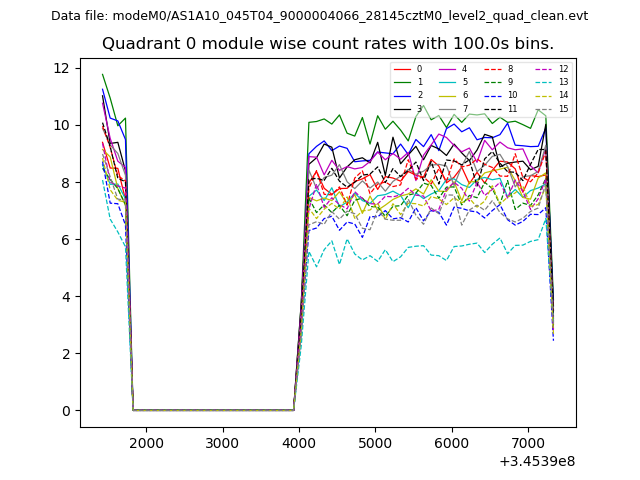 |
 |
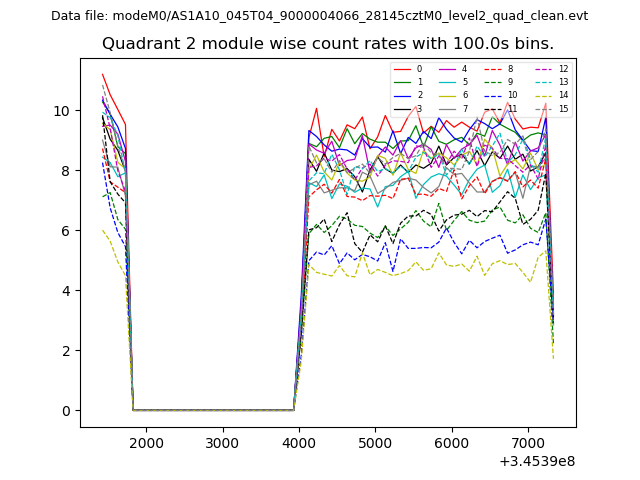
| Module-wise count rates for Quadrant B Data is divided into 100 sec bins |
 |
 |
| Module-wise count rates for Quadrant C Data is divided into 100 sec bins |
 |
 |
| Module-wise count rates for Quadrant D Data is divided into 100 sec bins |
 |
 |
| Parameter | Plot |
|---|---|
| CZT HV Monitor | 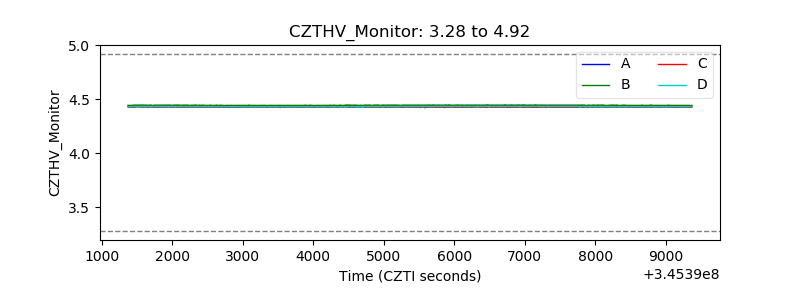 |
| D_VDD | 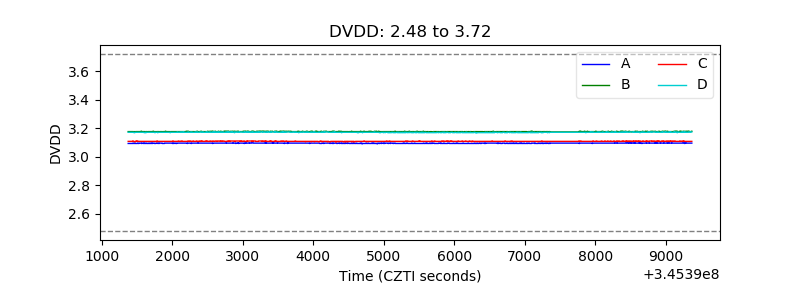 |
| Temperature 1 | 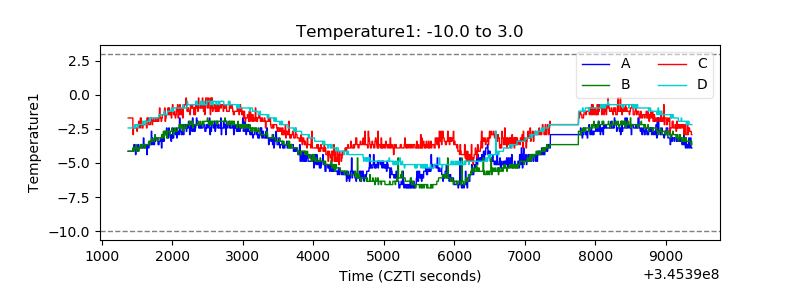 |
| Veto HV Monitor | 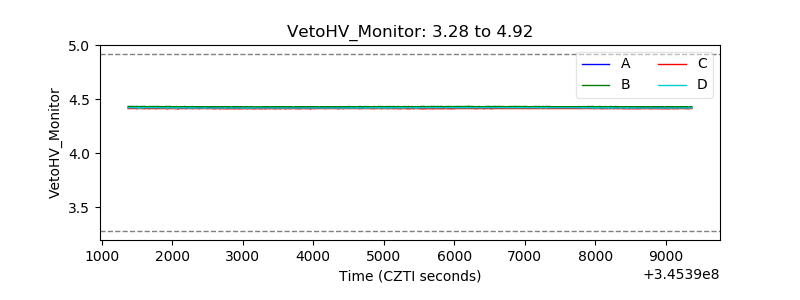 |
| Veto LLD | 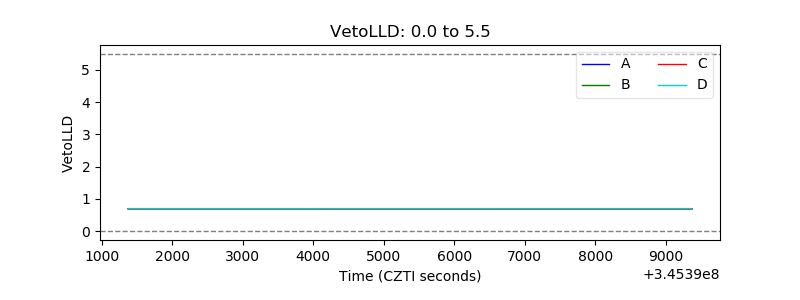 |
| Alpha Counter | 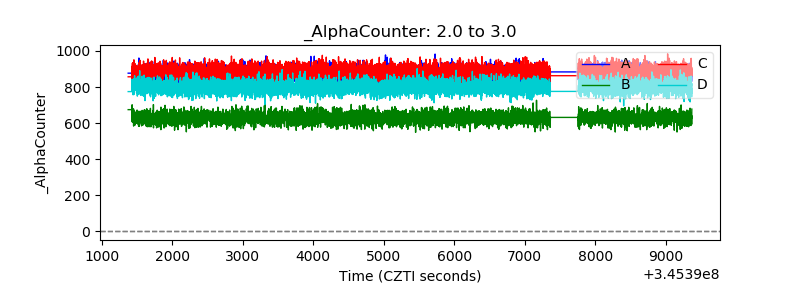 |
| _CPM_Rate | 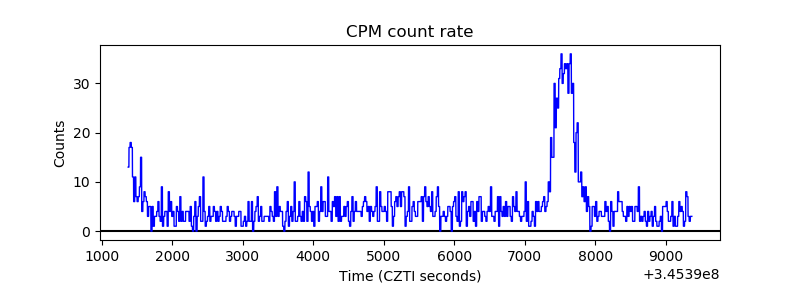 |
| CZT Counter | 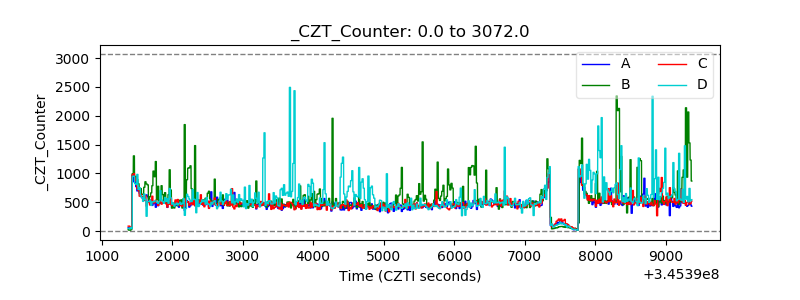 |
| +2.5 Volts monitor |  |
| +5 Volts monitor |  |
| _ROLL_ROT | 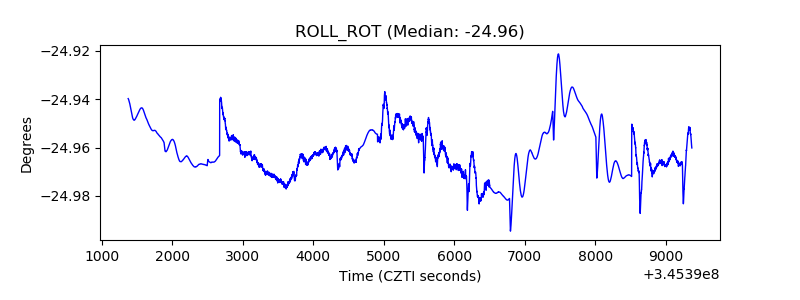 |
| _Roll_DEC | 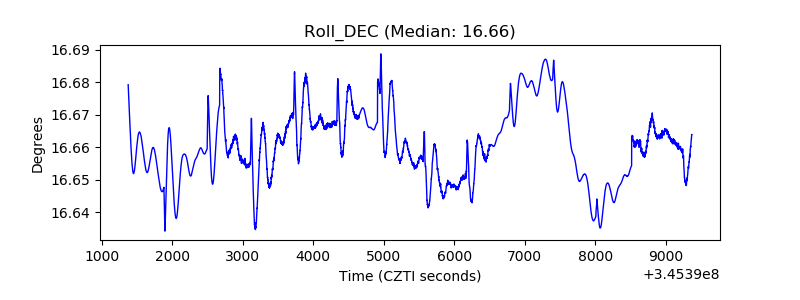 |
| _Roll_RA | 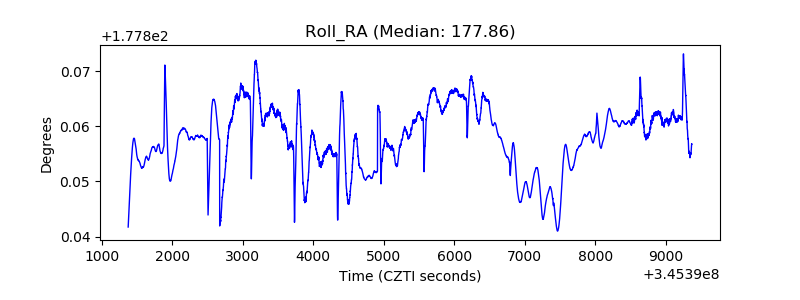 |
| Veto Counter | 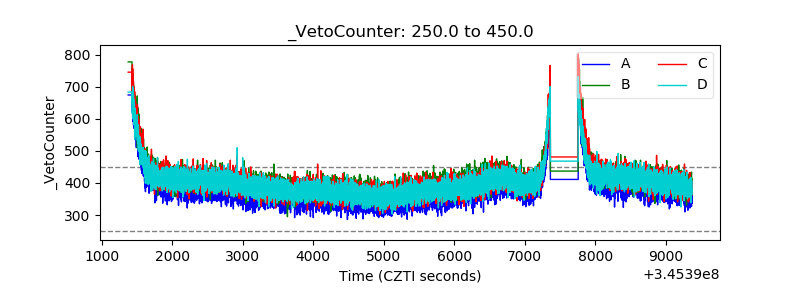 |