| Param | Original file | Final file |
|---|---|---|
| Filename | modeM0/AS1A10_045T04_9000004066_28148cztM0_level2.evt | modeM0/AS1A10_045T04_9000004066_28148cztM0_level2_quad_clean.evt |
| Size (bytes) | 508,512,960 | 82,157,760 |
| Size | 485.0 MB | 78.4 MB |
| Events in quadrant A | 3,177,784 | 519,017 |
| Events in quadrant B | 3,396,383 | 522,633 |
| Events in quadrant C | 3,358,197 | 504,899 |
| Events in quadrant D | 5,013,122 | 474,034 |
| Mode M0 | |||
|---|---|---|---|
| Quadrant | BADHDUFLAG | Total packets | Discarded packets |
| A | 0 | 13749 | 0 |
| B | 0 | 14303 | 0 |
| C | 0 | 14211 | 0 |
| D | 0 | 19456 | 0 |
| Mode M9 | |||
|---|---|---|---|
| Quadrant | BADHDUFLAG | Total packets | Discarded packets |
| A | 0 | 9 | 0 |
| B | 0 | 9 | 0 |
| C | 0 | 9 | 0 |
| D | 0 | 9 | 0 |
| Quadrant | Total seconds | Saturated seconds | Saturation percentage |
|---|---|---|---|
| A | 6700 | 39 | 0.582090% |
| B | 6700 | 100 | 1.492537% |
| C | 6700 | 84 | 1.253731% |
| D | 6700 | 549 | 8.194030% |
Noise dominated data is calculated using 1-second bins in cleaned event files. If a bin has >2000 counts, and if more than 50% of those come from <1% of pixels, then it is considered to be noise-dominated and hence unusable.
| Quadrant | # 1 sec bins | Bins with >0 counts | Bins with >2000 counts | High rate bins dominated by noise | Noise dominated (total time) | Noise dominated (detector-on time) | Marked lightcurve |
|---|---|---|---|---|---|---|---|
| A | 7565 | 6701 | 0 | 0 | 0.00% | 0.00% | 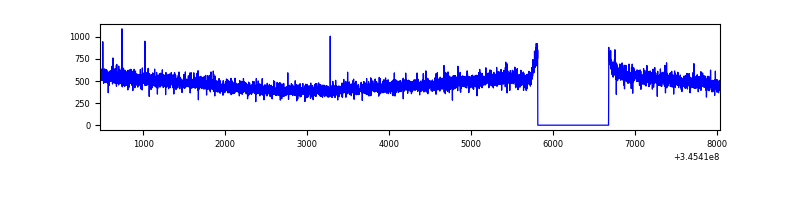 |
| B | 7565 | 6701 | 49 | 49 | 0.65% | 0.73% | 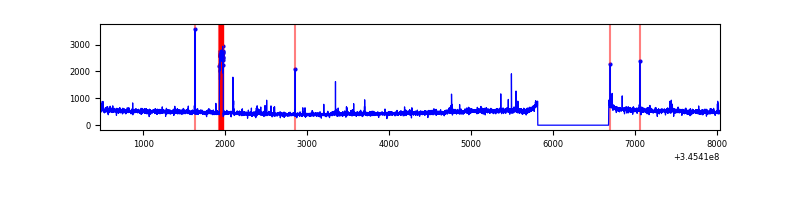 |
| C | 7565 | 6701 | 2 | 2 | 0.03% | 0.03% | 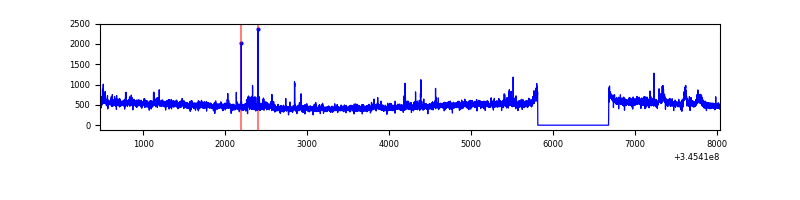 |
| D | 7565 | 6701 | 443 | 443 | 5.86% | 6.61% | 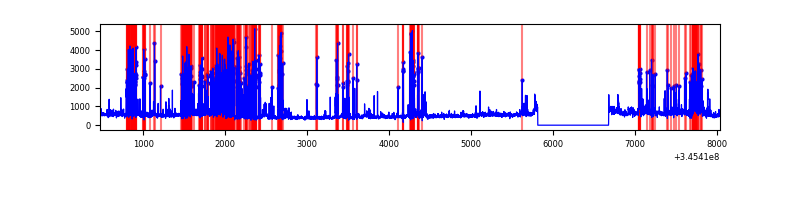 |
Top three noisy pixels from each quadrant. If the there are fewer than three noisy pixels in the level2.evt file, extra rows are filled as -1
| Pixel properties | Quadrant properties | ||||||
|---|---|---|---|---|---|---|---|
| Quadrant | DetID | PixID | Counts | Sigma | Mean | Median | Sigma |
| A | 13 | 254 | 11295 | 63.17 | 823 | 804 | 166.1 |
| A | 3 | 137 | 8179 | 44.41 | 823 | 804 | 166.1 |
| A | 0 | 226 | 7140 | 38.15 | 823 | 804 | 166.1 |
| B | 10 | 245 | 151214 | 950.8 | 814 | 795 | 158.2 |
| B | 12 | 111 | 19694 | 119.46 | 814 | 795 | 158.2 |
| B | 11 | 111 | 18180 | 109.89 | 814 | 795 | 158.2 |
| C | 14 | 238 | 126762 | 676.62 | 791 | 797 | 186.2 |
| C | 3 | 233 | 99739 | 531.46 | 791 | 797 | 186.2 |
| C | 2 | 16 | 31814 | 166.61 | 791 | 797 | 186.2 |
| D | 1 | 52 | 1386049 | 7501.62 | 769 | 746 | 184.7 |
| D | 8 | 195 | 256956 | 1387.41 | 769 | 746 | 184.7 |
| D | 2 | 250 | 174907 | 943.11 | 769 | 746 | 184.7 |
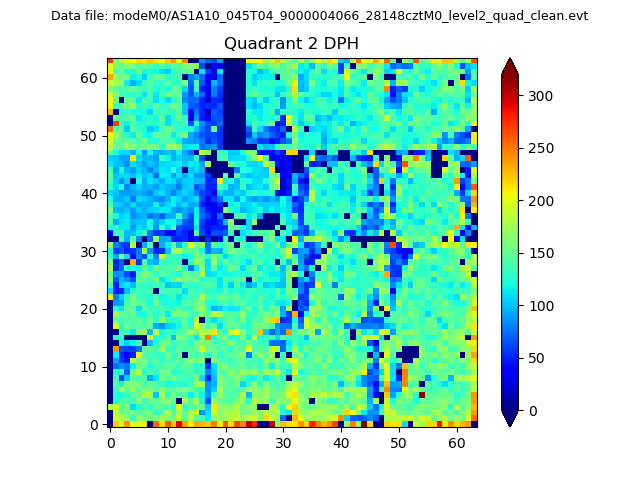
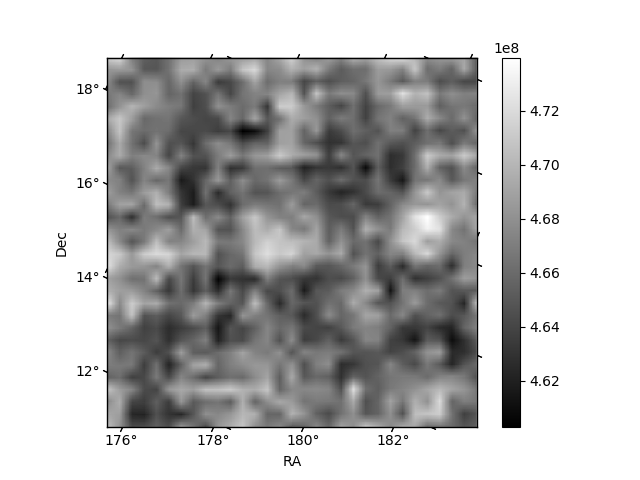
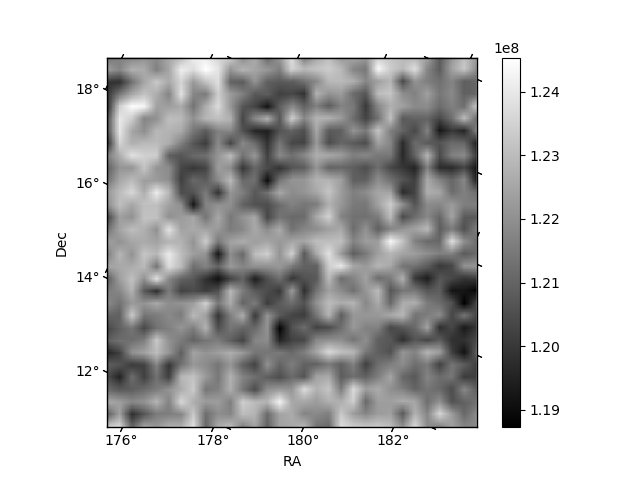
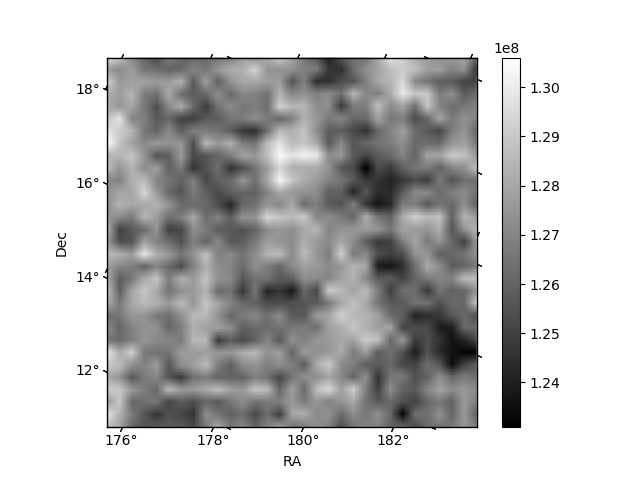
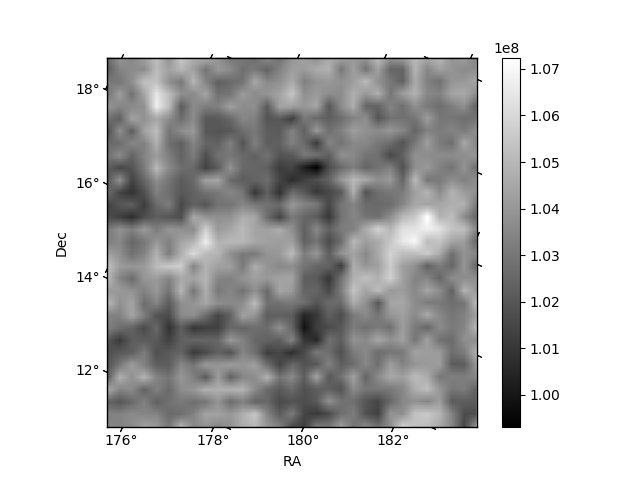
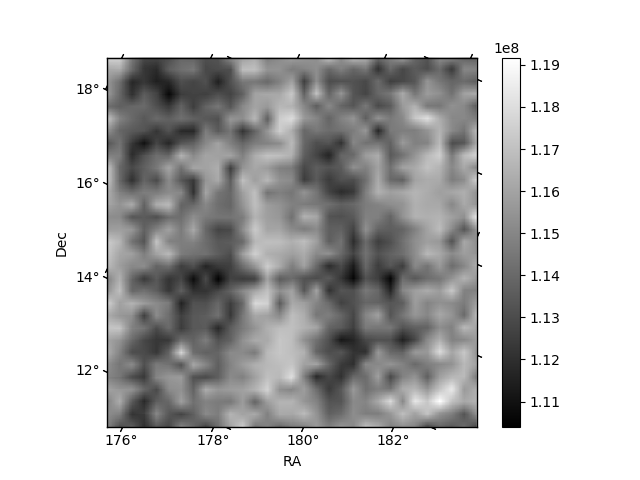
Histogram calculated using DETX and DETY for each event in the final _common_clean file
| Quadrant A | 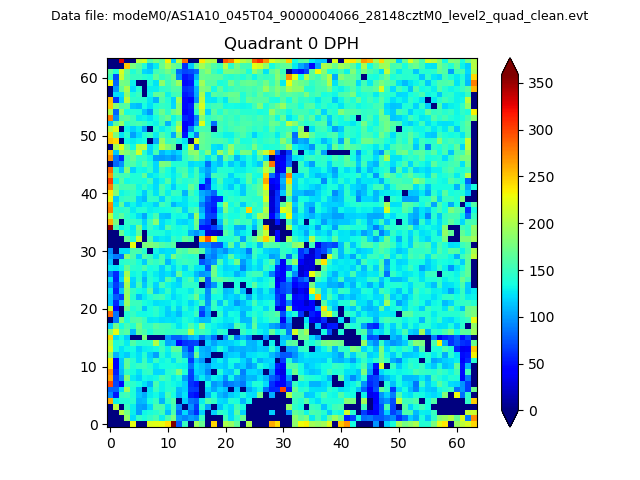 |
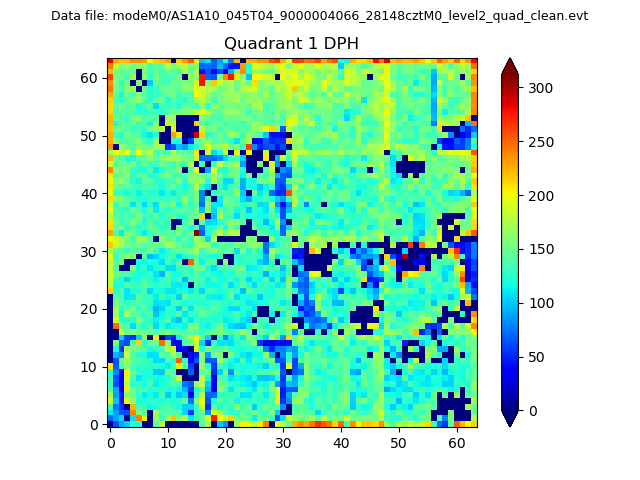 |
Quadrant B |
|---|---|---|---|
| Quadrant D | 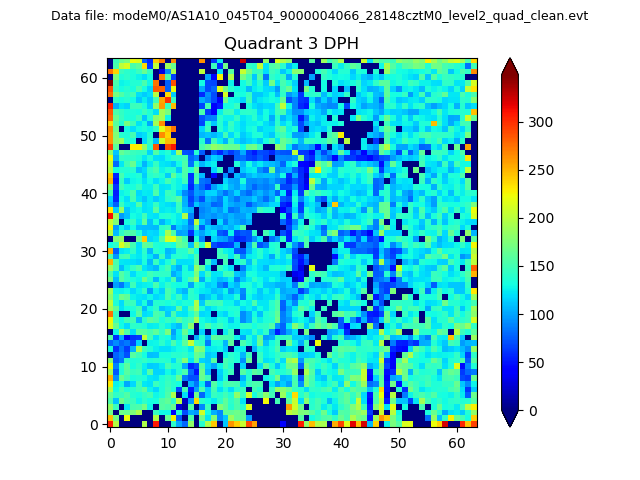 |
 |
Quadrant C |
| Plot type | Count rate plots | Images |
|---|---|---|
| Comparison with Poisson distribution Blue bars denote a histogram of data divided into 1 sec bins. Red curve is a Poisson curve with rate = median count rate of data. |
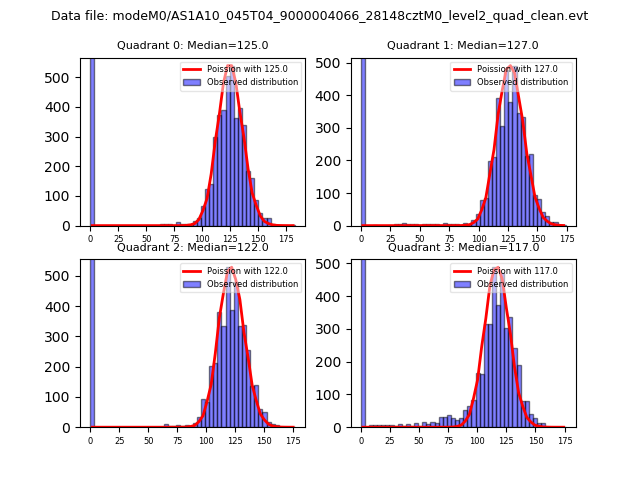 |
 |
| Quadrant-wise count rates Data is divided into 100 sec bins |
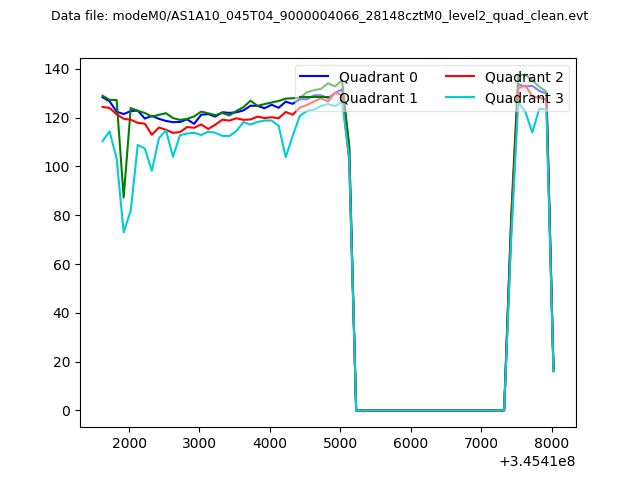 |
|
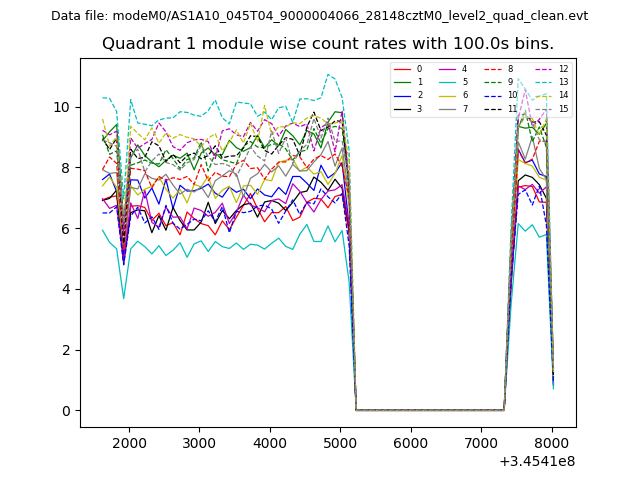
| Module-wise count rates for Quadrant A Data is divided into 100 sec bins |
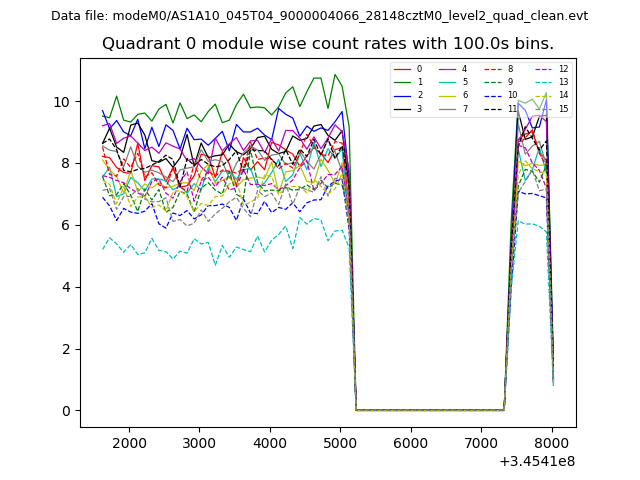 |
 |
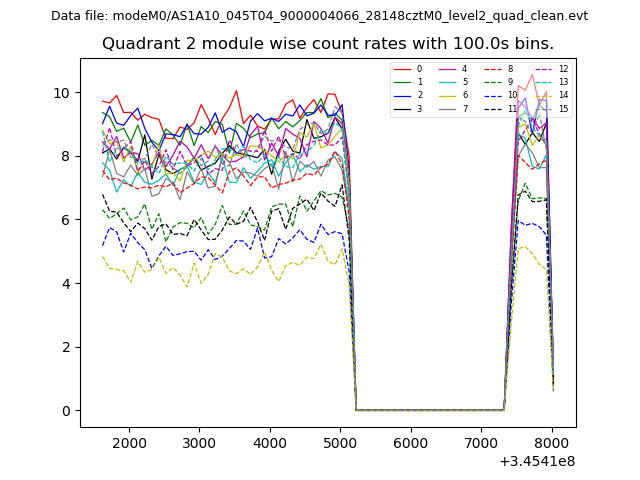
| Module-wise count rates for Quadrant B Data is divided into 100 sec bins |
 |
 |
| Module-wise count rates for Quadrant C Data is divided into 100 sec bins |
 |
 |
| Module-wise count rates for Quadrant D Data is divided into 100 sec bins |
 |
 |
| Parameter | Plot |
|---|---|
| CZT HV Monitor | 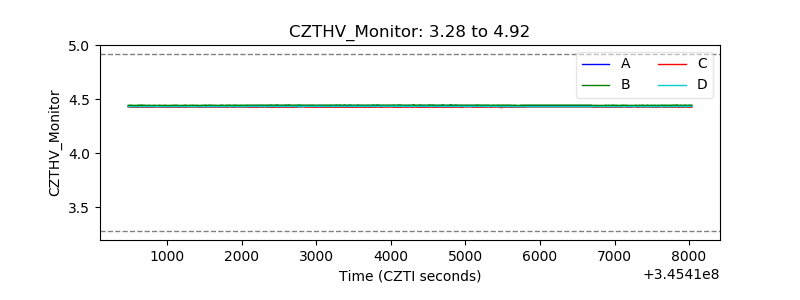 |
| D_VDD | 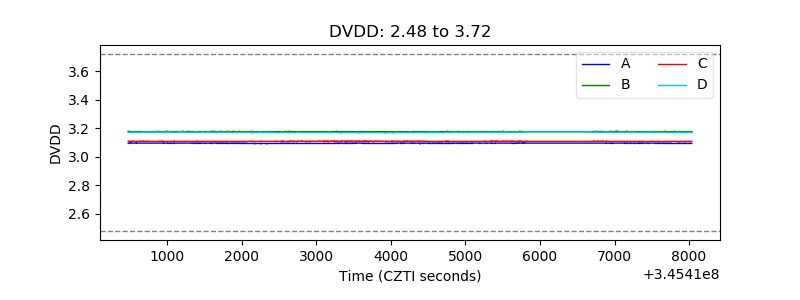 |
| Temperature 1 | 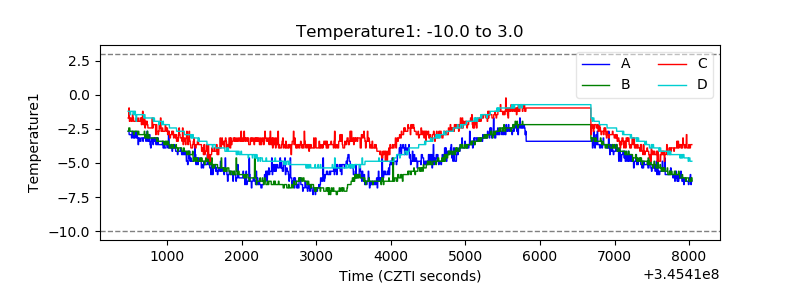 |
| Veto HV Monitor | 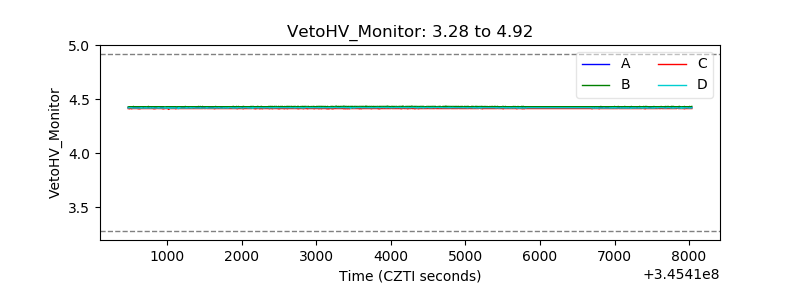 |
| Veto LLD |  |
| Alpha Counter | 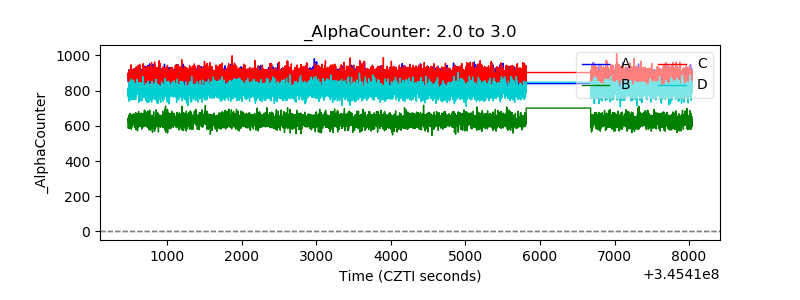 |
| _CPM_Rate | 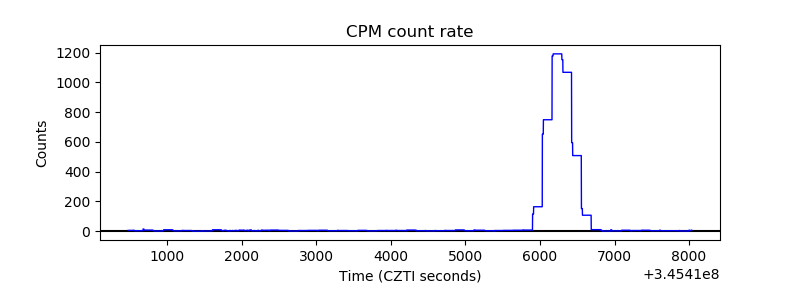 |
| CZT Counter | 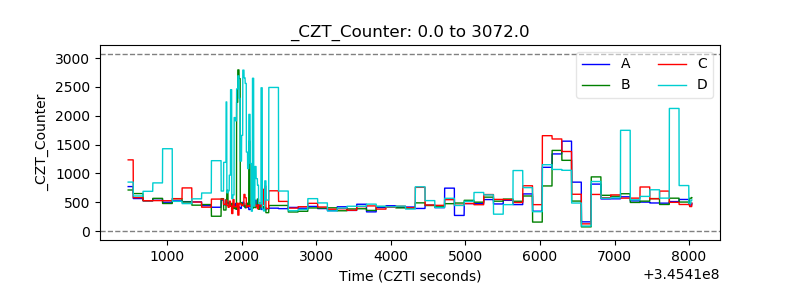 |
| +2.5 Volts monitor |  |
| +5 Volts monitor | 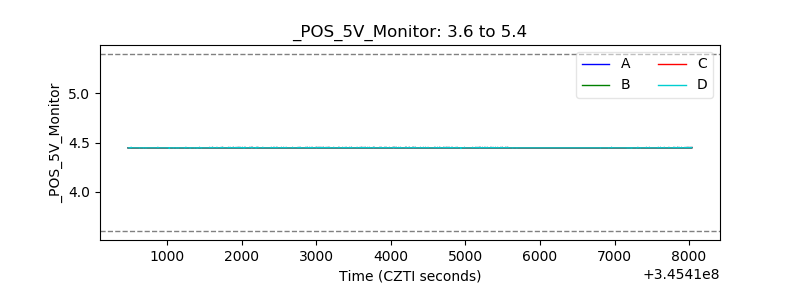 |
| _ROLL_ROT | 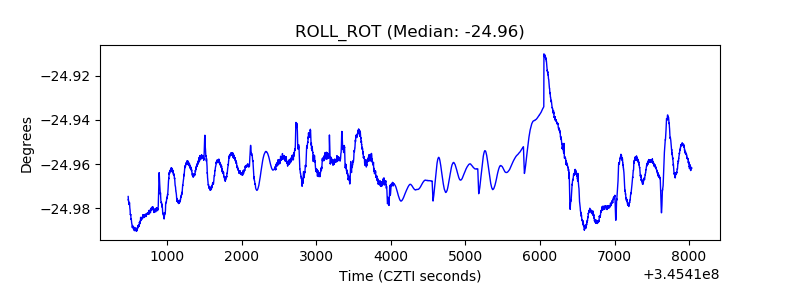 |
| _Roll_DEC |  |
| _Roll_RA | 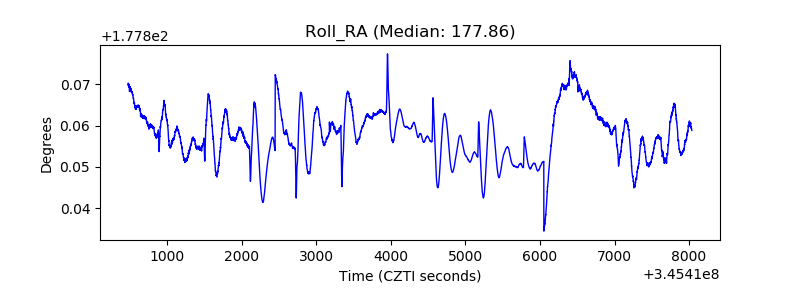 |
| Veto Counter | 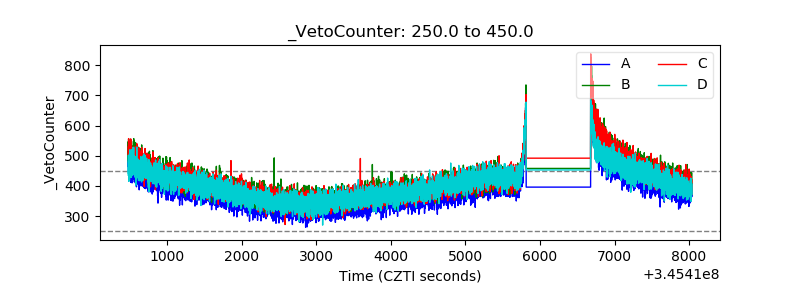 |