| Param | Original file | Final file |
|---|---|---|
| Filename | modeM0/AS1A10_045T04_9000004066_28149cztM0_level2.evt | modeM0/AS1A10_045T04_9000004066_28149cztM0_level2_quad_clean.evt |
| Size (bytes) | 600,598,080 | 93,049,920 |
| Size | 572.8 MB | 88.7 MB |
| Events in quadrant A | 3,299,402 | 601,616 |
| Events in quadrant B | 3,884,734 | 612,649 |
| Events in quadrant C | 3,437,412 | 586,370 |
| Events in quadrant D | 7,105,082 | 541,026 |
| Mode M0 | |||
|---|---|---|---|
| Quadrant | BADHDUFLAG | Total packets | Discarded packets |
| A | 0 | 14272 | 0 |
| B | 0 | 15988 | 0 |
| C | 0 | 14659 | 0 |
| D | 0 | 26007 | 0 |
| Mode M9 | |||
|---|---|---|---|
| Quadrant | BADHDUFLAG | Total packets | Discarded packets |
| A | 0 | 20 | 0 |
| B | 0 | 20 | 0 |
| C | 0 | 20 | 0 |
| D | 0 | 20 | 0 |
| Quadrant | Total seconds | Saturated seconds | Saturation percentage |
|---|---|---|---|
| A | 6835 | 62 | 0.907096% |
| B | 6835 | 129 | 1.887345% |
| C | 6835 | 98 | 1.433797% |
| D | 6836 | 603 | 8.820948% |
Noise dominated data is calculated using 1-second bins in cleaned event files. If a bin has >2000 counts, and if more than 50% of those come from <1% of pixels, then it is considered to be noise-dominated and hence unusable.
| Quadrant | # 1 sec bins | Bins with >0 counts | Bins with >2000 counts | High rate bins dominated by noise | Noise dominated (total time) | Noise dominated (detector-on time) | Marked lightcurve |
|---|---|---|---|---|---|---|---|
| A | 8735 | 6836 | 0 | 0 | 0.00% | 0.00% | 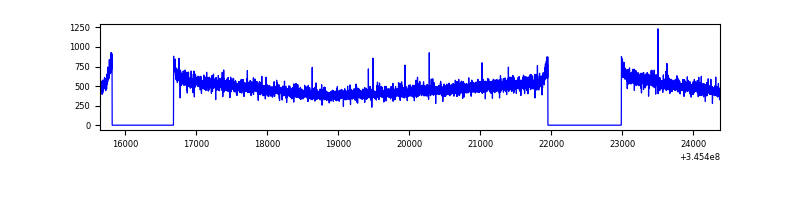 |
| B | 8735 | 6836 | 14 | 14 | 0.16% | 0.20% | 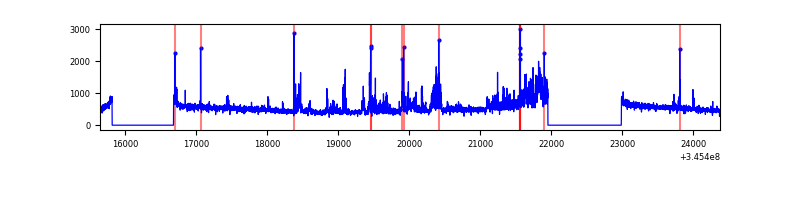 |
| C | 8735 | 6837 | 0 | 0 | 0.00% | 0.00% | 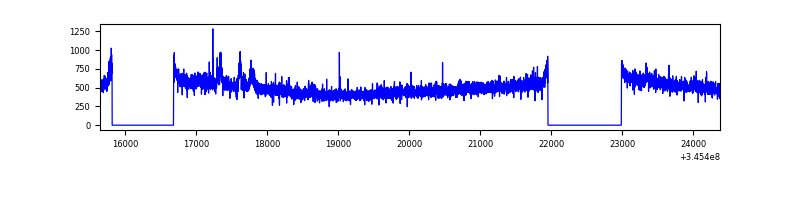 |
| D | 8736 | 6838 | 450 | 450 | 5.15% | 6.58% | 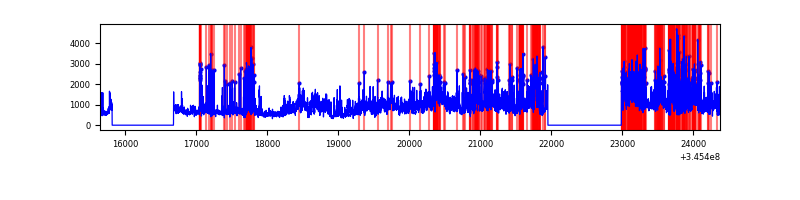 |
Top three noisy pixels from each quadrant. If the there are fewer than three noisy pixels in the level2.evt file, extra rows are filled as -1
| Pixel properties | Quadrant properties | ||||||
|---|---|---|---|---|---|---|---|
| Quadrant | DetID | PixID | Counts | Sigma | Mean | Median | Sigma |
| A | 13 | 254 | 10896 | 58.32 | 855 | 839 | 172.4 |
| A | 3 | 137 | 8261 | 43.04 | 855 | 839 | 172.4 |
| A | 0 | 226 | 7163 | 36.67 | 855 | 839 | 172.4 |
| B | 10 | 245 | 426041 | 2608.63 | 848 | 825 | 163.0 |
| B | 15 | 32 | 41860 | 251.74 | 848 | 825 | 163.0 |
| B | 4 | 80 | 33365 | 199.63 | 848 | 825 | 163.0 |
| C | 14 | 238 | 130749 | 670.92 | 822 | 827 | 193.6 |
| C | 3 | 233 | 98917 | 506.54 | 822 | 827 | 193.6 |
| C | 13 | 61 | 5645 | 24.88 | 822 | 827 | 193.6 |
| D | 7 | 223 | 2136672 | 11184.98 | 792 | 769 | 191.0 |
| D | 1 | 52 | 1046687 | 5477.11 | 792 | 769 | 191.0 |
| D | 5 | 222 | 252629 | 1318.9 | 792 | 769 | 191.0 |
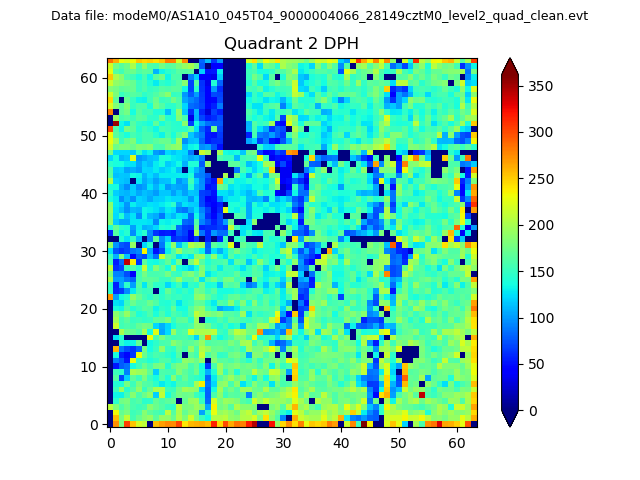
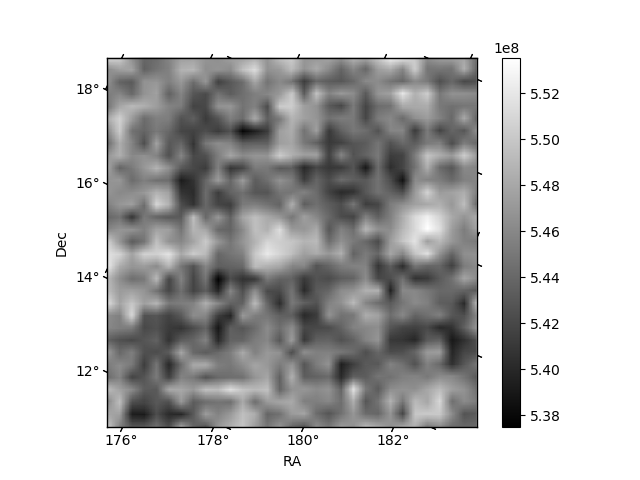
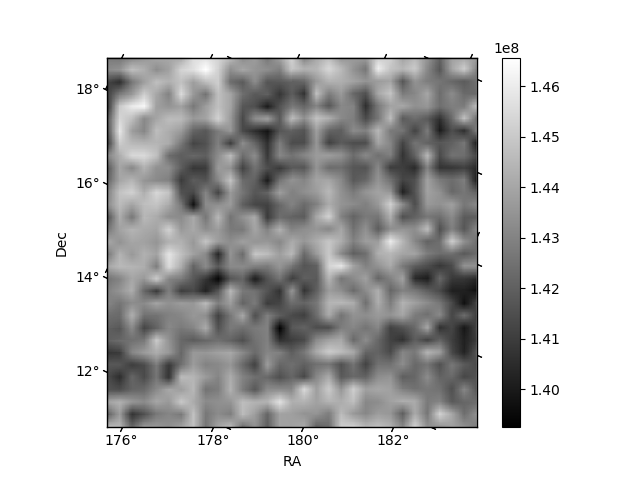
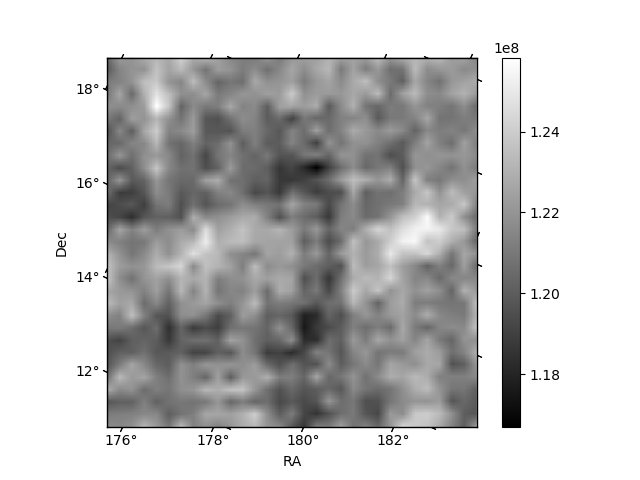
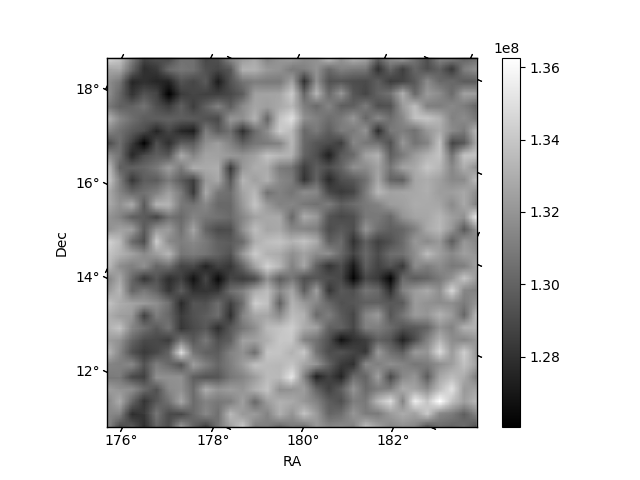
Histogram calculated using DETX and DETY for each event in the final _common_clean file
| Quadrant A | 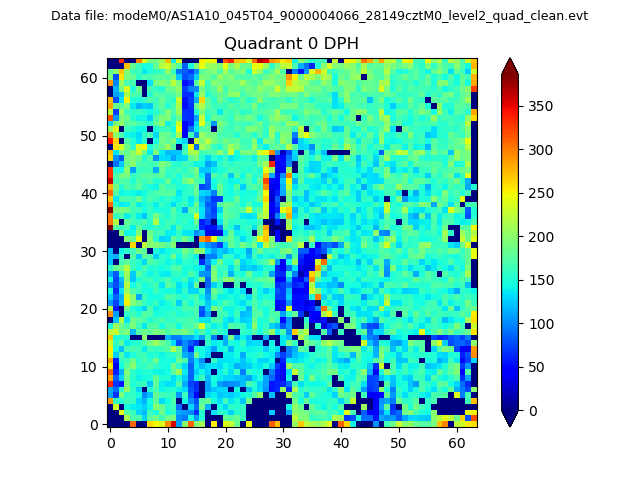 |
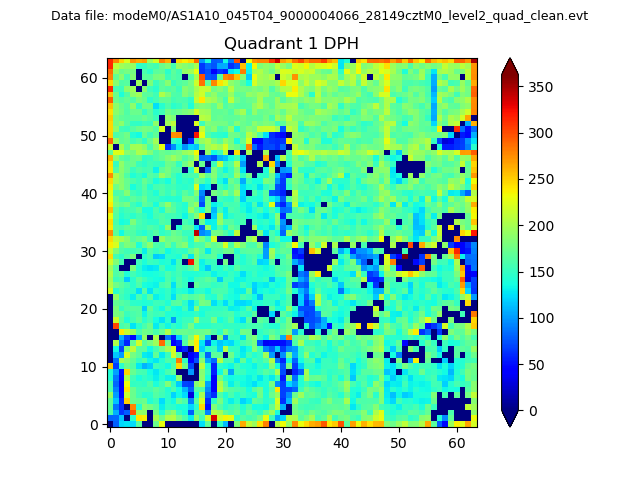 |
Quadrant B |
|---|---|---|---|
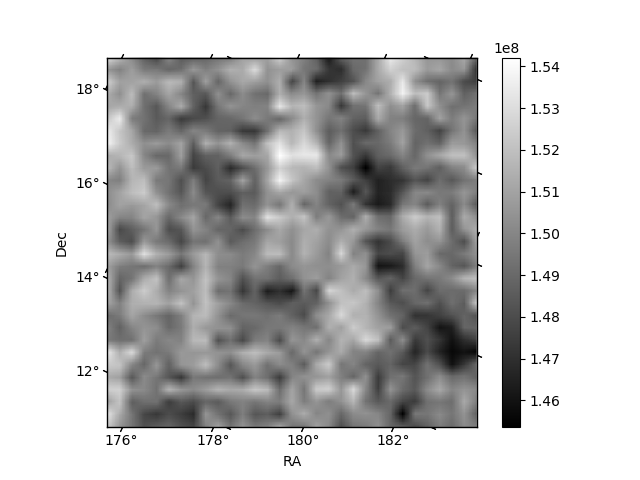
| Quadrant D | 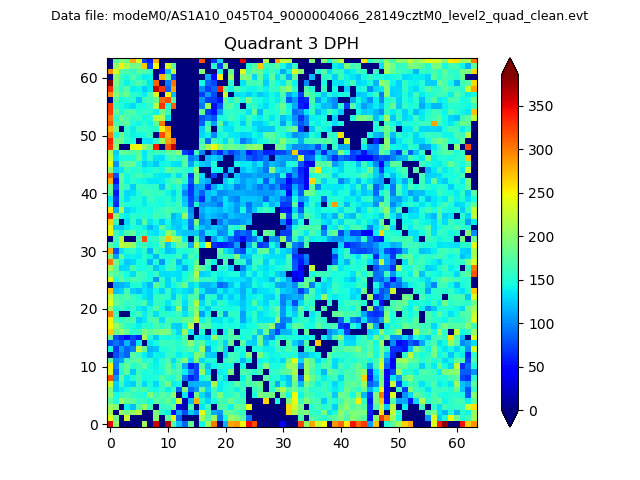 |
 |
Quadrant C |
| Plot type | Count rate plots | Images |
|---|---|---|
| Comparison with Poisson distribution Blue bars denote a histogram of data divided into 1 sec bins. Red curve is a Poisson curve with rate = median count rate of data. |
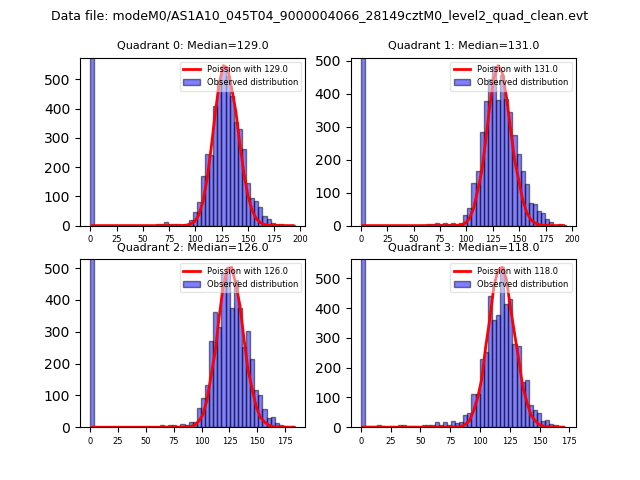 |
 |
| Quadrant-wise count rates Data is divided into 100 sec bins |
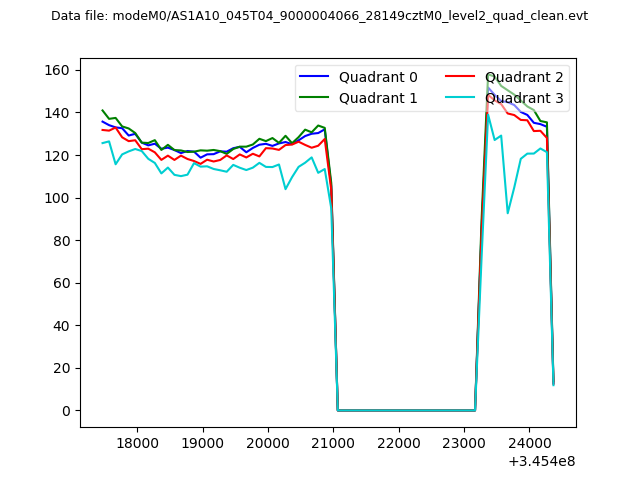 |
|
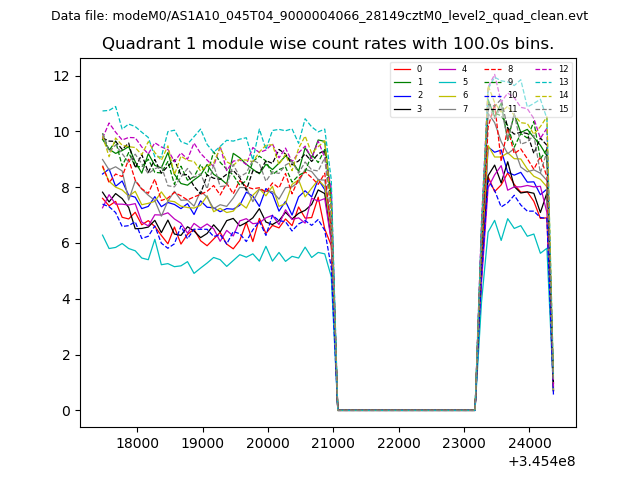
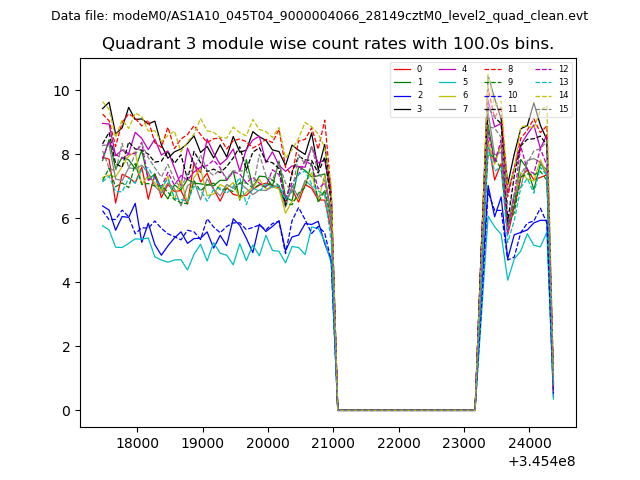
| Module-wise count rates for Quadrant A Data is divided into 100 sec bins |
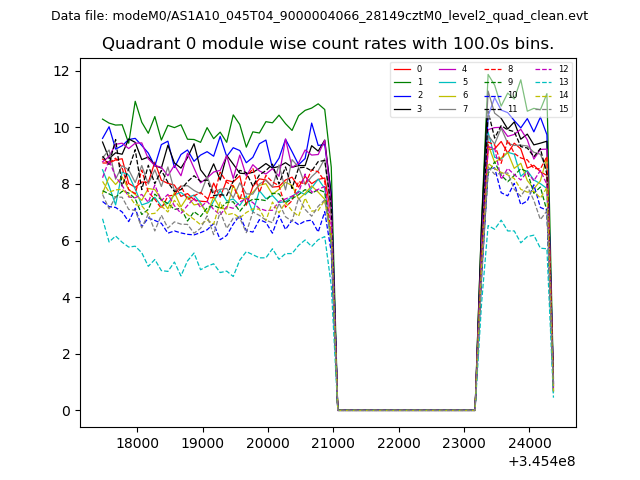 |
 |
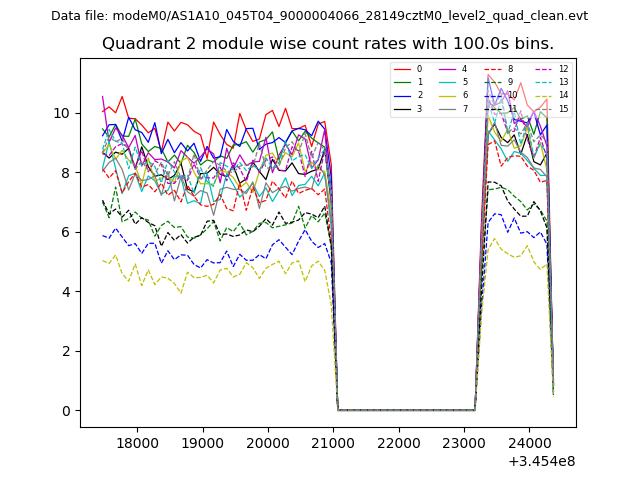
| Module-wise count rates for Quadrant B Data is divided into 100 sec bins |
 |
 |
| Module-wise count rates for Quadrant C Data is divided into 100 sec bins |
 |
 |
| Module-wise count rates for Quadrant D Data is divided into 100 sec bins |
 |
 |
| Parameter | Plot |
|---|---|
| CZT HV Monitor | 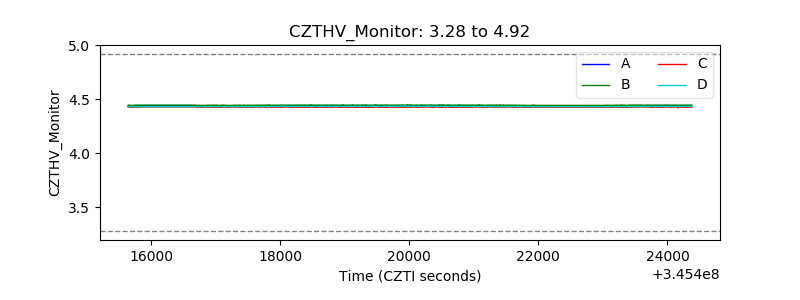 |
| D_VDD | 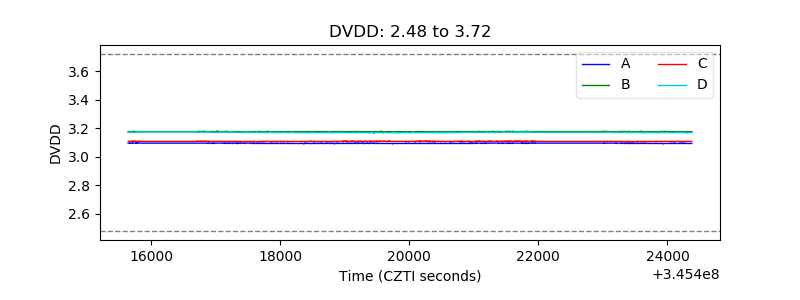 |
| Temperature 1 | 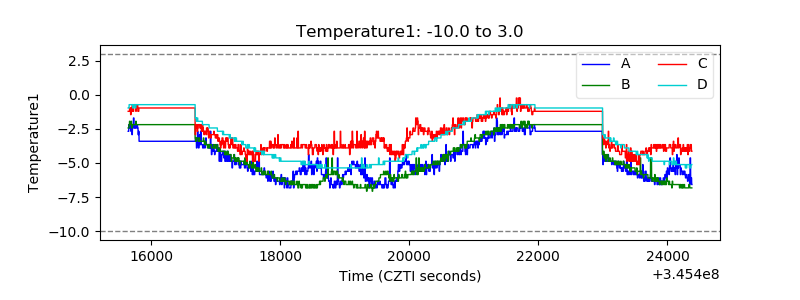 |
| Veto HV Monitor | 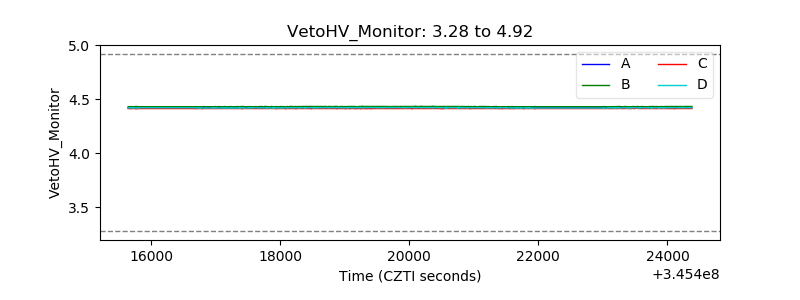 |
| Veto LLD | 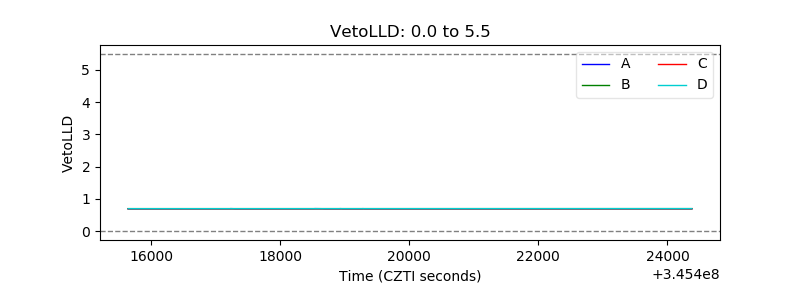 |
| Alpha Counter | 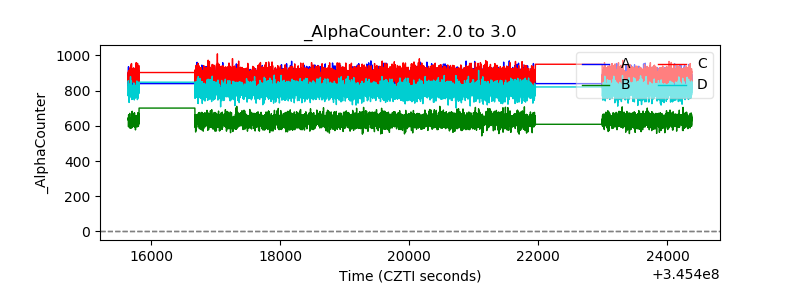 |
| _CPM_Rate | 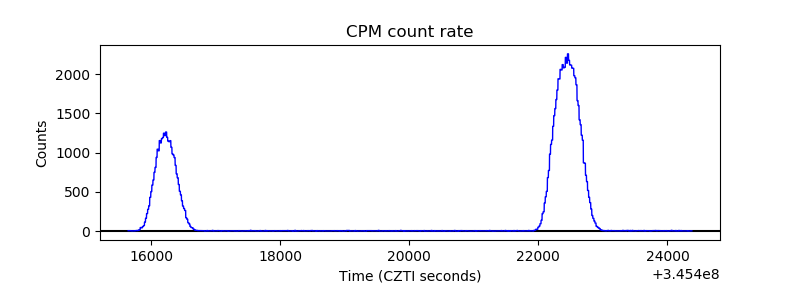 |
| CZT Counter | 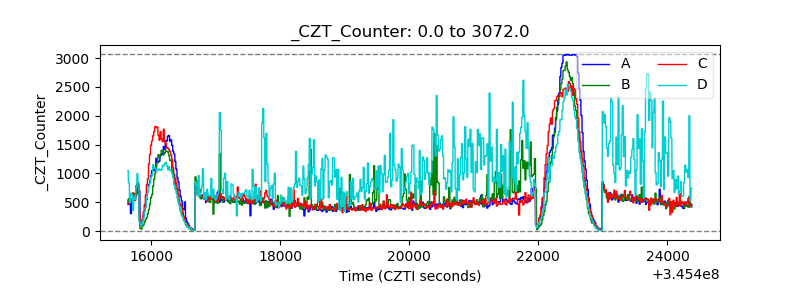 |
| +2.5 Volts monitor | 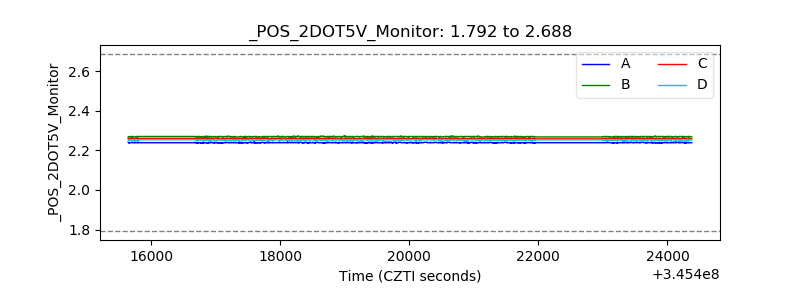 |
| +5 Volts monitor | 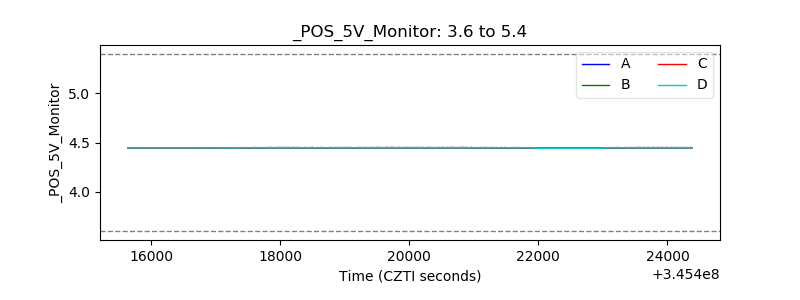 |
| _ROLL_ROT | 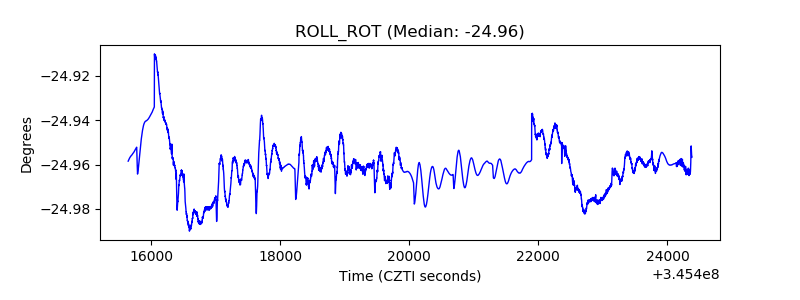 |
| _Roll_DEC |  |
| _Roll_RA | 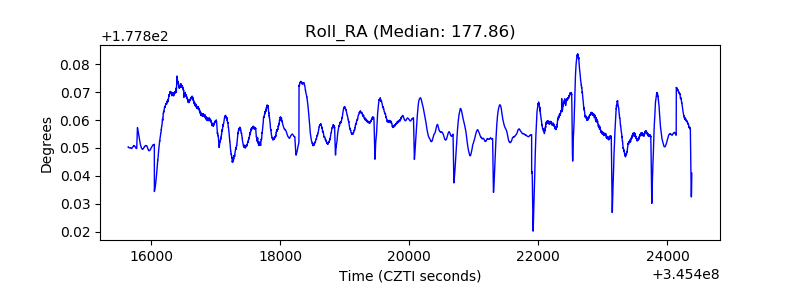 |
| Veto Counter | 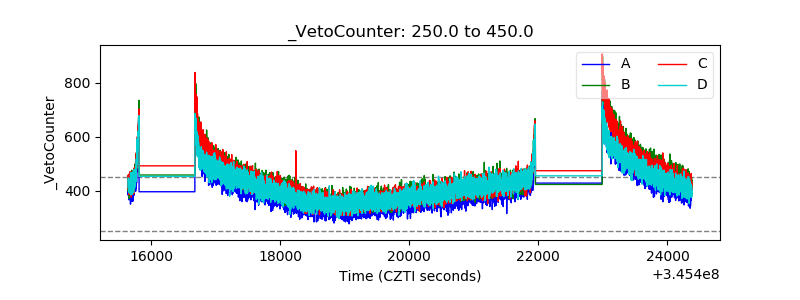 |