| Param | Original file | Final file |
|---|---|---|
| Filename | modeM0/AS1A10_045T04_9000004066_28151cztM0_level2.evt | modeM0/AS1A10_045T04_9000004066_28151cztM0_level2_quad_clean.evt |
| Size (bytes) | 1,759,173,120 | 291,579,840 |
| Size | 1.6 GB | 278.1 MB |
| Events in quadrant A | 9,663,193 | 1,950,329 |
| Events in quadrant B | 11,309,870 | 1,974,039 |
| Events in quadrant C | 10,344,423 | 1,890,504 |
| Events in quadrant D | 20,564,301 | 1,591,297 |
| Mode M0 | |||
|---|---|---|---|
| Quadrant | BADHDUFLAG | Total packets | Discarded packets |
| A | 0 | 42543 | 0 |
| B | 0 | 47381 | 0 |
| C | 0 | 44286 | 0 |
| D | 0 | 75251 | 0 |
| Mode M9 | |||
|---|---|---|---|
| Quadrant | BADHDUFLAG | Total packets | Discarded packets |
| A | 0 | 30 | 0 |
| B | 0 | 30 | 0 |
| C | 0 | 30 | 0 |
| D | 0 | 30 | 0 |
| Quadrant | Total seconds | Saturated seconds | Saturation percentage |
|---|---|---|---|
| A | 20693 | 81 | 0.391437% |
| B | 20694 | 469 | 2.266357% |
| C | 20693 | 275 | 1.328952% |
| D | 20693 | 3041 | 14.695791% |
Noise dominated data is calculated using 1-second bins in cleaned event files. If a bin has >2000 counts, and if more than 50% of those come from <1% of pixels, then it is considered to be noise-dominated and hence unusable.
| Quadrant | # 1 sec bins | Bins with >0 counts | Bins with >2000 counts | High rate bins dominated by noise | Noise dominated (total time) | Noise dominated (detector-on time) | Marked lightcurve |
|---|---|---|---|---|---|---|---|
| A | 31918 | 20696 | 0 | 0 | 0.00% | 0.00% | 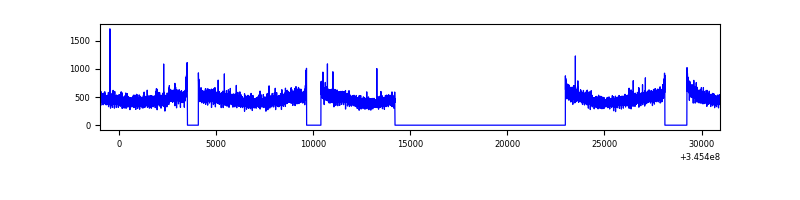 |
| B | 31919 | 20696 | 217 | 217 | 0.68% | 1.05% | 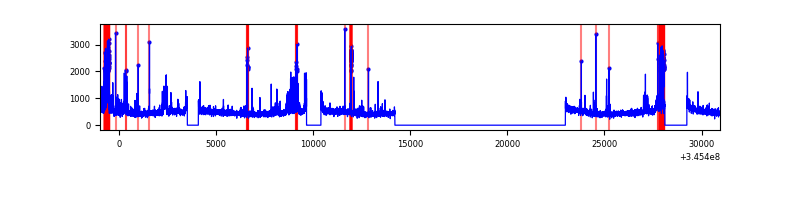 |
| C | 31918 | 20696 | 21 | 21 | 0.07% | 0.10% |  |
| D | 31917 | 20695 | 2806 | 2806 | 8.79% | 13.56% | 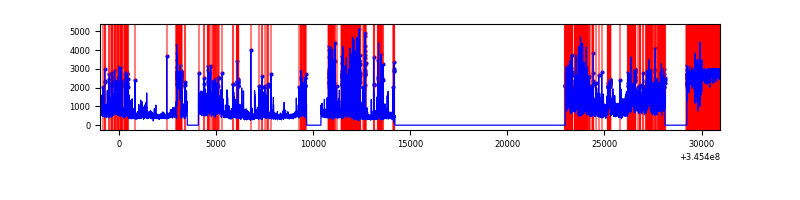 |
Top three noisy pixels from each quadrant. If the there are fewer than three noisy pixels in the level2.evt file, extra rows are filled as -1
| Pixel properties | Quadrant properties | ||||||
|---|---|---|---|---|---|---|---|
| Quadrant | DetID | PixID | Counts | Sigma | Mean | Median | Sigma |
| A | 13 | 254 | 32508 | 59.79 | 2502 | 2451 | 502.7 |
| A | 3 | 137 | 24352 | 43.57 | 2502 | 2451 | 502.7 |
| A | 0 | 226 | 21487 | 37.87 | 2502 | 2451 | 502.7 |
| B | 10 | 245 | 1420069 | 3001.4 | 2475 | 2413 | 472.3 |
| B | 15 | 32 | 59322 | 120.48 | 2475 | 2413 | 472.3 |
| B | 12 | 111 | 59205 | 120.24 | 2475 | 2413 | 472.3 |
| C | 3 | 233 | 517232 | 923.85 | 2395 | 2414 | 557.3 |
| C | 14 | 238 | 384991 | 686.54 | 2395 | 2414 | 557.3 |
| C | 2 | 16 | 94291 | 164.87 | 2395 | 2414 | 557.3 |
| D | 7 | 80 | 5094741 | 9793.1 | 2189 | 2136 | 520.0 |
| D | 1 | 52 | 2773194 | 5328.76 | 2189 | 2136 | 520.0 |
| D | 7 | 223 | 2547026 | 4893.83 | 2189 | 2136 | 520.0 |
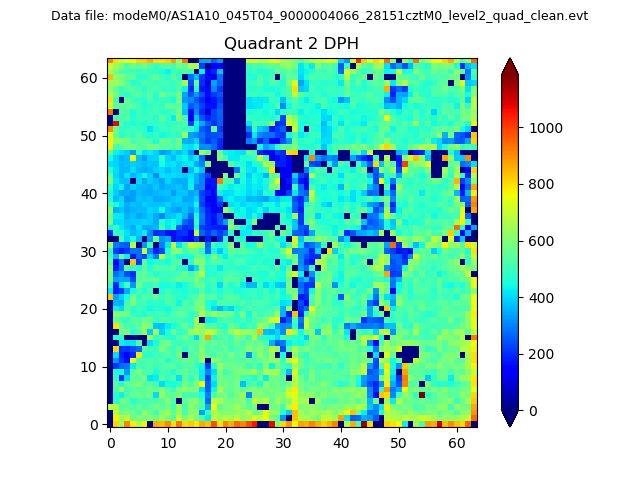
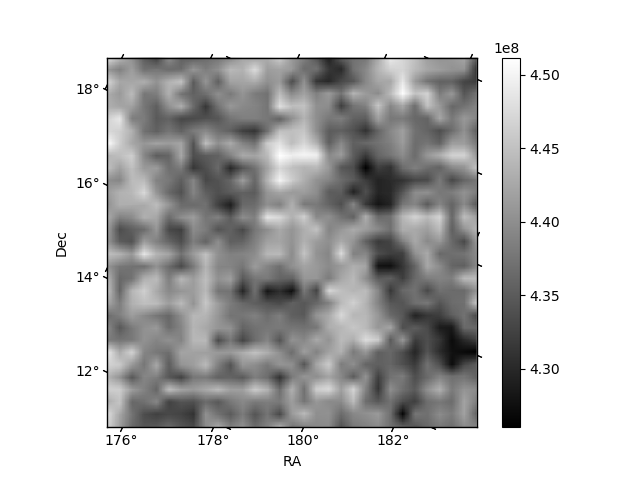
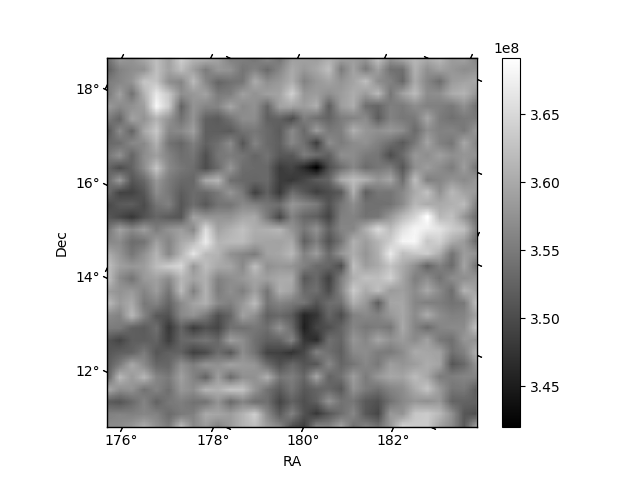
Histogram calculated using DETX and DETY for each event in the final _common_clean file
| Quadrant A | 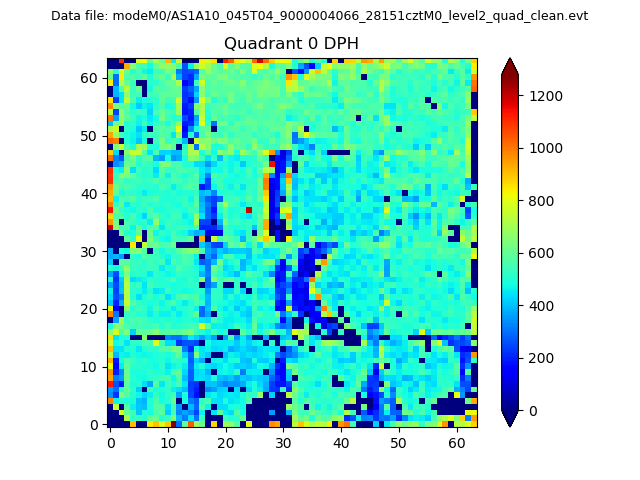 |
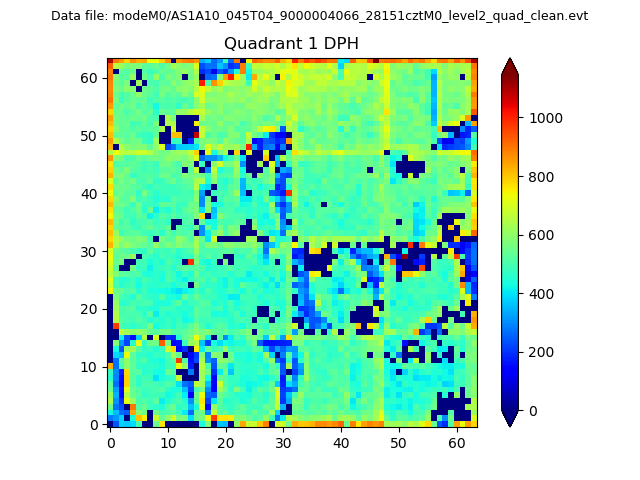 |
Quadrant B |
|---|---|---|---|
| Quadrant D | 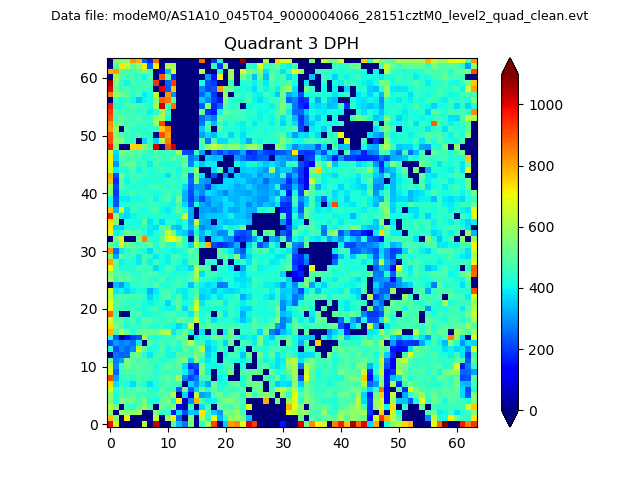 |
 |
Quadrant C |
| Plot type | Count rate plots | Images |
|---|---|---|
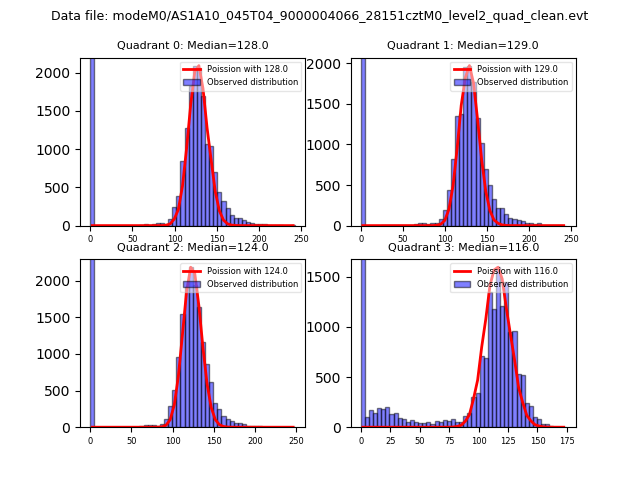
| Comparison with Poisson distribution Blue bars denote a histogram of data divided into 1 sec bins. Red curve is a Poisson curve with rate = median count rate of data. |
 |
 |
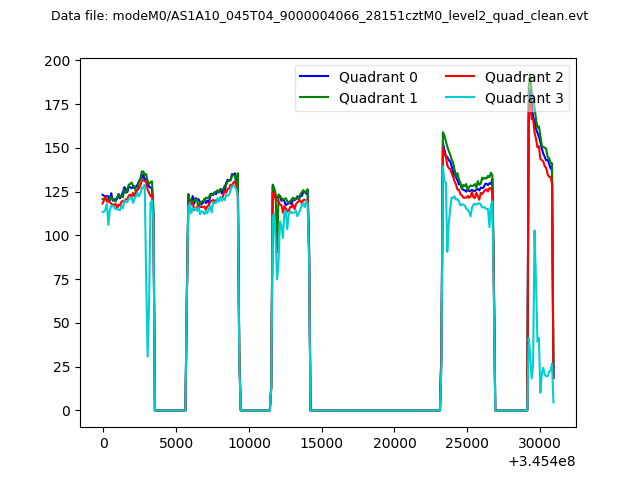
| Quadrant-wise count rates Data is divided into 100 sec bins |
 |
|
| Module-wise count rates for Quadrant A Data is divided into 100 sec bins |
 |
 |
| Module-wise count rates for Quadrant B Data is divided into 100 sec bins |
 |
 |
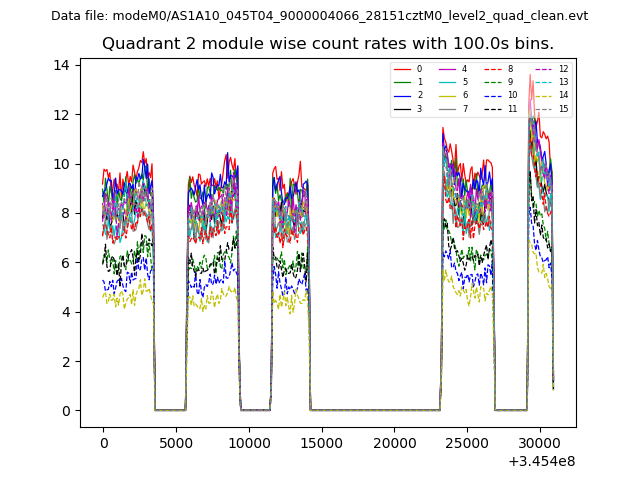
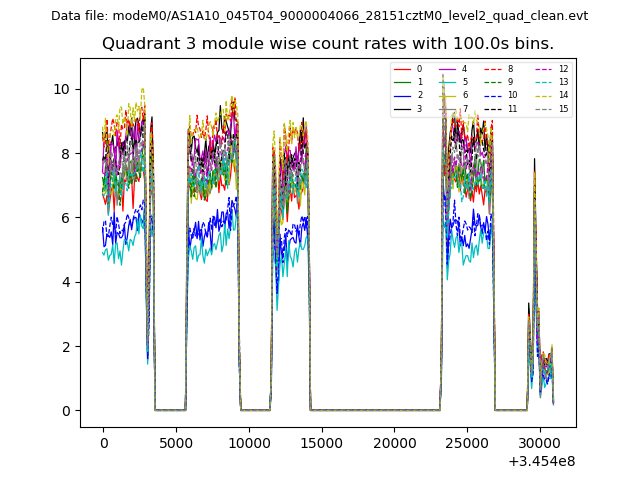
| Module-wise count rates for Quadrant C Data is divided into 100 sec bins |
 |
 |
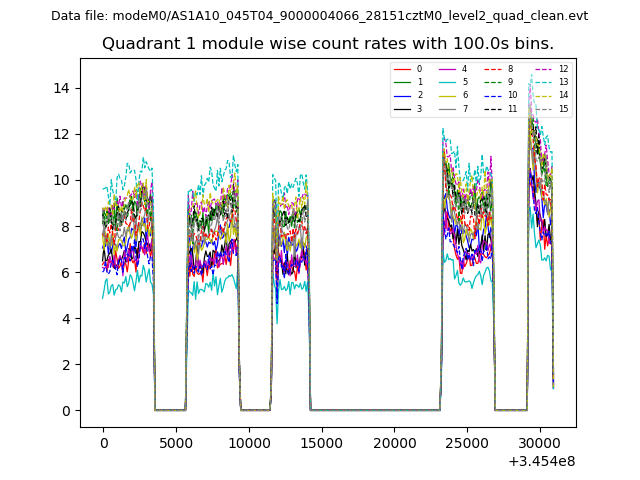
| Module-wise count rates for Quadrant D Data is divided into 100 sec bins |
 |
 |
| Parameter | Plot |
|---|---|
| CZT HV Monitor | 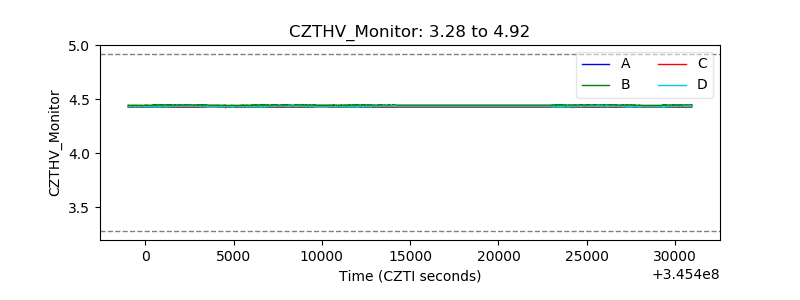 |
| D_VDD | 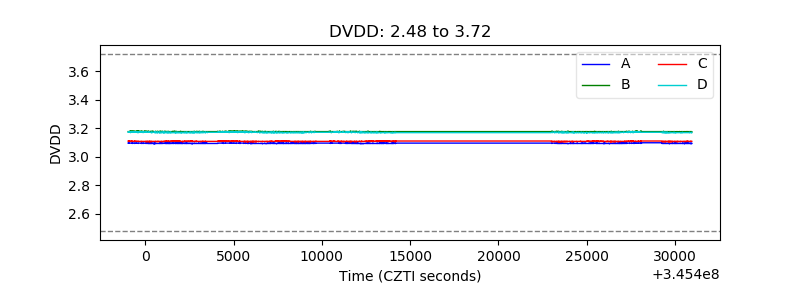 |
| Temperature 1 | 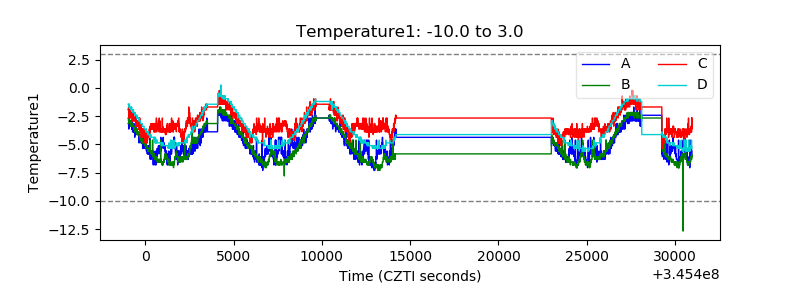 |
| Veto HV Monitor | 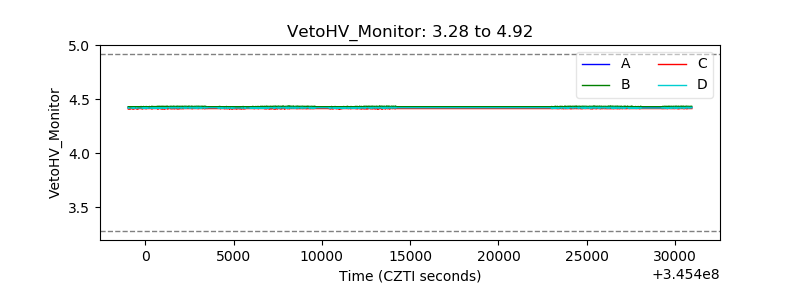 |
| Veto LLD | 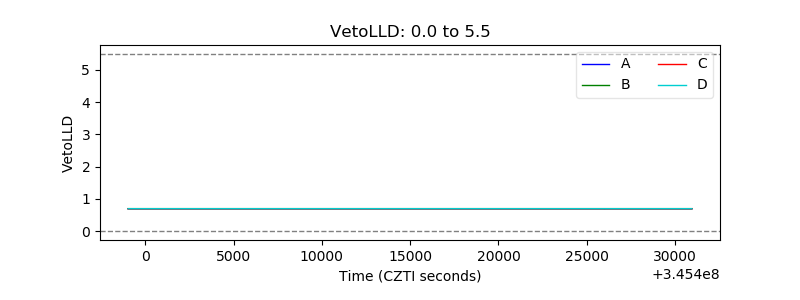 |
| Alpha Counter | 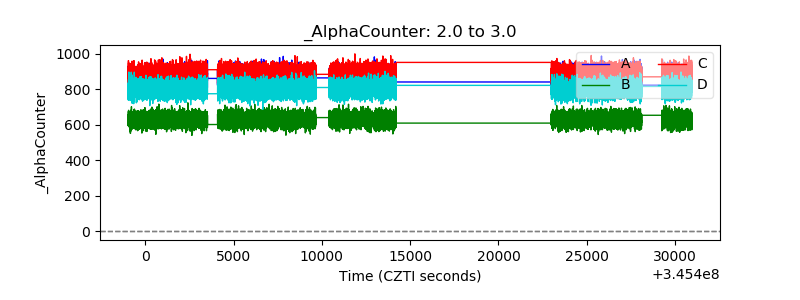 |
| _CPM_Rate | 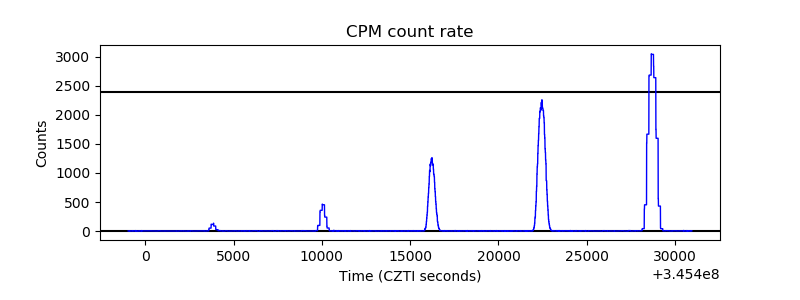 |
| CZT Counter | 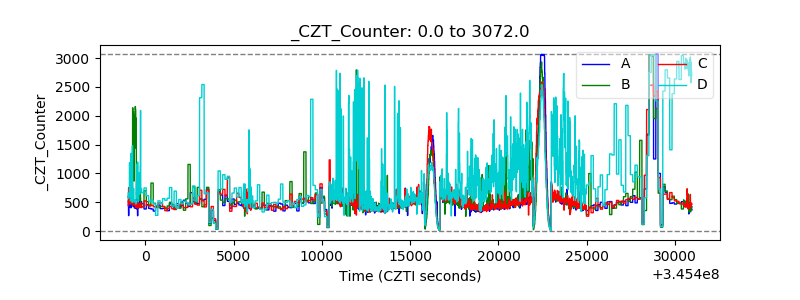 |
| +2.5 Volts monitor |  |
| +5 Volts monitor |  |
| _ROLL_ROT | 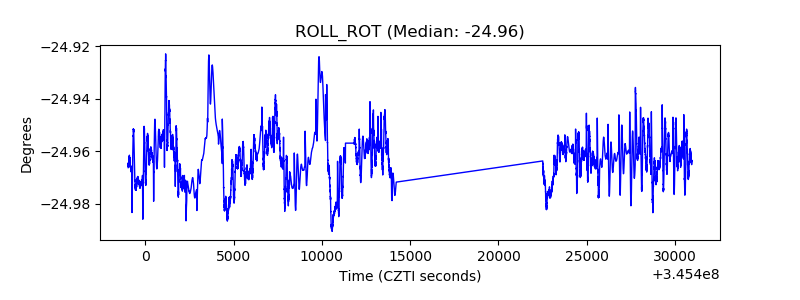 |
| _Roll_DEC | 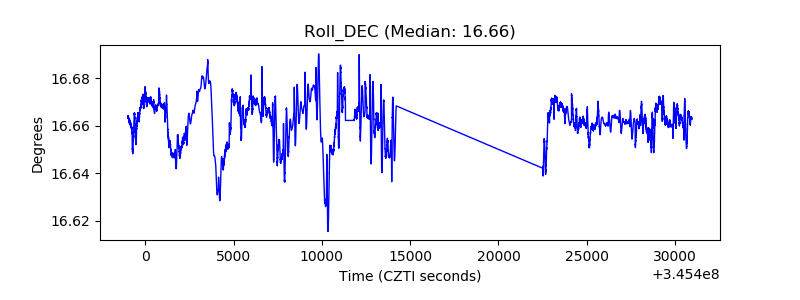 |
| _Roll_RA | 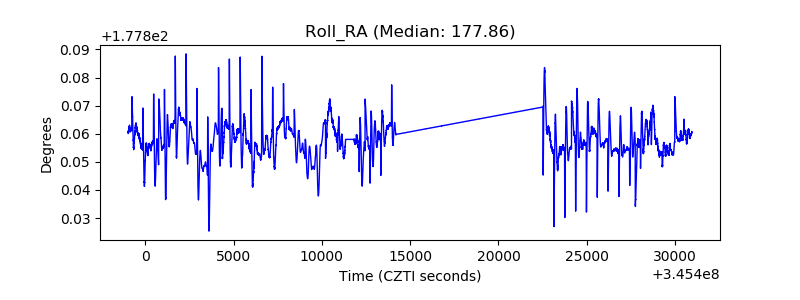 |
| Veto Counter | 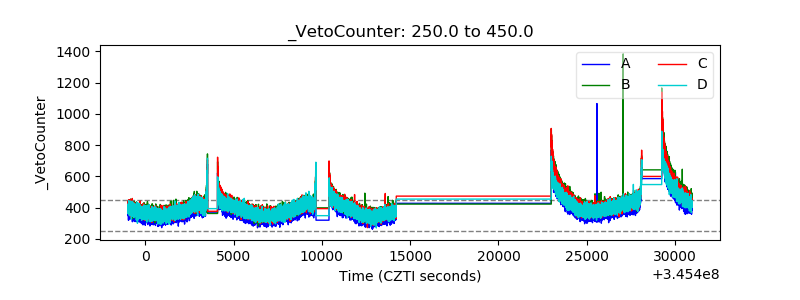 |