| Param | Original file | Final file |
|---|---|---|
| Filename | modeM0/AS1A10_045T04_9000004066_28152cztM0_level2.evt | modeM0/AS1A10_045T04_9000004066_28152cztM0_level2_quad_clean.evt |
| Size (bytes) | 647,634,240 | 93,121,920 |
| Size | 617.6 MB | 88.8 MB |
| Events in quadrant A | 2,988,335 | 673,778 |
| Events in quadrant B | 3,117,169 | 696,370 |
| Events in quadrant C | 3,262,693 | 647,577 |
| Events in quadrant D | 9,833,619 | 376,548 |
| Mode M0 | |||
|---|---|---|---|
| Quadrant | BADHDUFLAG | Total packets | Discarded packets |
| A | 0 | 12625 | 0 |
| B | 0 | 12999 | 0 |
| C | 0 | 13473 | 0 |
| D | 0 | 33164 | 0 |
| Mode M9 | |||
|---|---|---|---|
| Quadrant | BADHDUFLAG | Total packets | Discarded packets |
| A | 0 | 13 | 0 |
| B | 0 | 13 | 0 |
| C | 0 | 13 | 0 |
| D | 0 | 13 | 0 |
| Quadrant | Total seconds | Saturated seconds | Saturation percentage |
|---|---|---|---|
| A | 6085 | 21 | 0.345111% |
| B | 6086 | 35 | 0.575090% |
| C | 6086 | 61 | 1.002300% |
| D | 6086 | 2651 | 43.558988% |
Noise dominated data is calculated using 1-second bins in cleaned event files. If a bin has >2000 counts, and if more than 50% of those come from <1% of pixels, then it is considered to be noise-dominated and hence unusable.
| Quadrant | # 1 sec bins | Bins with >0 counts | Bins with >2000 counts | High rate bins dominated by noise | Noise dominated (total time) | Noise dominated (detector-on time) | Marked lightcurve |
|---|---|---|---|---|---|---|---|
| A | 7335 | 6086 | 0 | 0 | 0.00% | 0.00% | 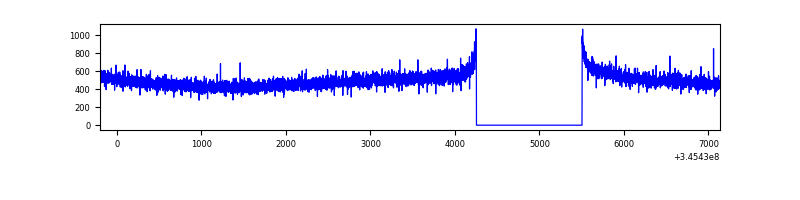 |
| B | 7336 | 6087 | 8 | 8 | 0.11% | 0.13% | 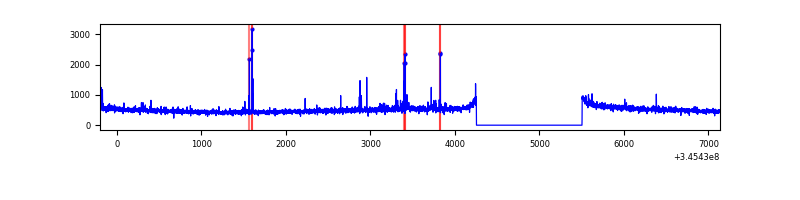 |
| C | 7336 | 6087 | 0 | 0 | 0.00% | 0.00% |  |
| D | 7336 | 6087 | 2589 | 2589 | 35.29% | 42.53% | 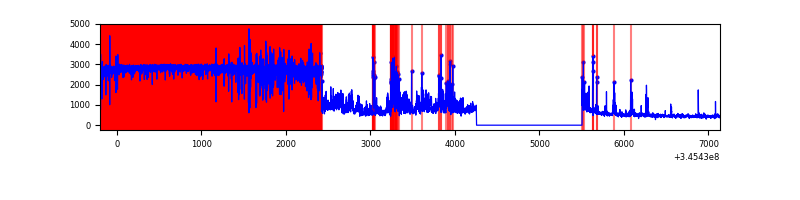 |
Top three noisy pixels from each quadrant. If the there are fewer than three noisy pixels in the level2.evt file, extra rows are filled as -1
| Pixel properties | Quadrant properties | ||||||
|---|---|---|---|---|---|---|---|
| Quadrant | DetID | PixID | Counts | Sigma | Mean | Median | Sigma |
| A | 13 | 254 | 9720 | 57.96 | 773 | 760 | 154.6 |
| A | 3 | 137 | 7326 | 42.47 | 773 | 760 | 154.6 |
| A | 0 | 226 | 6521 | 37.26 | 773 | 760 | 154.6 |
| B | 10 | 246 | 38934 | 262.35 | 775 | 759 | 145.5 |
| B | 12 | 111 | 17694 | 116.38 | 775 | 759 | 145.5 |
| B | 0 | 183 | 17438 | 114.62 | 775 | 759 | 145.5 |
| C | 3 | 233 | 192750 | 1123.84 | 739 | 745 | 170.8 |
| C | 14 | 238 | 120444 | 700.62 | 739 | 745 | 170.8 |
| C | 2 | 16 | 47969 | 276.41 | 739 | 745 | 170.8 |
| D | 7 | 80 | 6362605 | 47837.86 | 550 | 537 | 133.0 |
| D | 7 | 223 | 904447 | 6796.71 | 550 | 537 | 133.0 |
| D | 1 | 52 | 237197 | 1779.5 | 550 | 537 | 133.0 |
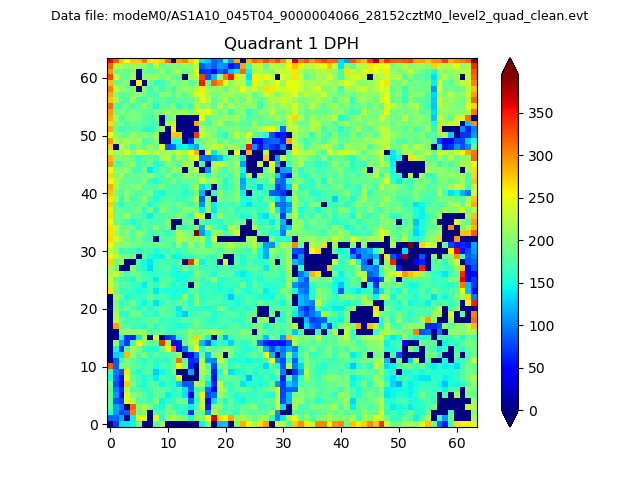
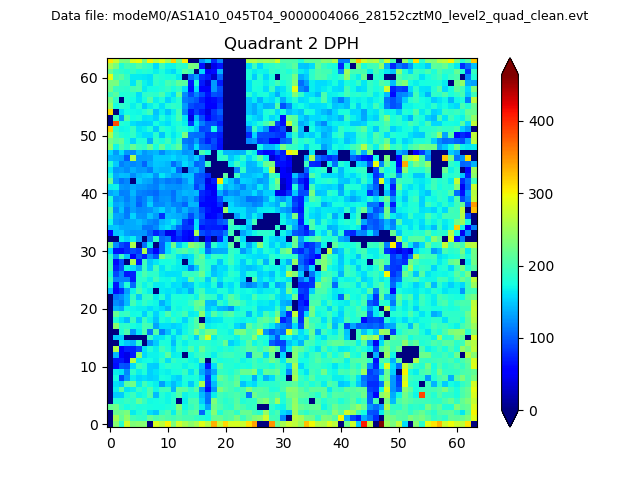
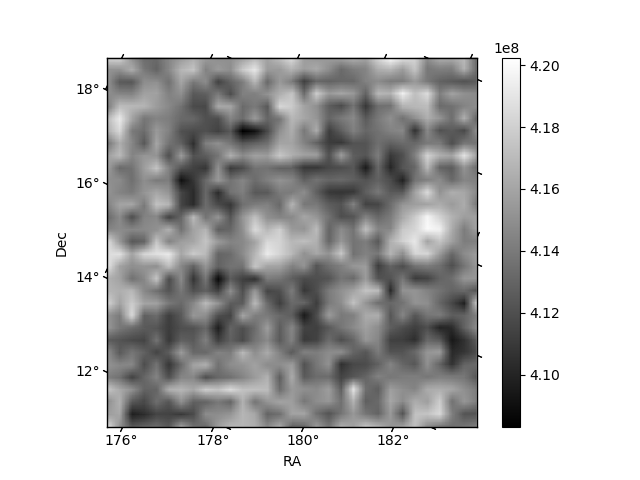
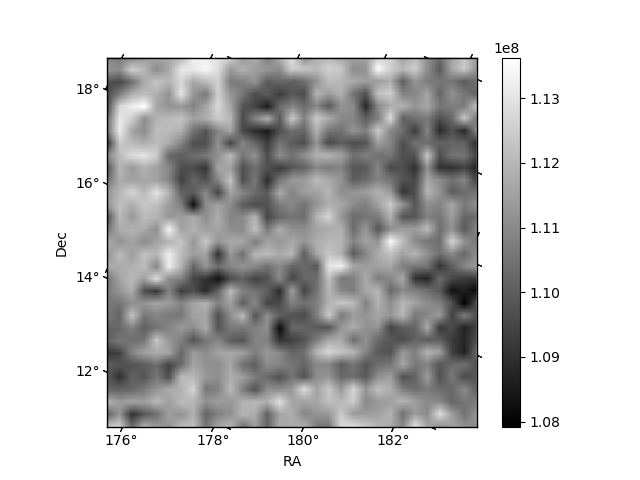
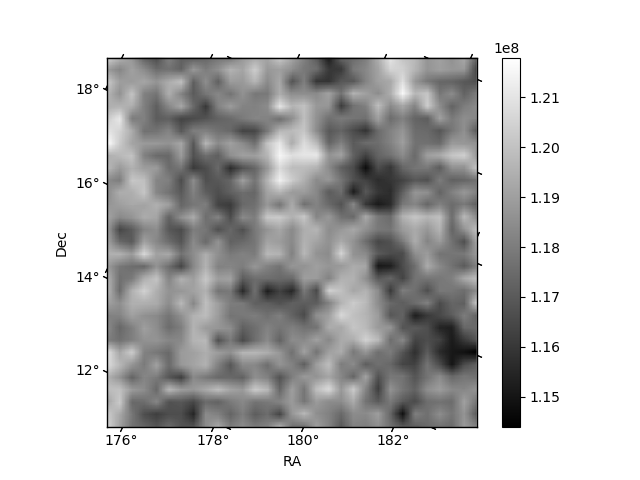
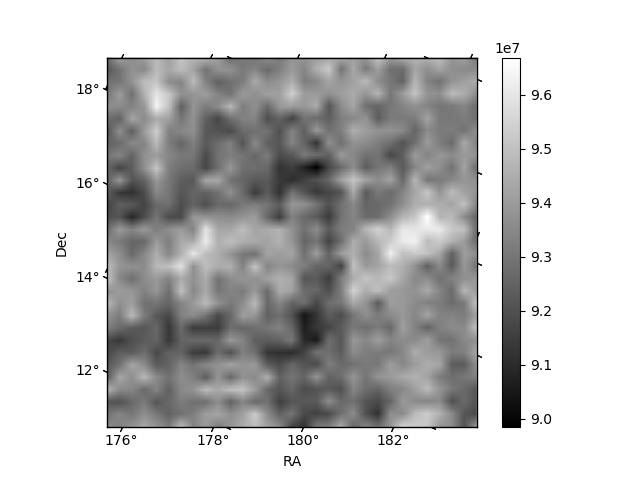
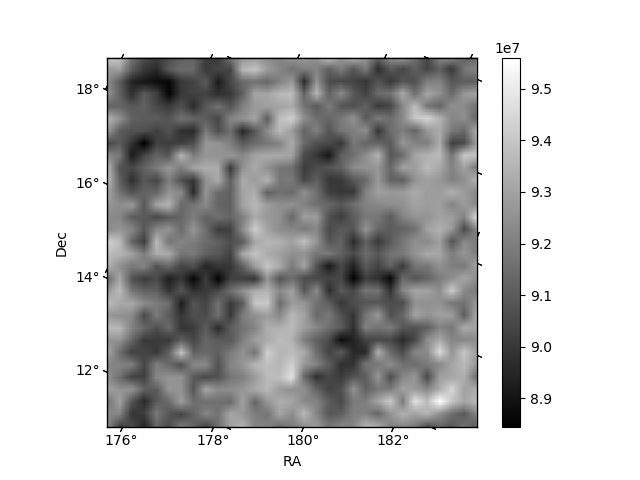
Histogram calculated using DETX and DETY for each event in the final _common_clean file
| Quadrant A | 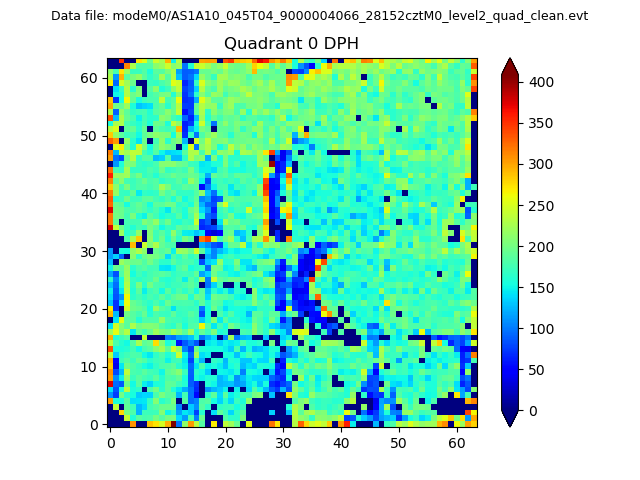 |
 |
Quadrant B |
|---|---|---|---|
| Quadrant D | 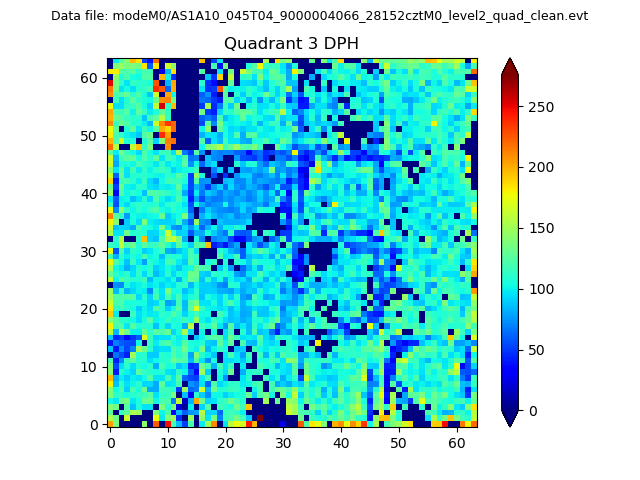 |
 |
Quadrant C |
| Plot type | Count rate plots | Images |
|---|---|---|
| Comparison with Poisson distribution Blue bars denote a histogram of data divided into 1 sec bins. Red curve is a Poisson curve with rate = median count rate of data. |
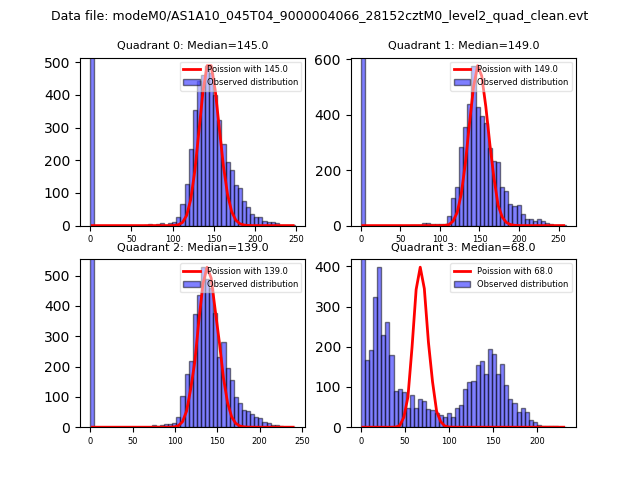 |
 |
| Quadrant-wise count rates Data is divided into 100 sec bins |
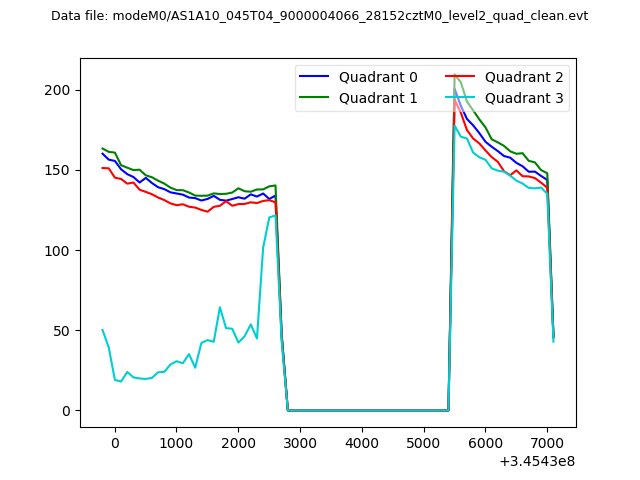 |
|
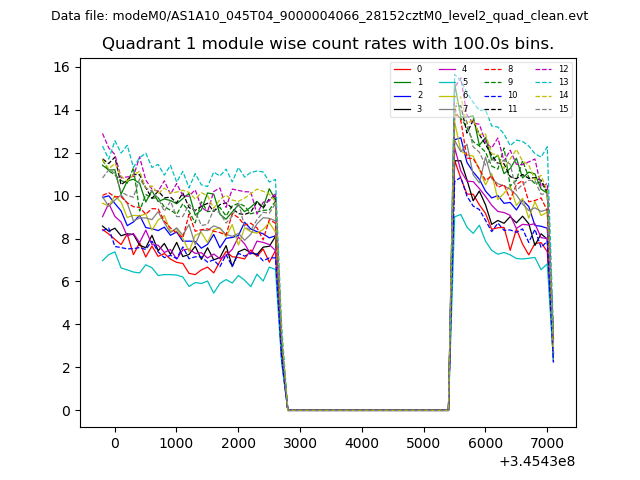
| Module-wise count rates for Quadrant A Data is divided into 100 sec bins |
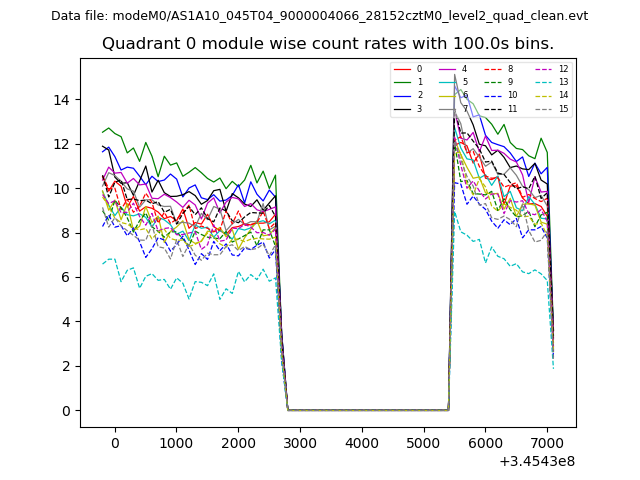 |
 |
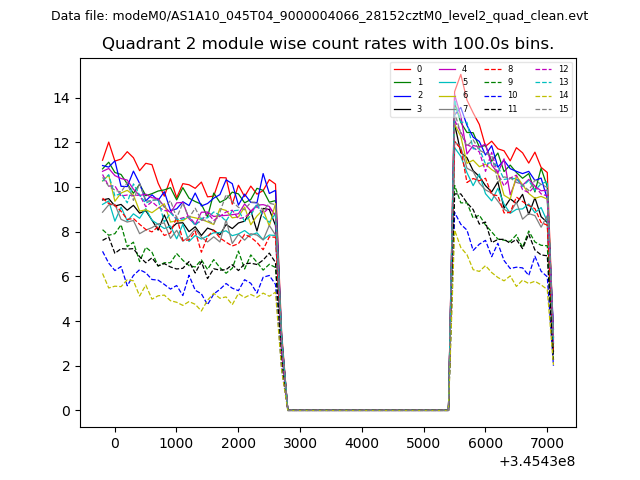
| Module-wise count rates for Quadrant B Data is divided into 100 sec bins |
 |
 |
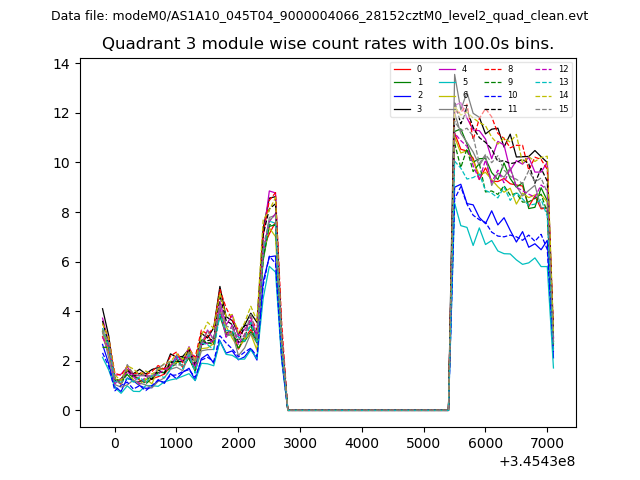
| Module-wise count rates for Quadrant C Data is divided into 100 sec bins |
 |
 |
| Module-wise count rates for Quadrant D Data is divided into 100 sec bins |
 |
 |
| Parameter | Plot |
|---|---|
| CZT HV Monitor | 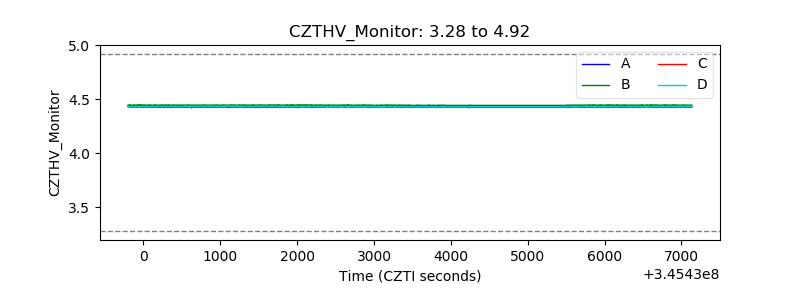 |
| D_VDD | 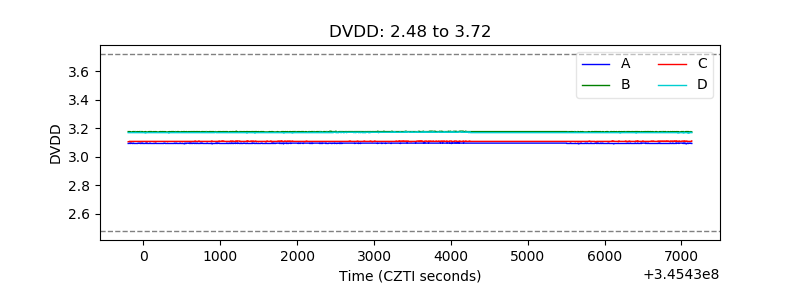 |
| Temperature 1 | 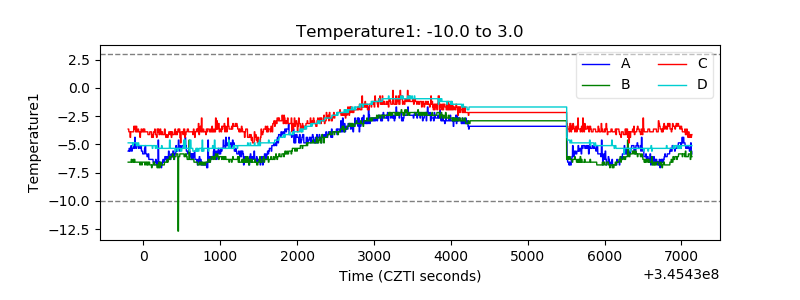 |
| Veto HV Monitor |  |
| Veto LLD | 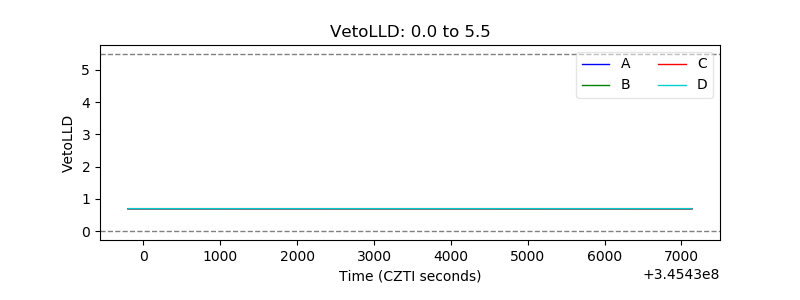 |
| Alpha Counter | 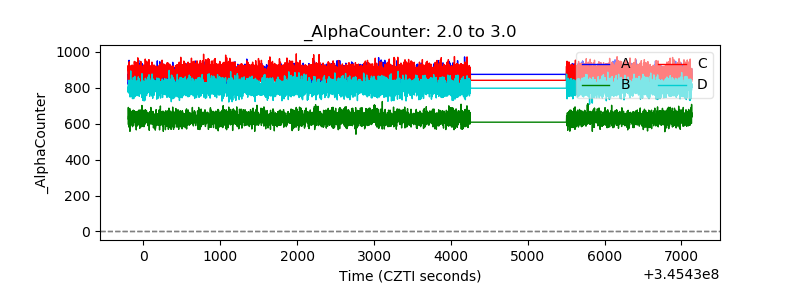 |
| _CPM_Rate | 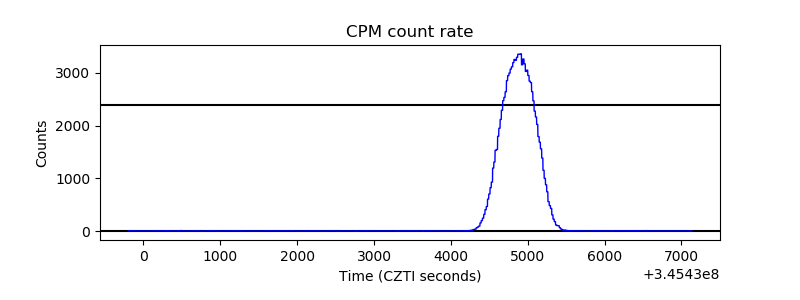 |
| CZT Counter | 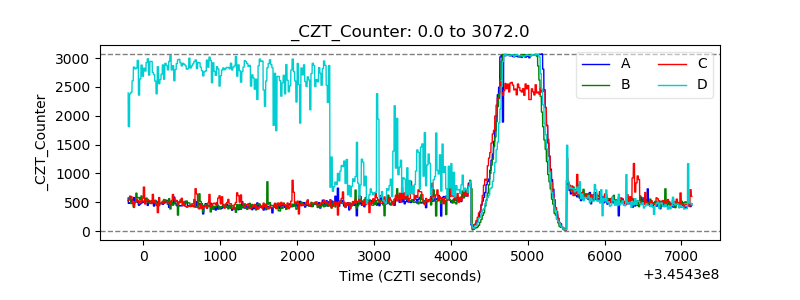 |
| +2.5 Volts monitor |  |
| +5 Volts monitor |  |
| _ROLL_ROT | 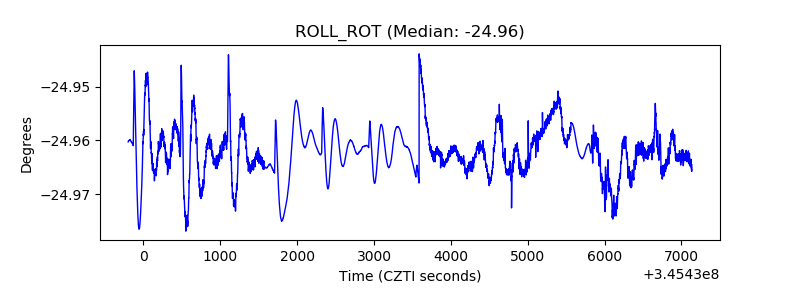 |
| _Roll_DEC | 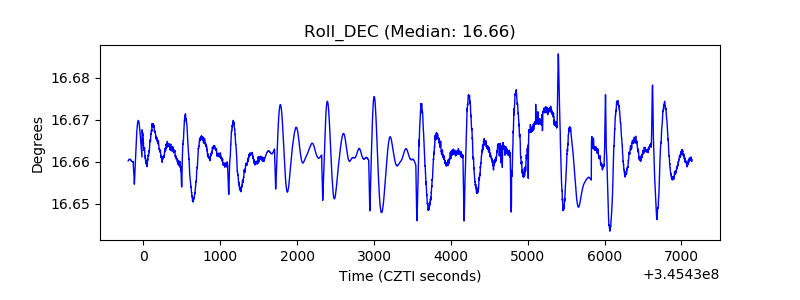 |
| _Roll_RA | 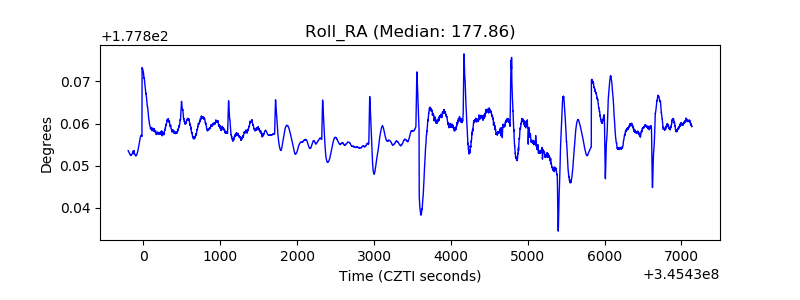 |
| Veto Counter | 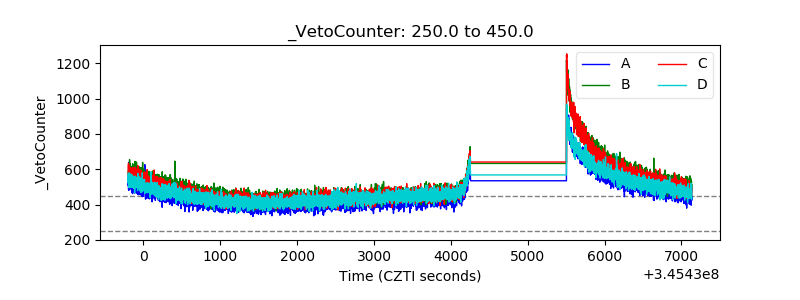 |