| Param | Original file | Final file |
|---|---|---|
| Filename | modeM0/AS1A10_045T04_9000004066_28153cztM0_level2.evt | modeM0/AS1A10_045T04_9000004066_28153cztM0_level2_quad_clean.evt |
| Size (bytes) | 506,597,760 | 109,347,840 |
| Size | 483.1 MB | 104.3 MB |
| Events in quadrant A | 3,358,516 | 726,751 |
| Events in quadrant B | 3,465,492 | 757,357 |
| Events in quadrant C | 3,543,670 | 701,144 |
| Events in quadrant D | 4,530,085 | 669,329 |
| Mode M0 | |||
|---|---|---|---|
| Quadrant | BADHDUFLAG | Total packets | Discarded packets |
| A | 0 | 13897 | 0 |
| B | 0 | 14231 | 0 |
| C | 0 | 14437 | 0 |
| D | 0 | 17991 | 0 |
| Mode M9 | |||
|---|---|---|---|
| Quadrant | BADHDUFLAG | Total packets | Discarded packets |
| A | 0 | 16 | 0 |
| B | 0 | 17 | 0 |
| C | 0 | 17 | 0 |
| D | 0 | 17 | 0 |
| Quadrant | Total seconds | Saturated seconds | Saturation percentage |
|---|---|---|---|
| A | 6559 | 44 | 0.670834% |
| B | 6559 | 71 | 1.082482% |
| C | 6559 | 111 | 1.692331% |
| D | 6559 | 140 | 2.134472% |
Noise dominated data is calculated using 1-second bins in cleaned event files. If a bin has >2000 counts, and if more than 50% of those come from <1% of pixels, then it is considered to be noise-dominated and hence unusable.
| Quadrant | # 1 sec bins | Bins with >0 counts | Bins with >2000 counts | High rate bins dominated by noise | Noise dominated (total time) | Noise dominated (detector-on time) | Marked lightcurve |
|---|---|---|---|---|---|---|---|
| A | 7850 | 6560 | 0 | 0 | 0.00% | 0.00% | 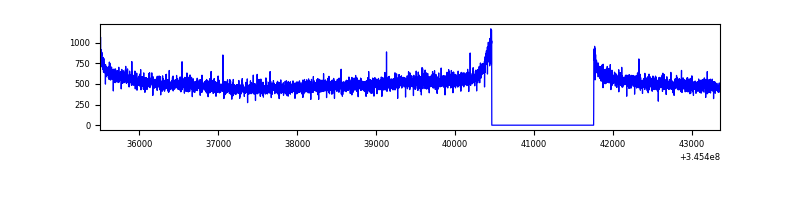 |
| B | 7850 | 6560 | 1 | 1 | 0.01% | 0.02% | 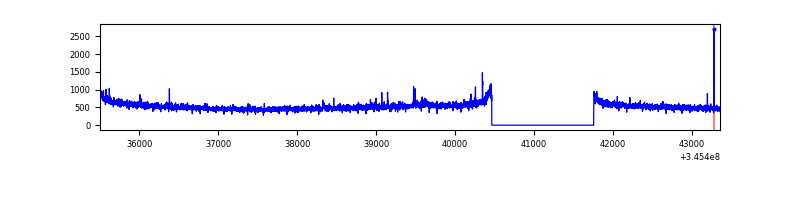 |
| C | 7850 | 6560 | 0 | 0 | 0.00% | 0.00% | 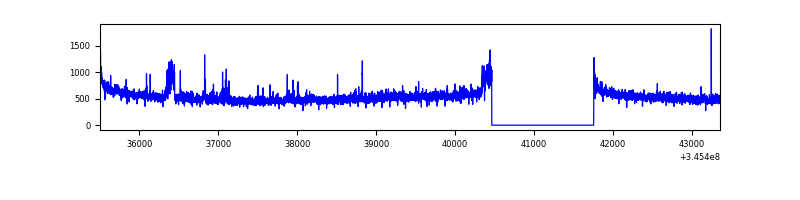 |
| D | 7850 | 6560 | 79 | 79 | 1.01% | 1.20% | 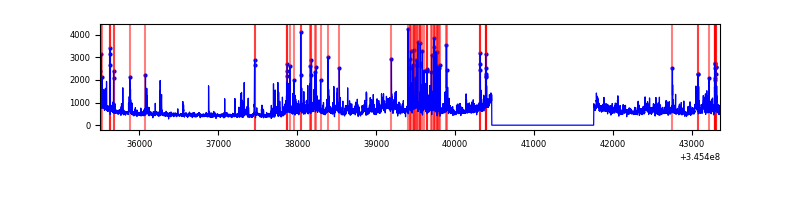 |
Top three noisy pixels from each quadrant. If the there are fewer than three noisy pixels in the level2.evt file, extra rows are filled as -1
| Pixel properties | Quadrant properties | ||||||
|---|---|---|---|---|---|---|---|
| Quadrant | DetID | PixID | Counts | Sigma | Mean | Median | Sigma |
| A | 13 | 254 | 9871 | 52.3 | 870 | 856 | 172.4 |
| A | 3 | 137 | 7867 | 40.67 | 870 | 856 | 172.4 |
| A | 0 | 226 | 7435 | 38.17 | 870 | 856 | 172.4 |
| B | 12 | 111 | 19522 | 114.46 | 872 | 853 | 163.1 |
| B | 11 | 111 | 17694 | 103.25 | 872 | 853 | 163.1 |
| B | 15 | 32 | 17287 | 100.75 | 872 | 853 | 163.1 |
| C | 14 | 238 | 136581 | 702.83 | 833 | 840 | 193.1 |
| C | 3 | 233 | 101550 | 521.45 | 833 | 840 | 193.1 |
| C | 15 | 208 | 32872 | 165.85 | 833 | 840 | 193.1 |
| D | 7 | 223 | 736990 | 3768.96 | 823 | 802 | 195.3 |
| D | 8 | 195 | 274190 | 1399.63 | 823 | 802 | 195.3 |
| D | 1 | 52 | 199092 | 1015.16 | 823 | 802 | 195.3 |
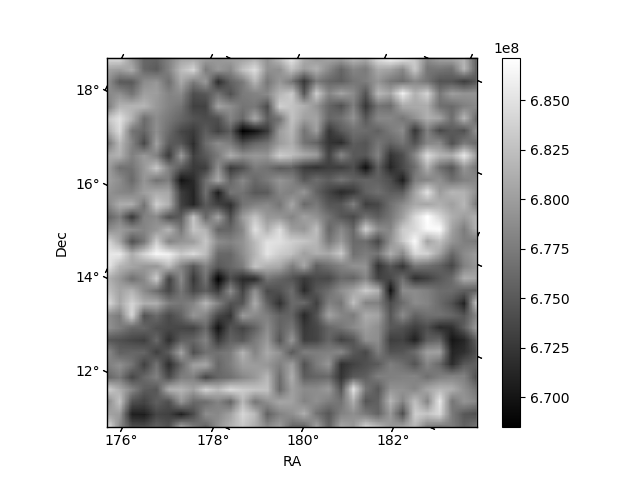
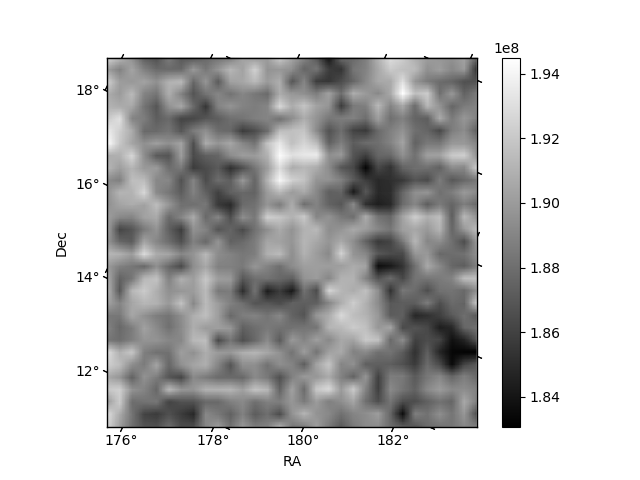
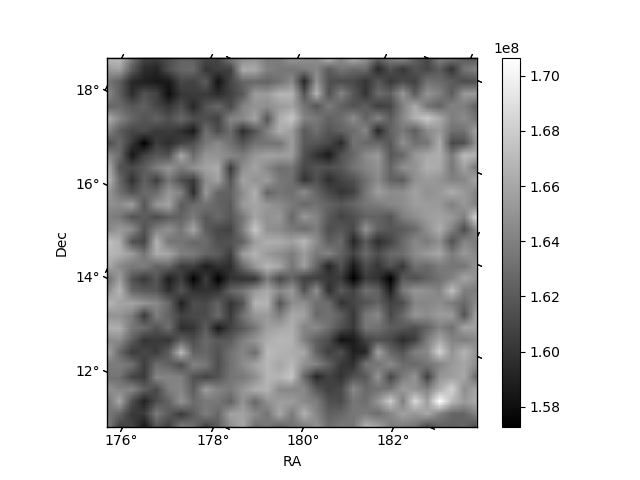
Histogram calculated using DETX and DETY for each event in the final _common_clean file
| Quadrant A | 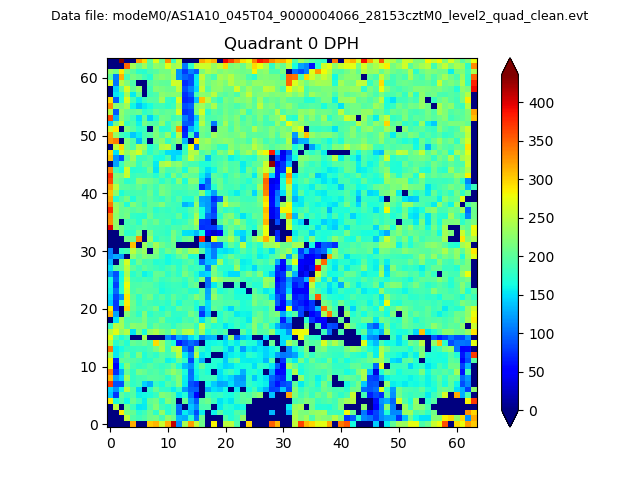 |
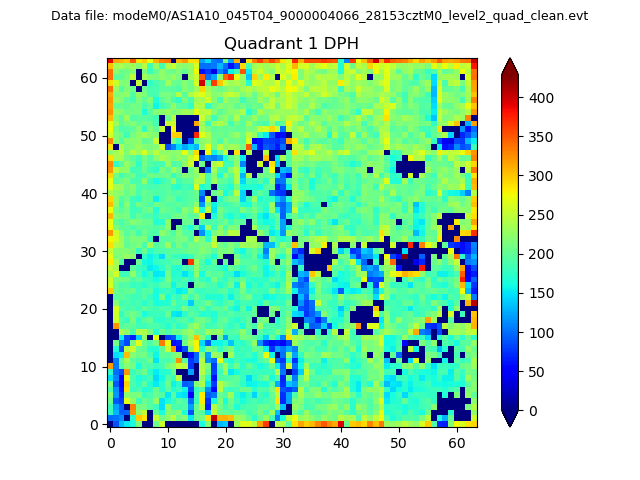 |
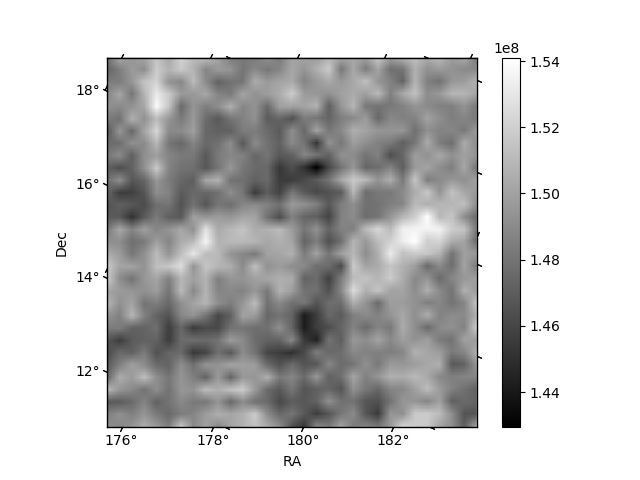
Quadrant B |
|---|---|---|---|
| Quadrant D | 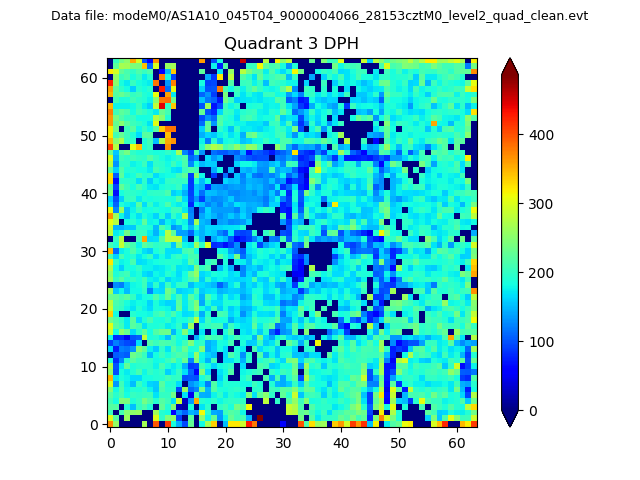 |
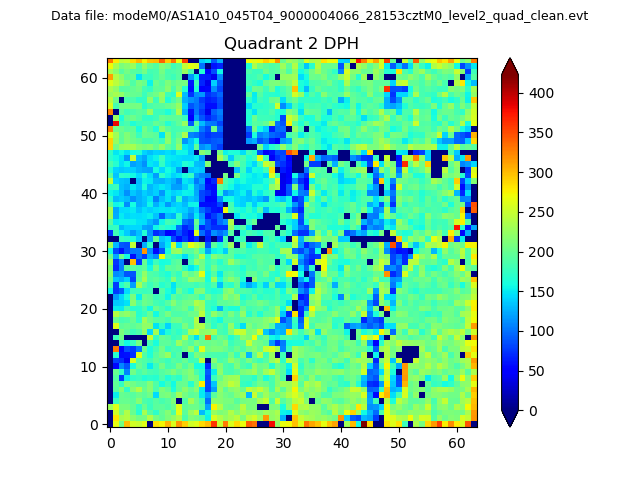 |
Quadrant C |
| Plot type | Count rate plots | Images |
|---|---|---|
| Comparison with Poisson distribution Blue bars denote a histogram of data divided into 1 sec bins. Red curve is a Poisson curve with rate = median count rate of data. |
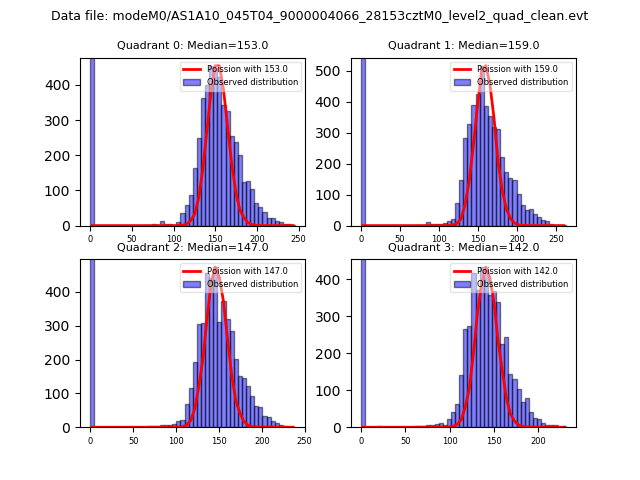 |
 |
| Quadrant-wise count rates Data is divided into 100 sec bins |
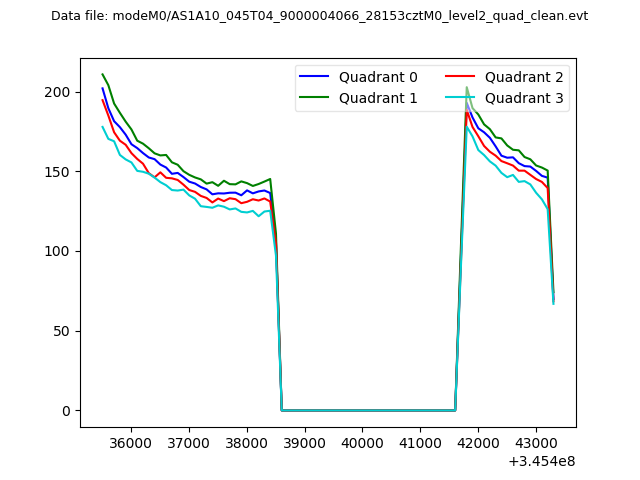 |
|
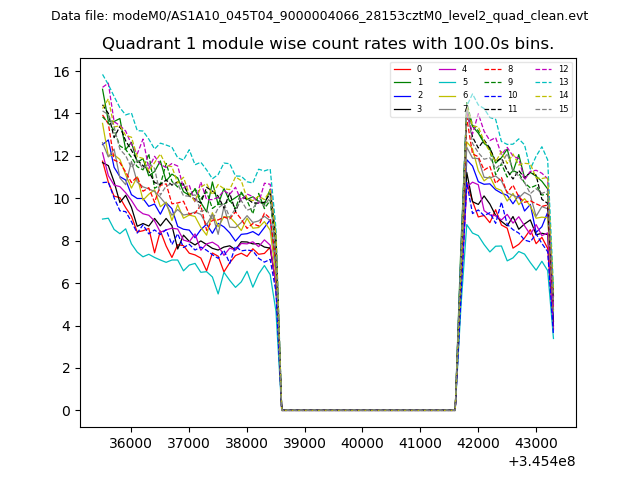
| Module-wise count rates for Quadrant A Data is divided into 100 sec bins |
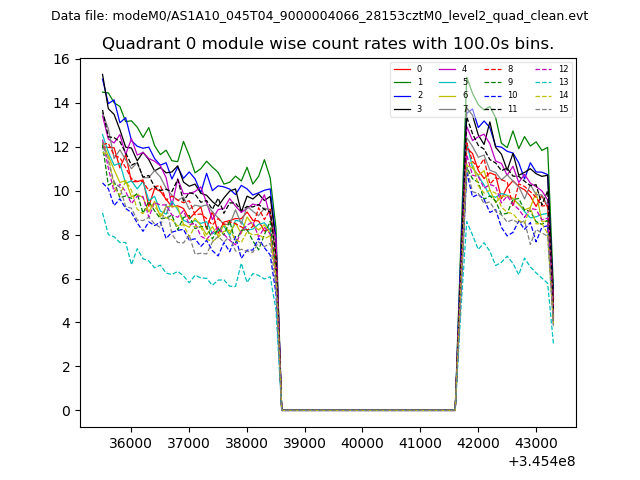 |
 |
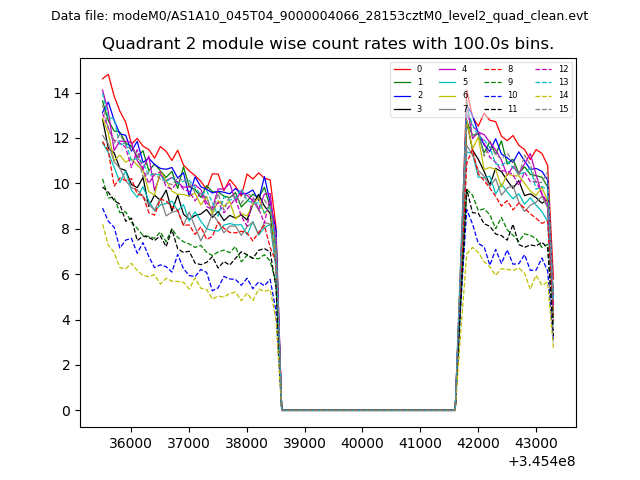
| Module-wise count rates for Quadrant B Data is divided into 100 sec bins |
 |
 |
| Module-wise count rates for Quadrant C Data is divided into 100 sec bins |
 |
 |
| Module-wise count rates for Quadrant D Data is divided into 100 sec bins |
 |
 |
| Parameter | Plot |
|---|---|
| CZT HV Monitor | 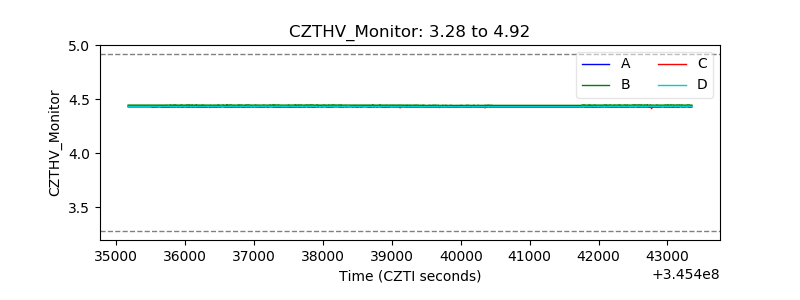 |
| D_VDD | 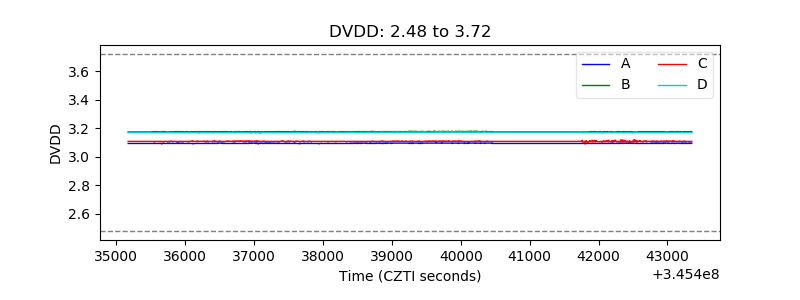 |
| Temperature 1 |  |
| Veto HV Monitor | 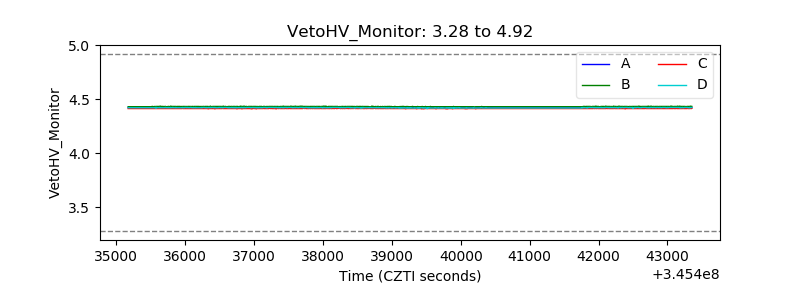 |
| Veto LLD | 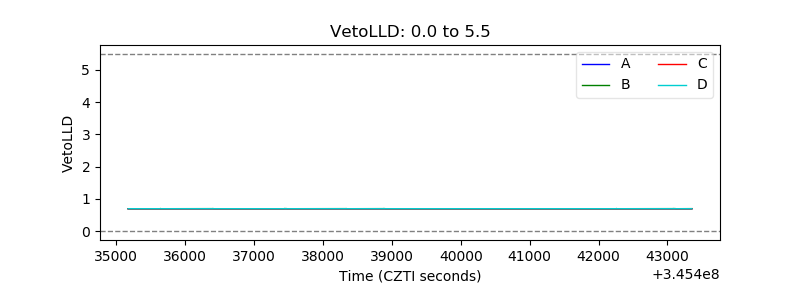 |
| Alpha Counter | 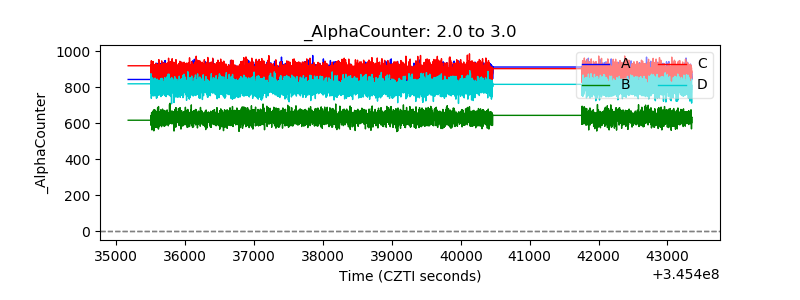 |
| _CPM_Rate | 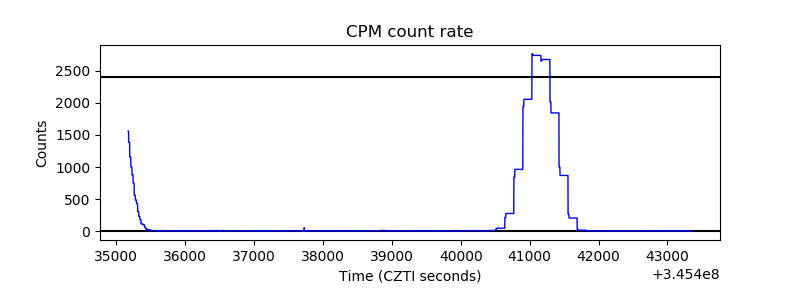 |
| CZT Counter | 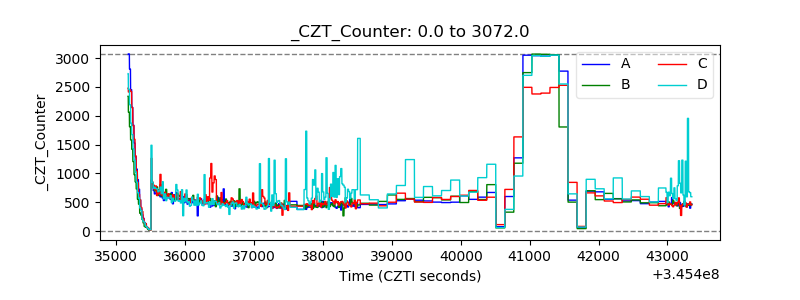 |
| +2.5 Volts monitor |  |
| +5 Volts monitor |  |
| _ROLL_ROT |  |
| _Roll_DEC | 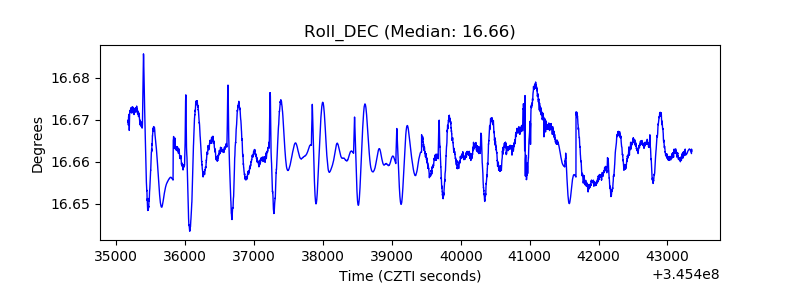 |
| _Roll_RA | 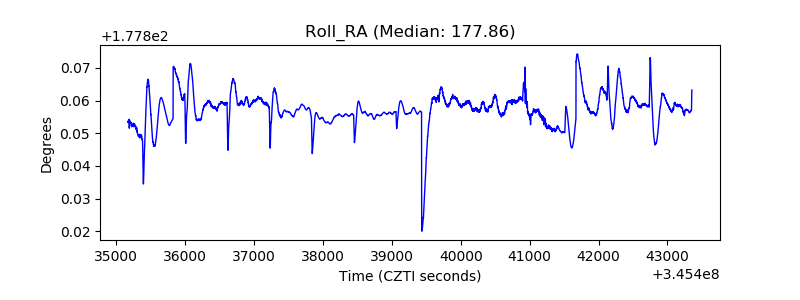 |
| Veto Counter |  |