| Param | Original file | Final file |
|---|---|---|
| Filename | modeM0/AS1A10_045T04_9000004066_28154cztM0_level2.evt | modeM0/AS1A10_045T04_9000004066_28154cztM0_level2_quad_clean.evt |
| Size (bytes) | 498,758,400 | 100,016,640 |
| Size | 475.7 MB | 95.4 MB |
| Events in quadrant A | 3,333,068 | 655,333 |
| Events in quadrant B | 3,419,435 | 677,779 |
| Events in quadrant C | 3,392,430 | 635,564 |
| Events in quadrant D | 4,518,771 | 606,560 |
| Mode M0 | |||
|---|---|---|---|
| Quadrant | BADHDUFLAG | Total packets | Discarded packets |
| A | 0 | 13717 | 0 |
| B | 0 | 13945 | 0 |
| C | 0 | 13895 | 0 |
| D | 0 | 17804 | 0 |
| Mode M9 | |||
|---|---|---|---|
| Quadrant | BADHDUFLAG | Total packets | Discarded packets |
| A | 0 | 16 | 0 |
| B | 0 | 17 | 0 |
| C | 0 | 17 | 0 |
| D | 0 | 17 | 0 |
| Quadrant | Total seconds | Saturated seconds | Saturation percentage |
|---|---|---|---|
| A | 6505 | 51 | 0.784012% |
| B | 6505 | 81 | 1.245196% |
| C | 6505 | 97 | 1.491161% |
| D | 6505 | 109 | 1.675634% |
Noise dominated data is calculated using 1-second bins in cleaned event files. If a bin has >2000 counts, and if more than 50% of those come from <1% of pixels, then it is considered to be noise-dominated and hence unusable.
| Quadrant | # 1 sec bins | Bins with >0 counts | Bins with >2000 counts | High rate bins dominated by noise | Noise dominated (total time) | Noise dominated (detector-on time) | Marked lightcurve |
|---|---|---|---|---|---|---|---|
| A | 7810 | 6506 | 0 | 0 | 0.00% | 0.00% |  |
| B | 7810 | 6506 | 2 | 2 | 0.03% | 0.03% |  |
| C | 7810 | 6506 | 0 | 0 | 0.00% | 0.00% |  |
| D | 7810 | 6506 | 70 | 70 | 0.90% | 1.08% |  |
Top three noisy pixels from each quadrant. If the there are fewer than three noisy pixels in the level2.evt file, extra rows are filled as -1
| Pixel properties | Quadrant properties | ||||||
|---|---|---|---|---|---|---|---|
| Quadrant | DetID | PixID | Counts | Sigma | Mean | Median | Sigma |
| A | 13 | 254 | 9502 | 50.63 | 862 | 849 | 170.9 |
| A | 3 | 137 | 7804 | 40.69 | 862 | 849 | 170.9 |
| A | 0 | 226 | 7361 | 38.1 | 862 | 849 | 170.9 |
| B | 10 | 246 | 39150 | 236.6 | 857 | 840 | 161.9 |
| B | 12 | 111 | 19269 | 113.82 | 857 | 840 | 161.9 |
| B | 11 | 111 | 17744 | 104.4 | 857 | 840 | 161.9 |
| C | 14 | 238 | 135480 | 700.26 | 825 | 831 | 192.3 |
| C | 3 | 233 | 19560 | 97.4 | 825 | 831 | 192.3 |
| C | 2 | 16 | 9999 | 47.68 | 825 | 831 | 192.3 |
| D | 7 | 223 | 733826 | 3738.08 | 822 | 799 | 196.1 |
| D | 7 | 238 | 193775 | 984.08 | 822 | 799 | 196.1 |
| D | 8 | 195 | 174223 | 884.38 | 822 | 799 | 196.1 |
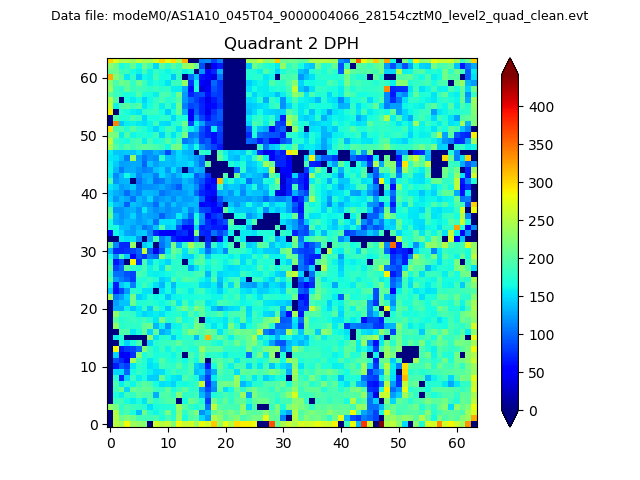
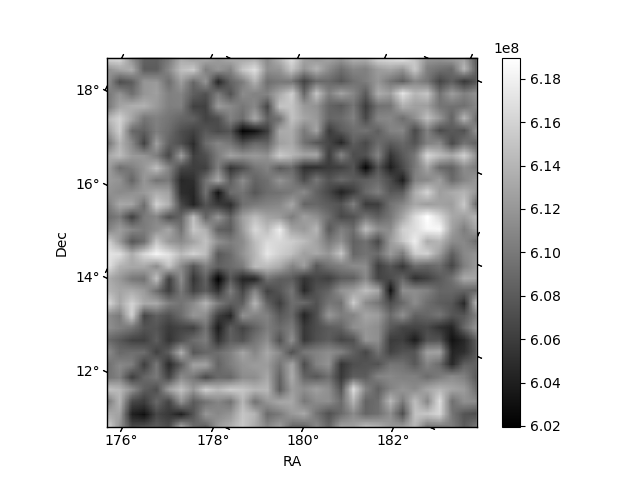
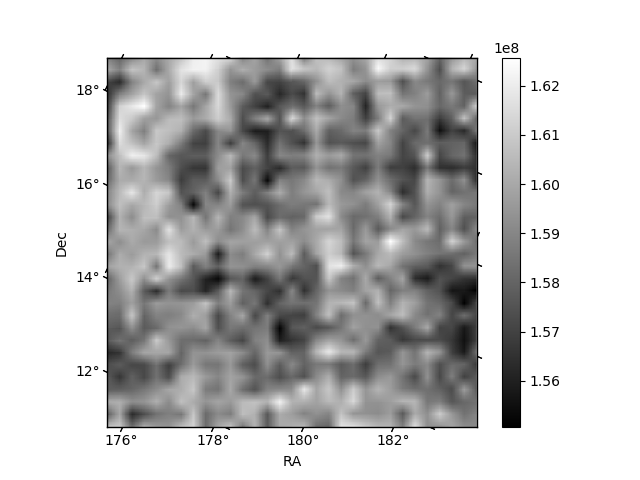
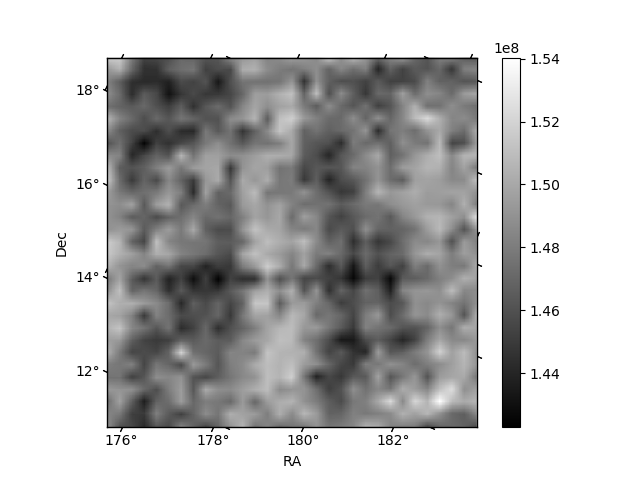
Histogram calculated using DETX and DETY for each event in the final _common_clean file
| Quadrant A | 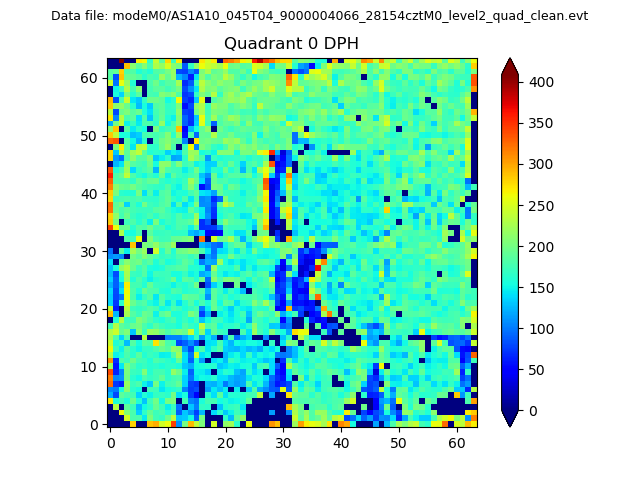 |
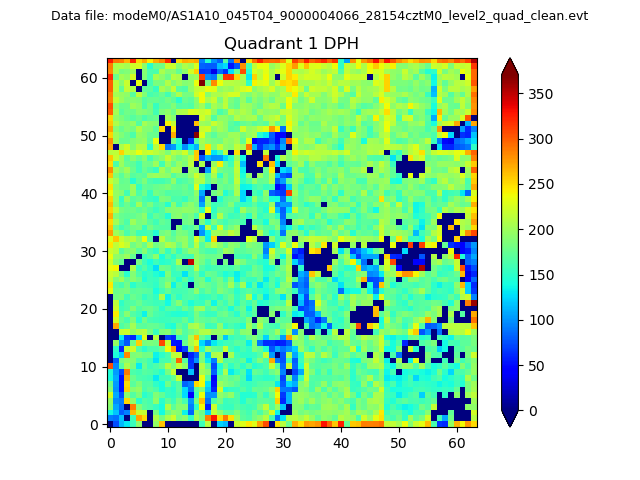 |
Quadrant B |
|---|---|---|---|
| Quadrant D | 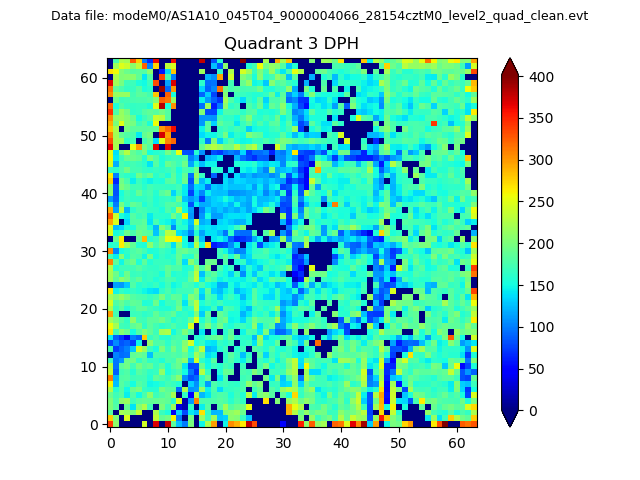 |
 |
Quadrant C |
| Plot type | Count rate plots | Images |
|---|---|---|
| Comparison with Poisson distribution Blue bars denote a histogram of data divided into 1 sec bins. Red curve is a Poisson curve with rate = median count rate of data. |
 |
 |
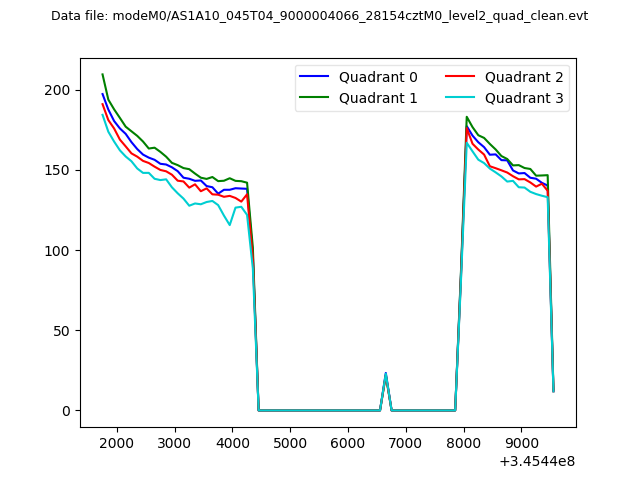
| Quadrant-wise count rates Data is divided into 100 sec bins |
 |
|
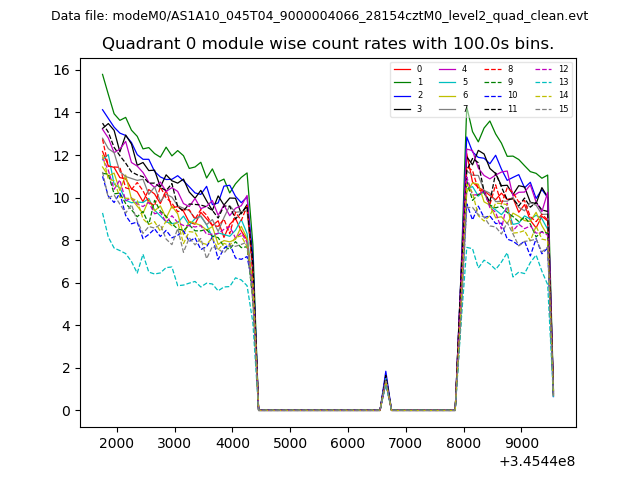
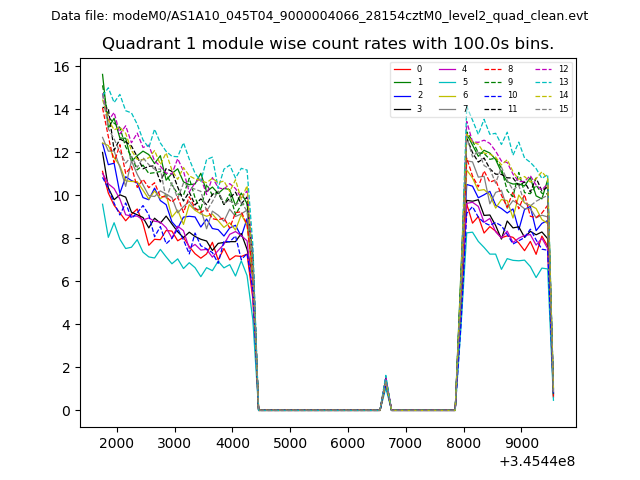
| Module-wise count rates for Quadrant A Data is divided into 100 sec bins |
 |
 |
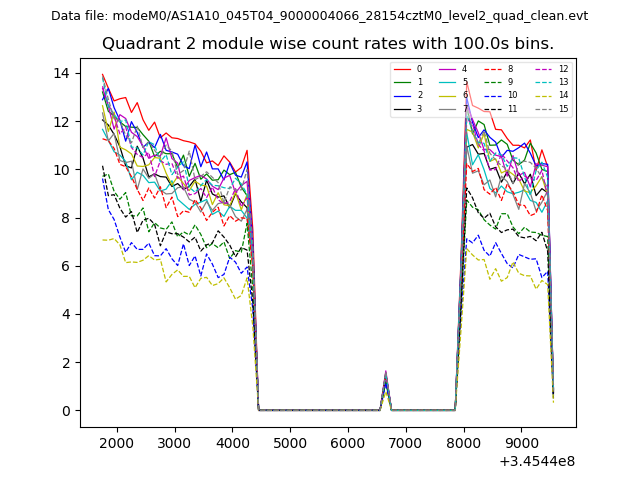
| Module-wise count rates for Quadrant B Data is divided into 100 sec bins |
 |
 |
| Module-wise count rates for Quadrant C Data is divided into 100 sec bins |
 |
 |
| Module-wise count rates for Quadrant D Data is divided into 100 sec bins |
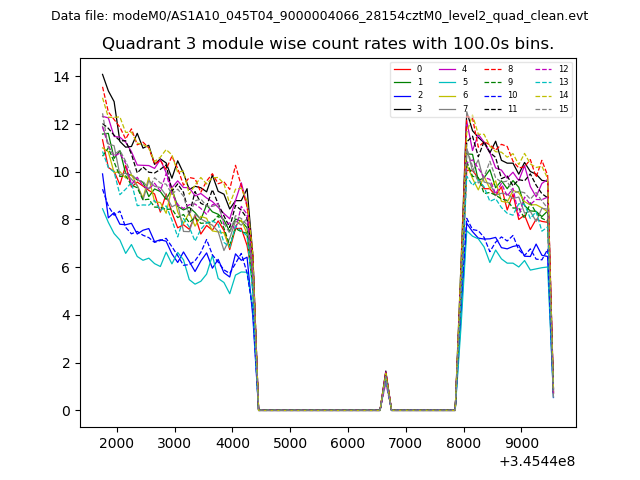 |
 |
| Parameter | Plot |
|---|---|
| CZT HV Monitor |  |
| D_VDD | 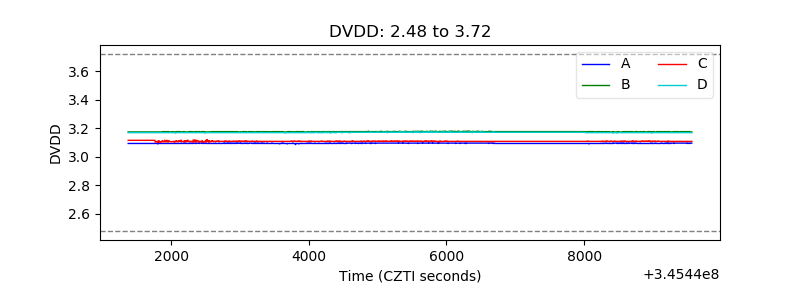 |
| Temperature 1 | 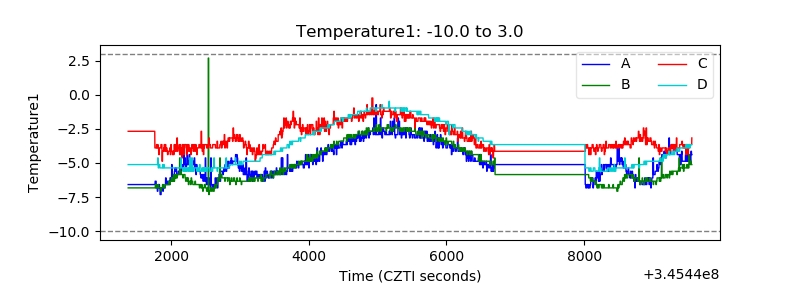 |
| Veto HV Monitor | 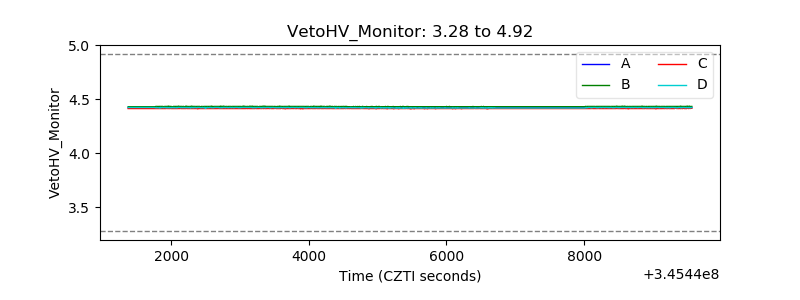 |
| Veto LLD | 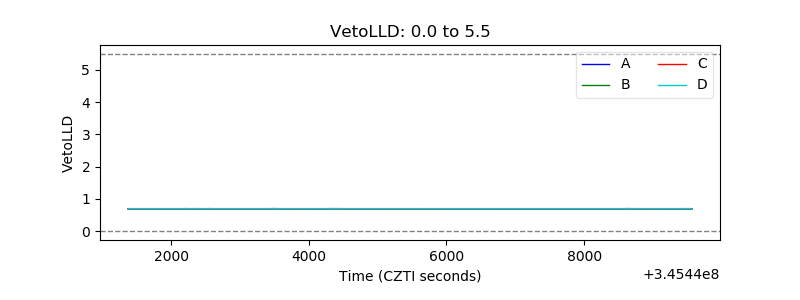 |
| Alpha Counter | 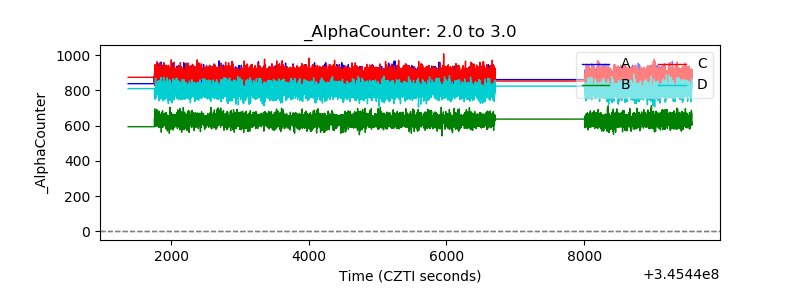 |
| _CPM_Rate | 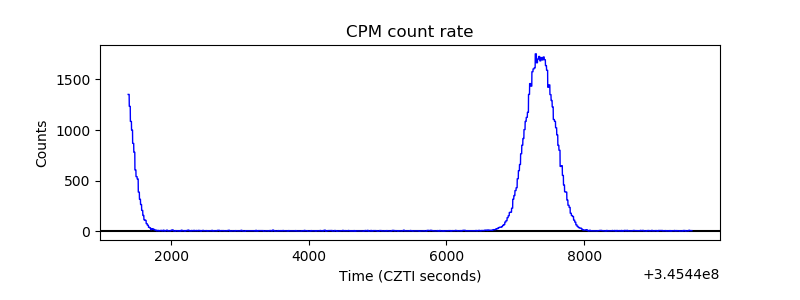 |
| CZT Counter | 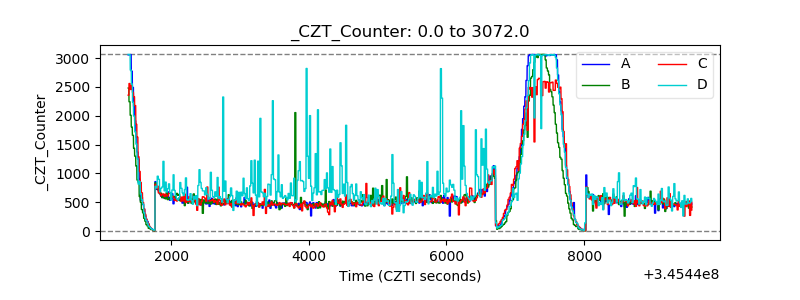 |
| +2.5 Volts monitor |  |
| +5 Volts monitor |  |
| _ROLL_ROT | 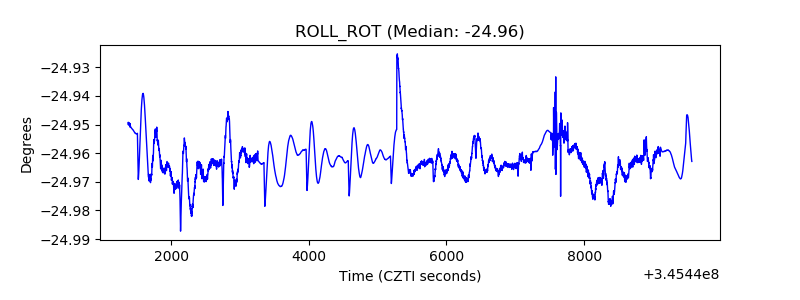 |
| _Roll_DEC | 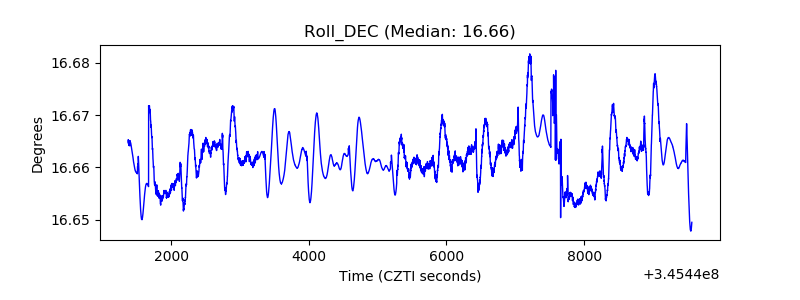 |
| _Roll_RA | 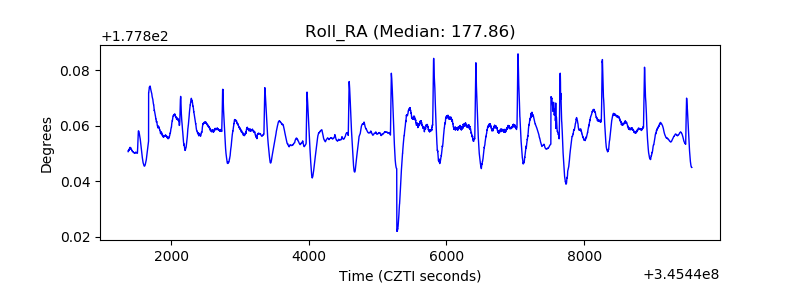 |
| Veto Counter | 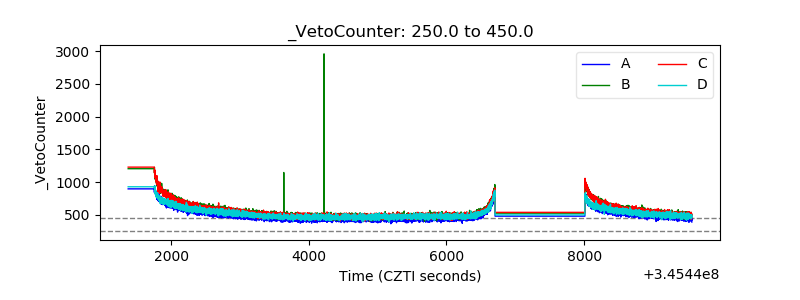 |