| Param | Original file | Final file |
|---|---|---|
| Filename | modeM0/AS1A10_045T04_9000004066_28155cztM0_level2.evt | modeM0/AS1A10_045T04_9000004066_28155cztM0_level2_quad_clean.evt |
| Size (bytes) | 485,061,120 | 96,840,000 |
| Size | 462.6 MB | 92.4 MB |
| Events in quadrant A | 3,289,345 | 631,681 |
| Events in quadrant B | 3,426,255 | 645,432 |
| Events in quadrant C | 3,353,674 | 614,247 |
| Events in quadrant D | 4,178,208 | 586,667 |
| Mode M0 | |||
|---|---|---|---|
| Quadrant | BADHDUFLAG | Total packets | Discarded packets |
| A | 0 | 13618 | 0 |
| B | 0 | 14028 | 0 |
| C | 0 | 13827 | 0 |
| D | 0 | 16535 | 0 |
| Mode M9 | |||
|---|---|---|---|
| Quadrant | BADHDUFLAG | Total packets | Discarded packets |
| A | 0 | 15 | 0 |
| B | 0 | 16 | 0 |
| C | 0 | 16 | 0 |
| D | 0 | 16 | 0 |
| Quadrant | Total seconds | Saturated seconds | Saturation percentage |
|---|---|---|---|
| A | 6519 | 58 | 0.889707% |
| B | 6519 | 115 | 1.764074% |
| C | 6519 | 102 | 1.564657% |
| D | 6519 | 156 | 2.393005% |
Noise dominated data is calculated using 1-second bins in cleaned event files. If a bin has >2000 counts, and if more than 50% of those come from <1% of pixels, then it is considered to be noise-dominated and hence unusable.
| Quadrant | # 1 sec bins | Bins with >0 counts | Bins with >2000 counts | High rate bins dominated by noise | Noise dominated (total time) | Noise dominated (detector-on time) | Marked lightcurve |
|---|---|---|---|---|---|---|---|
| A | 7699 | 6520 | 0 | 0 | 0.00% | 0.00% | 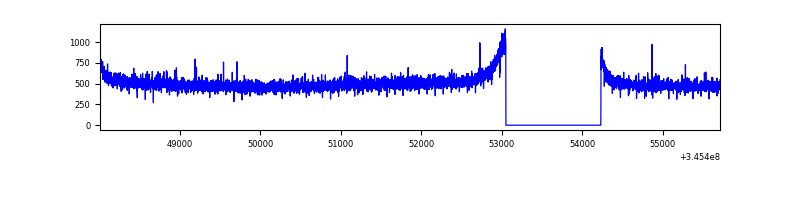 |
| B | 7699 | 6520 | 12 | 12 | 0.16% | 0.18% | 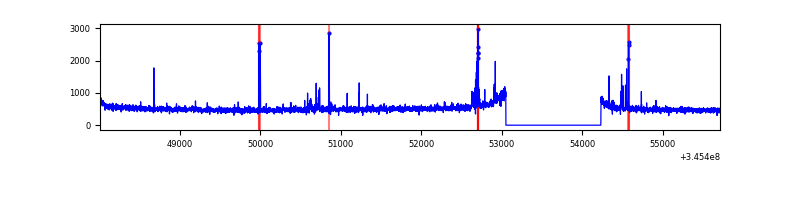 |
| C | 7699 | 6520 | 0 | 0 | 0.00% | 0.00% | 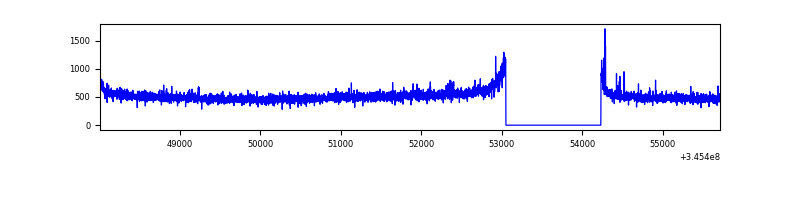 |
| D | 7699 | 6520 | 94 | 94 | 1.22% | 1.44% | 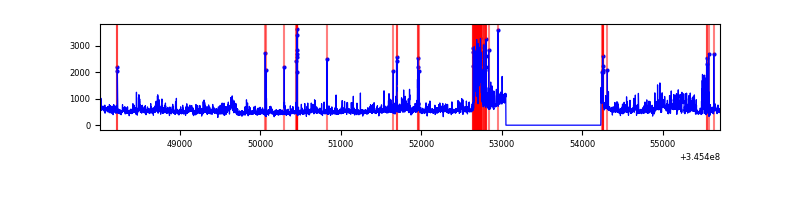 |
Top three noisy pixels from each quadrant. If the there are fewer than three noisy pixels in the level2.evt file, extra rows are filled as -1
| Pixel properties | Quadrant properties | ||||||
|---|---|---|---|---|---|---|---|
| Quadrant | DetID | PixID | Counts | Sigma | Mean | Median | Sigma |
| A | 13 | 254 | 9807 | 52.72 | 852 | 836 | 170.2 |
| A | 3 | 137 | 7881 | 41.4 | 852 | 836 | 170.2 |
| A | 0 | 226 | 7391 | 38.52 | 852 | 836 | 170.2 |
| B | 10 | 245 | 93682 | 584.73 | 840 | 819 | 158.8 |
| B | 10 | 246 | 28800 | 176.19 | 840 | 819 | 158.8 |
| B | 12 | 111 | 19356 | 116.72 | 840 | 819 | 158.8 |
| C | 14 | 238 | 132679 | 694.42 | 812 | 820 | 189.9 |
| C | 3 | 233 | 53434 | 277.08 | 812 | 820 | 189.9 |
| C | 13 | 61 | 5587 | 25.1 | 812 | 820 | 189.9 |
| D | 7 | 223 | 492770 | 2552.16 | 812 | 793 | 192.8 |
| D | 2 | 250 | 260712 | 1348.35 | 812 | 793 | 192.8 |
| D | 1 | 52 | 177767 | 918.06 | 812 | 793 | 192.8 |
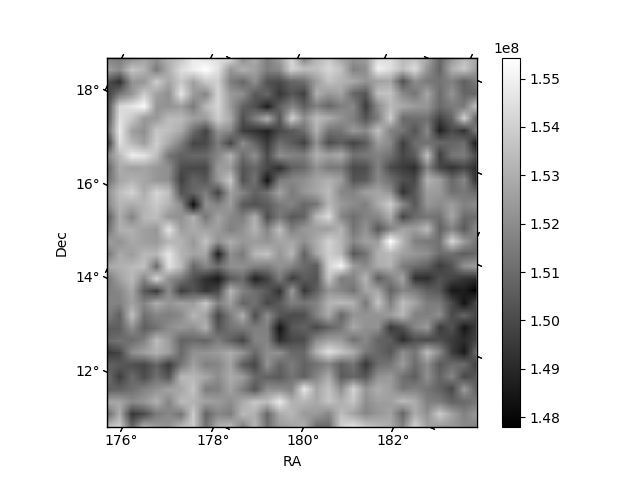
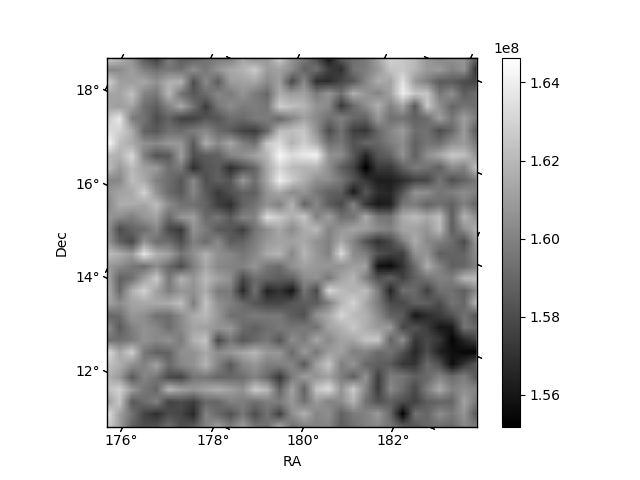
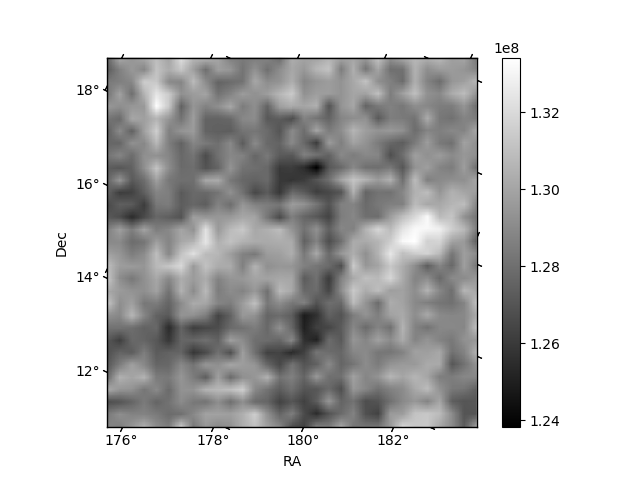
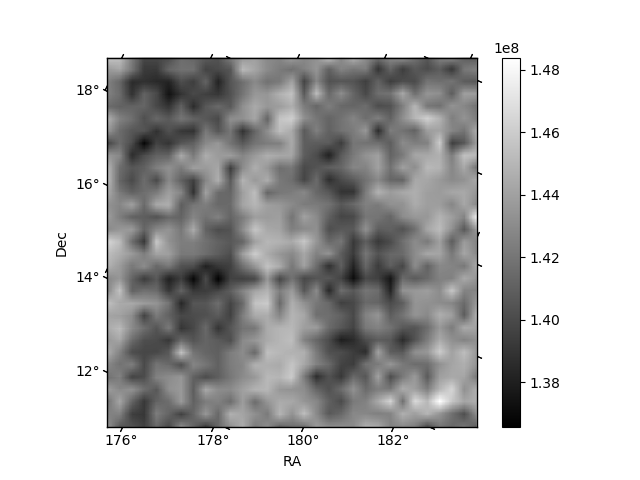
Histogram calculated using DETX and DETY for each event in the final _common_clean file
| Quadrant A |  |
 |
Quadrant B |
|---|---|---|---|
| Quadrant D | 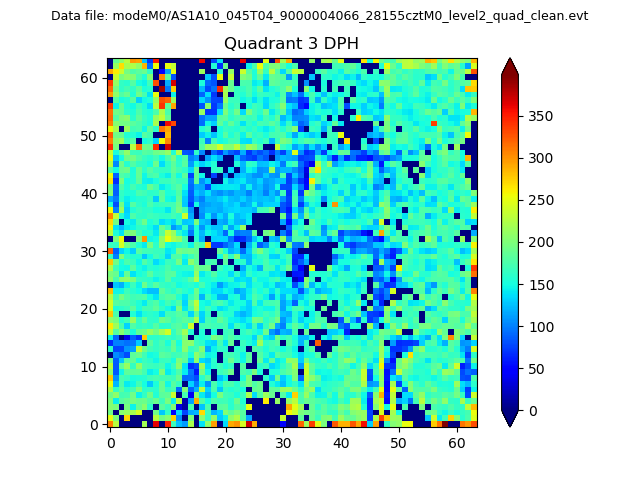 |
 |
Quadrant C |
| Plot type | Count rate plots | Images |
|---|---|---|
| Comparison with Poisson distribution Blue bars denote a histogram of data divided into 1 sec bins. Red curve is a Poisson curve with rate = median count rate of data. |
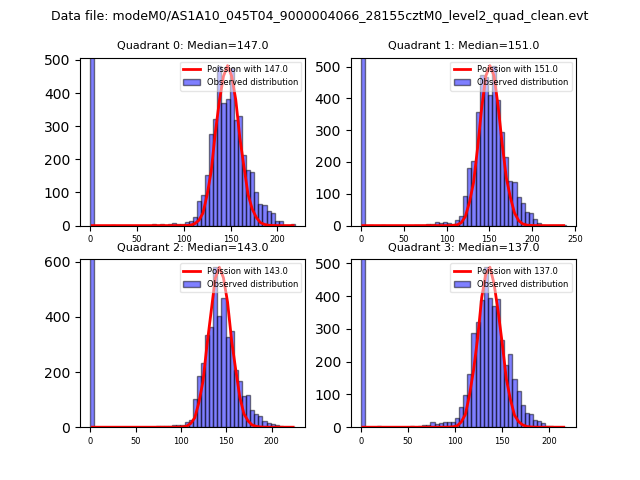 |
 |
| Quadrant-wise count rates Data is divided into 100 sec bins |
 |
|
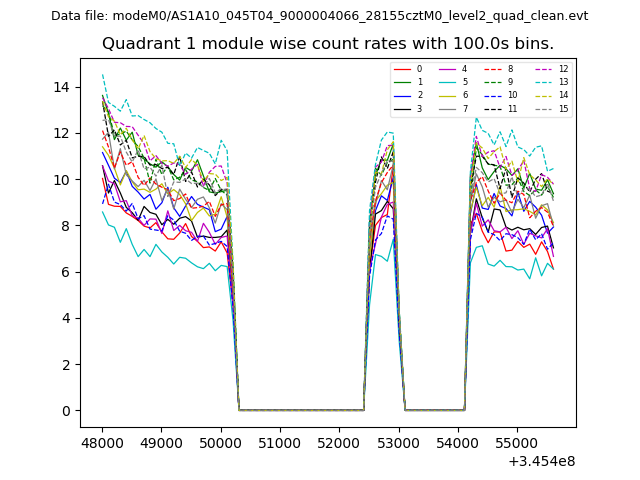
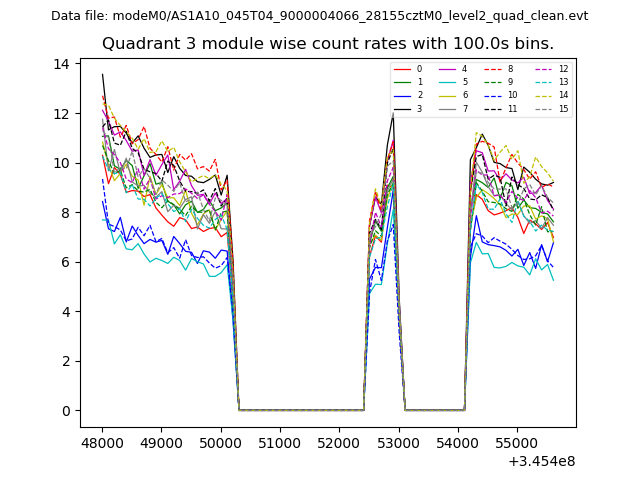
| Module-wise count rates for Quadrant A Data is divided into 100 sec bins |
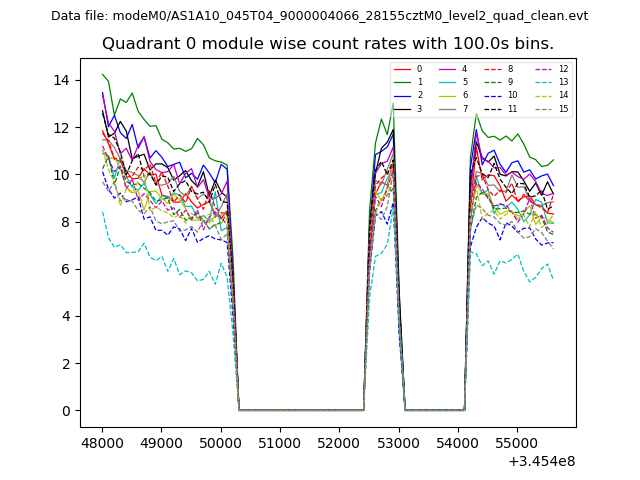 |
 |
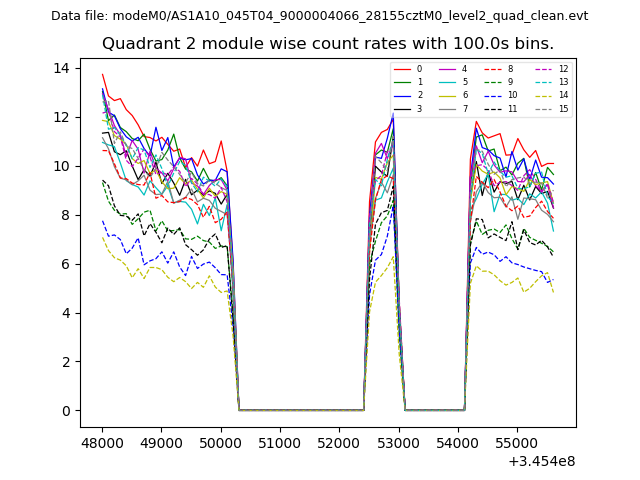
| Module-wise count rates for Quadrant B Data is divided into 100 sec bins |
 |
 |
| Module-wise count rates for Quadrant C Data is divided into 100 sec bins |
 |
 |
| Module-wise count rates for Quadrant D Data is divided into 100 sec bins |
 |
 |
| Parameter | Plot |
|---|---|
| CZT HV Monitor |  |
| D_VDD | 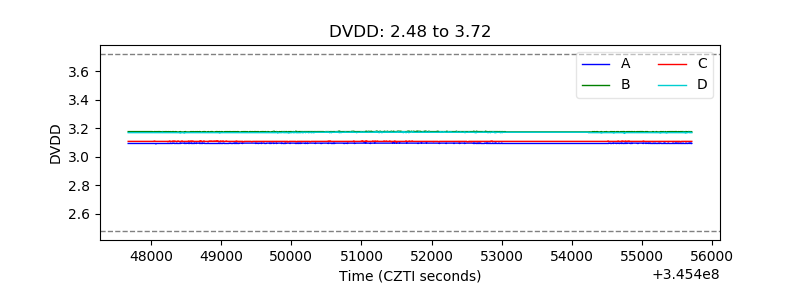 |
| Temperature 1 | 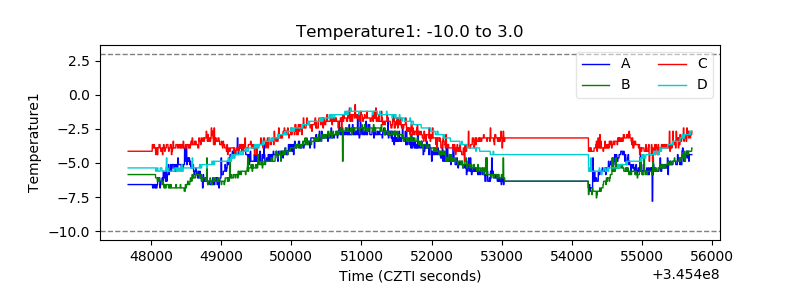 |
| Veto HV Monitor | 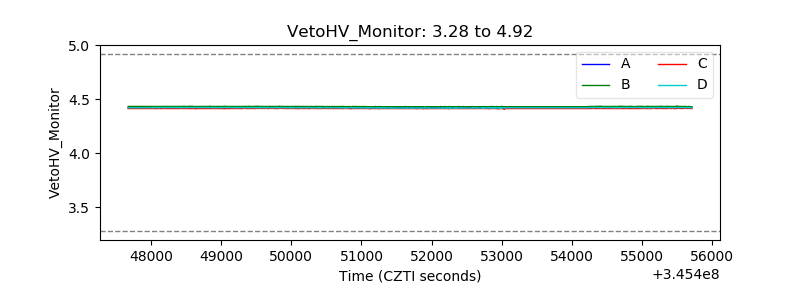 |
| Veto LLD | 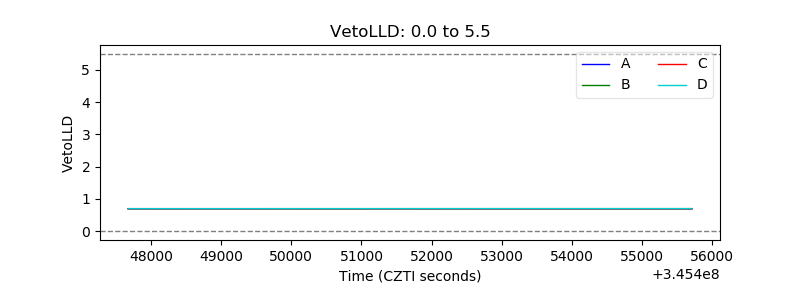 |
| Alpha Counter | 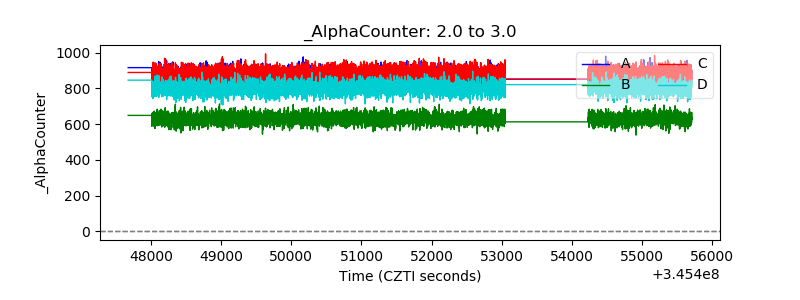 |
| _CPM_Rate | 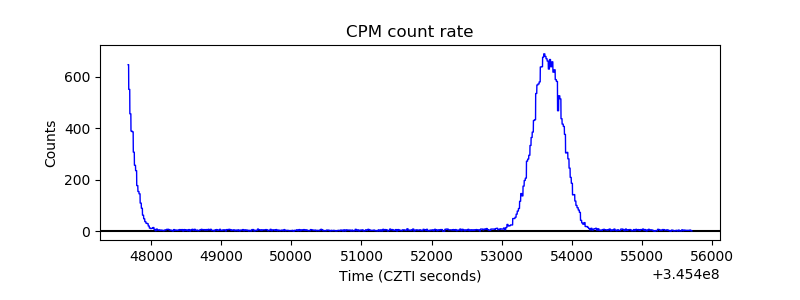 |
| CZT Counter | 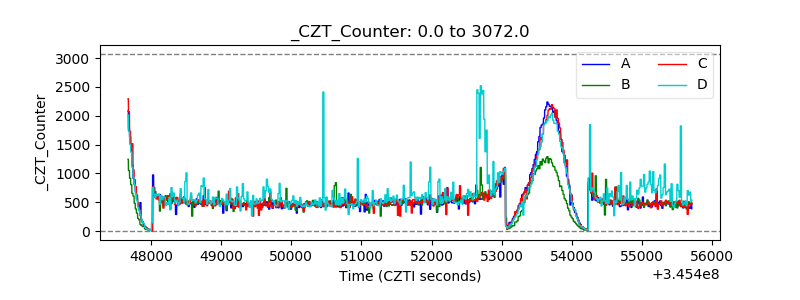 |
| +2.5 Volts monitor |  |
| +5 Volts monitor |  |
| _ROLL_ROT | 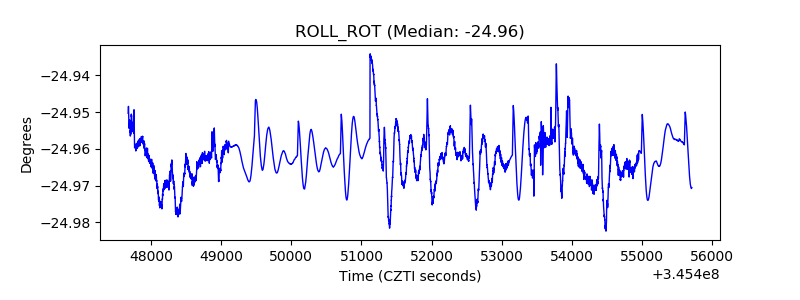 |
| _Roll_DEC | 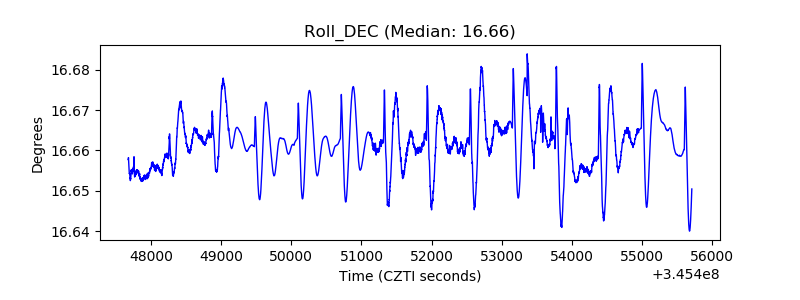 |
| _Roll_RA | 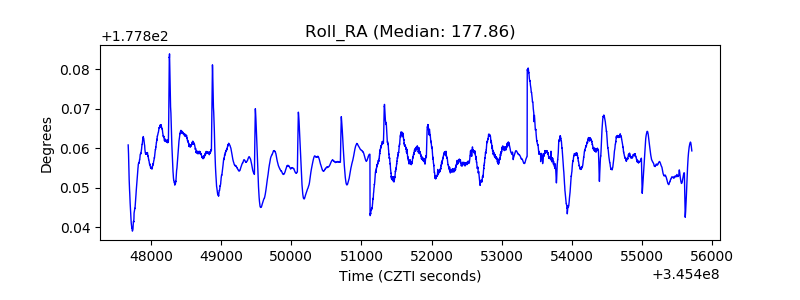 |
| Veto Counter | 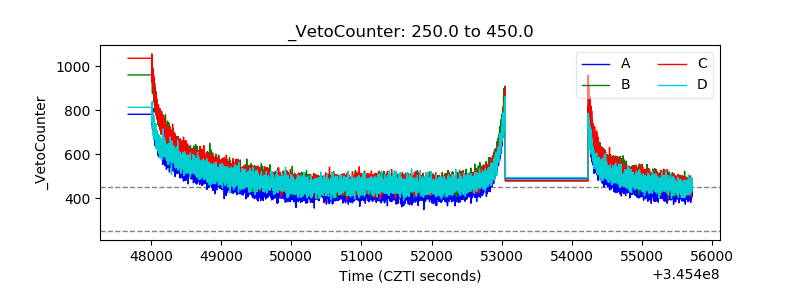 |