| Param | Original file | Final file |
|---|---|---|
| Filename | modeM0/AS1A10_045T04_9000004066_28156cztM0_level2.evt | modeM0/AS1A10_045T04_9000004066_28156cztM0_level2_quad_clean.evt |
| Size (bytes) | 498,369,600 | 91,117,440 |
| Size | 475.3 MB | 86.9 MB |
| Events in quadrant A | 3,162,740 | 588,397 |
| Events in quadrant B | 3,263,538 | 603,247 |
| Events in quadrant C | 3,342,080 | 572,959 |
| Events in quadrant D | 4,880,386 | 537,932 |
| Mode M0 | |||
|---|---|---|---|
| Quadrant | BADHDUFLAG | Total packets | Discarded packets |
| A | 0 | 13368 | 0 |
| B | 0 | 13619 | 0 |
| C | 0 | 13752 | 0 |
| D | 0 | 19010 | 0 |
| Mode M9 | |||
|---|---|---|---|
| Quadrant | BADHDUFLAG | Total packets | Discarded packets |
| A | 0 | 9 | 0 |
| B | 0 | 9 | 0 |
| C | 0 | 9 | 0 |
| D | 0 | 9 | 0 |
| Quadrant | Total seconds | Saturated seconds | Saturation percentage |
|---|---|---|---|
| A | 6544 | 46 | 0.702934% |
| B | 6545 | 66 | 1.008403% |
| C | 6545 | 71 | 1.084798% |
| D | 6545 | 298 | 4.553094% |
Noise dominated data is calculated using 1-second bins in cleaned event files. If a bin has >2000 counts, and if more than 50% of those come from <1% of pixels, then it is considered to be noise-dominated and hence unusable.
| Quadrant | # 1 sec bins | Bins with >0 counts | Bins with >2000 counts | High rate bins dominated by noise | Noise dominated (total time) | Noise dominated (detector-on time) | Marked lightcurve |
|---|---|---|---|---|---|---|---|
| A | 7484 | 6544 | 0 | 0 | 0.00% | 0.00% | 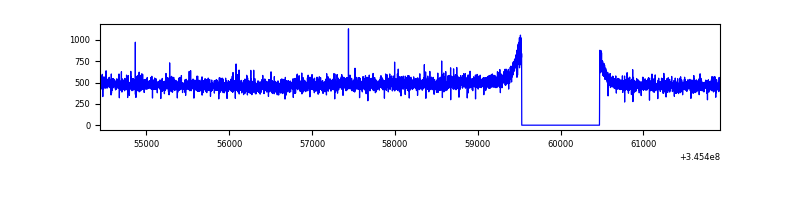 |
| B | 7485 | 6546 | 12 | 12 | 0.16% | 0.18% | 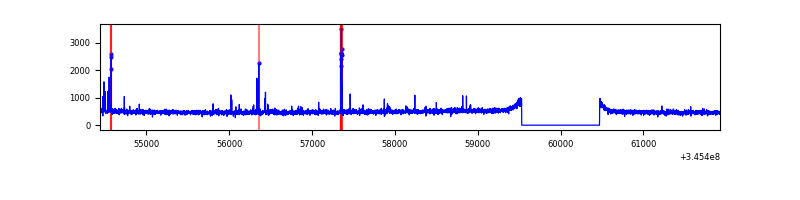 |
| C | 7485 | 6546 | 3 | 3 | 0.04% | 0.05% | 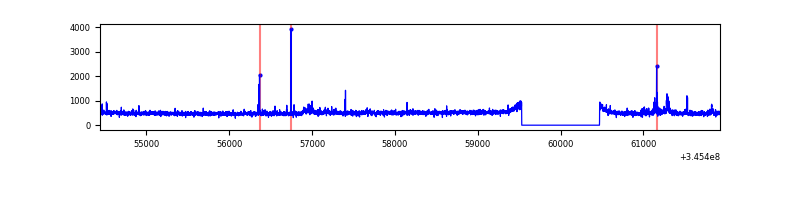 |
| D | 7485 | 6546 | 233 | 233 | 3.11% | 3.56% | 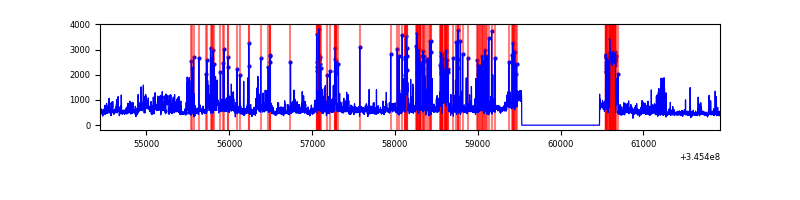 |
Top three noisy pixels from each quadrant. If the there are fewer than three noisy pixels in the level2.evt file, extra rows are filled as -1
| Pixel properties | Quadrant properties | ||||||
|---|---|---|---|---|---|---|---|
| Quadrant | DetID | PixID | Counts | Sigma | Mean | Median | Sigma |
| A | 13 | 254 | 9867 | 54.93 | 819 | 804 | 165.0 |
| A | 3 | 137 | 7556 | 40.93 | 819 | 804 | 165.0 |
| A | 0 | 226 | 7098 | 38.15 | 819 | 804 | 165.0 |
| B | 10 | 245 | 63971 | 406.56 | 808 | 789 | 155.4 |
| B | 12 | 111 | 19049 | 117.5 | 808 | 789 | 155.4 |
| B | 11 | 111 | 17328 | 106.42 | 808 | 789 | 155.4 |
| C | 14 | 238 | 127331 | 689.23 | 785 | 790 | 183.6 |
| C | 3 | 233 | 98918 | 534.47 | 785 | 790 | 183.6 |
| C | 2 | 16 | 55048 | 295.53 | 785 | 790 | 183.6 |
| D | 7 | 223 | 536065 | 2874.58 | 778 | 760 | 186.2 |
| D | 8 | 195 | 434680 | 2330.14 | 778 | 760 | 186.2 |
| D | 1 | 52 | 387845 | 2078.64 | 778 | 760 | 186.2 |
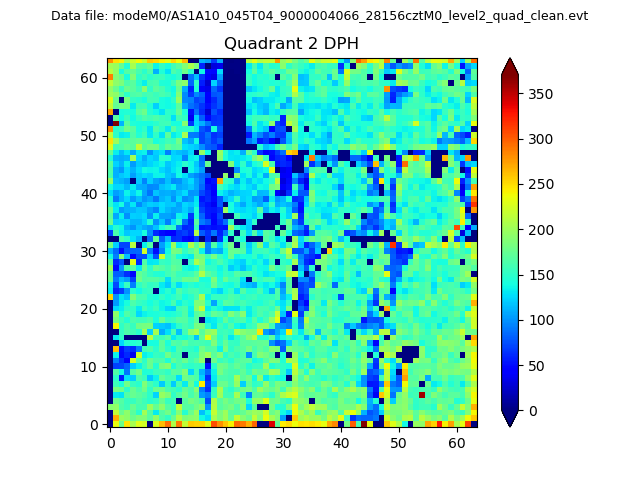
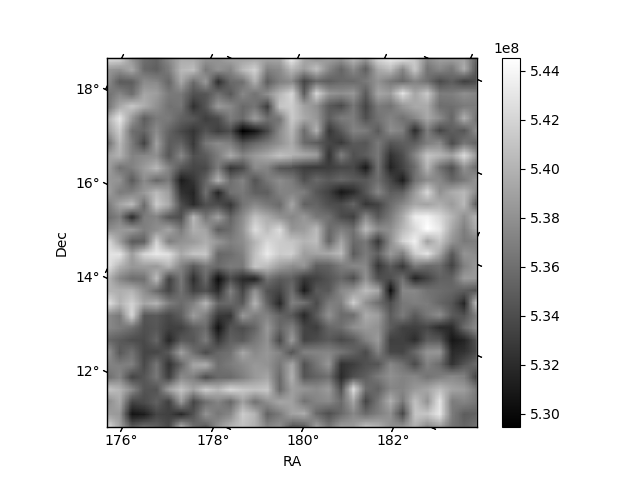
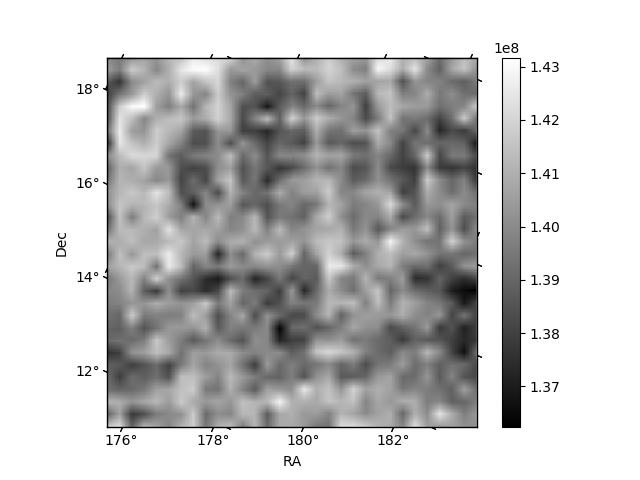
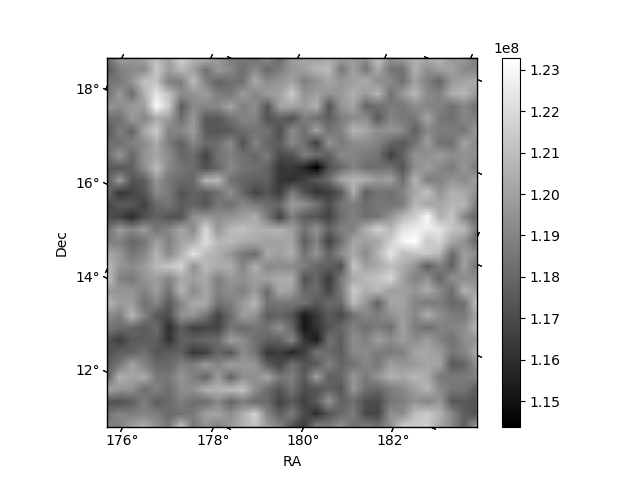
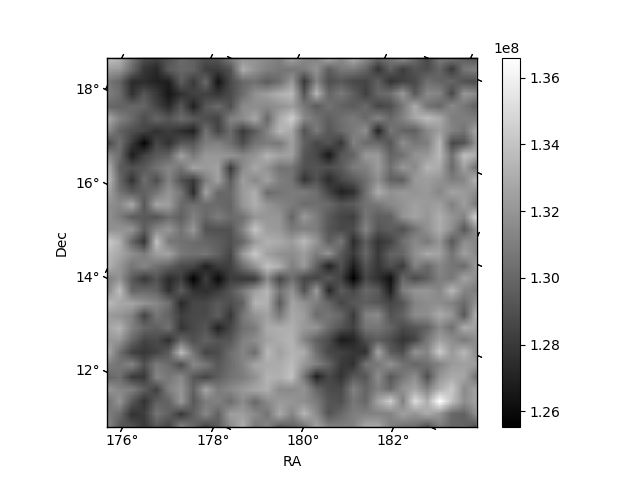
Histogram calculated using DETX and DETY for each event in the final _common_clean file
| Quadrant A | 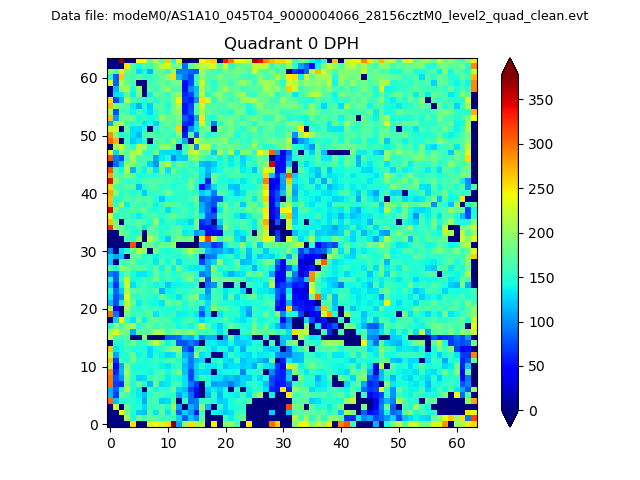 |
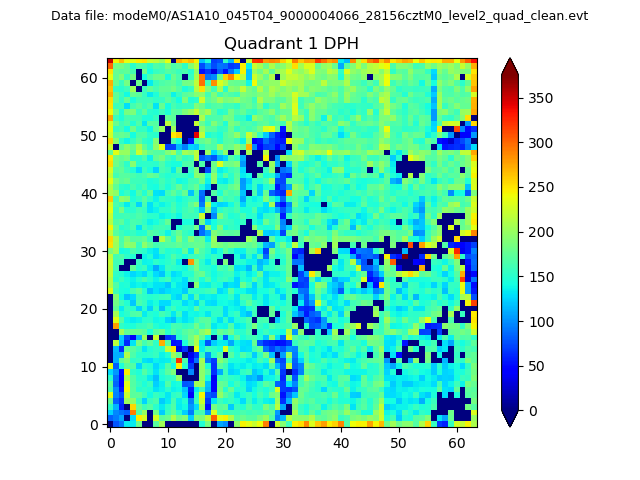 |
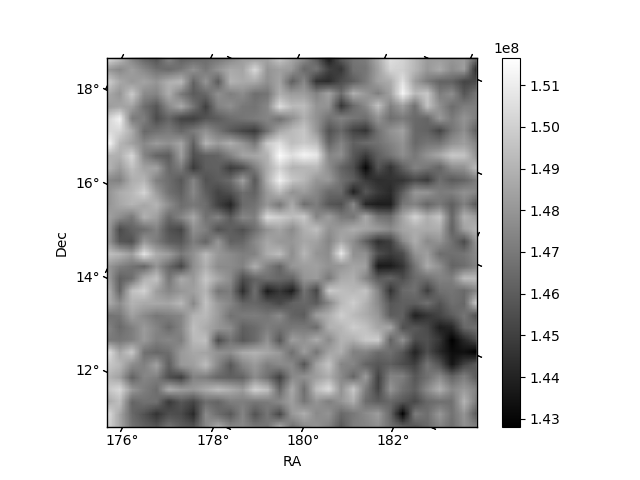
Quadrant B |
|---|---|---|---|
| Quadrant D | 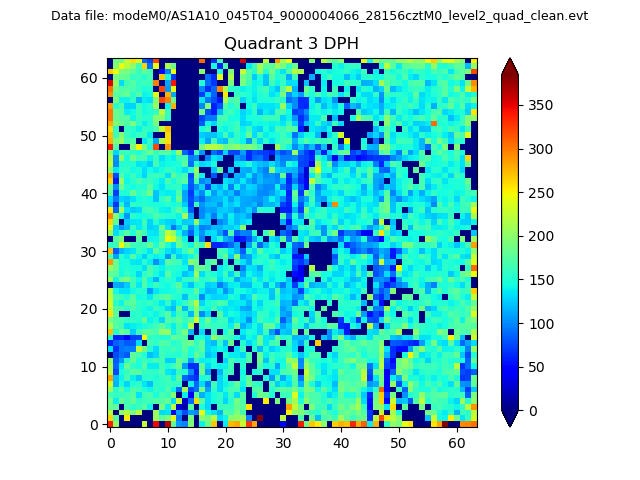 |
 |
Quadrant C |
| Plot type | Count rate plots | Images |
|---|---|---|
| Comparison with Poisson distribution Blue bars denote a histogram of data divided into 1 sec bins. Red curve is a Poisson curve with rate = median count rate of data. |
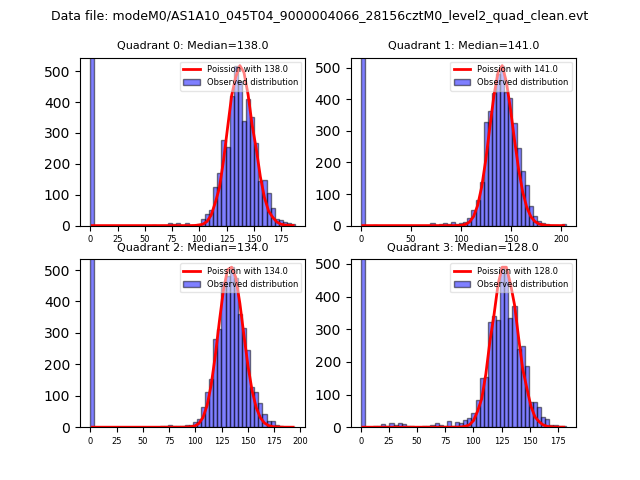 |
 |
| Quadrant-wise count rates Data is divided into 100 sec bins |
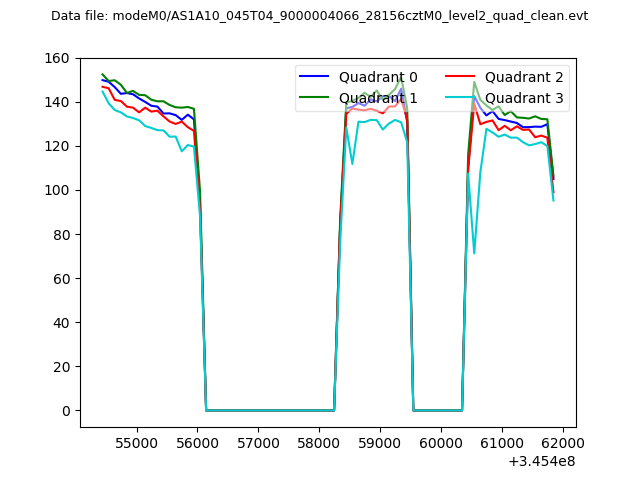 |
|
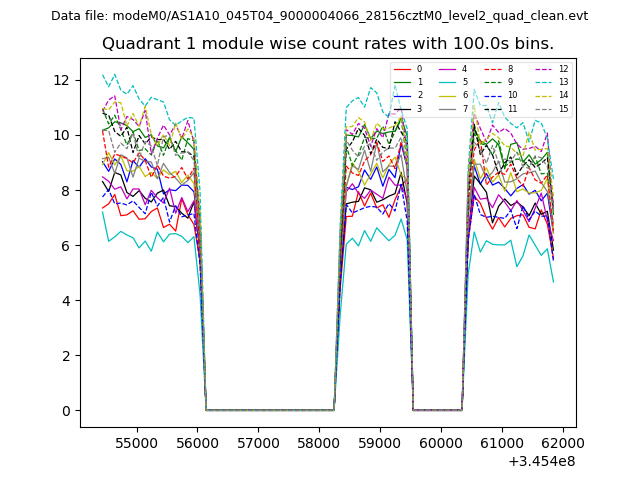
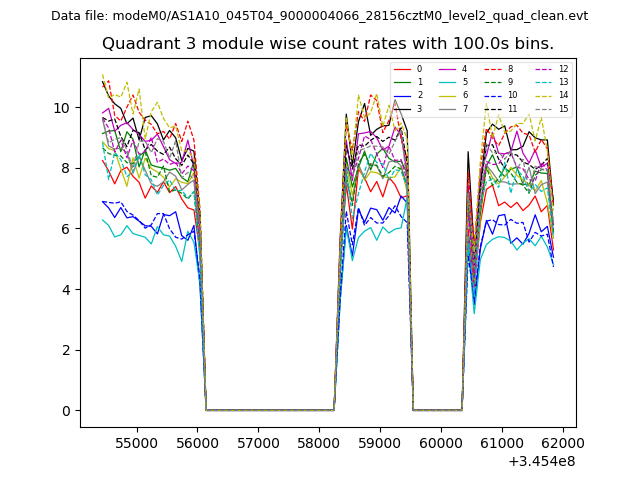
| Module-wise count rates for Quadrant A Data is divided into 100 sec bins |
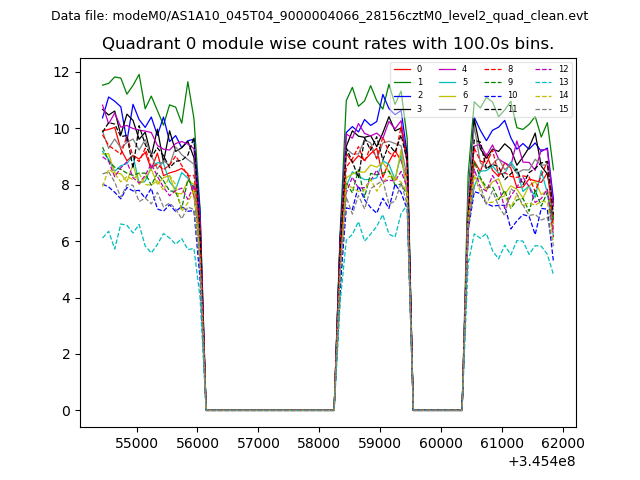 |
 |
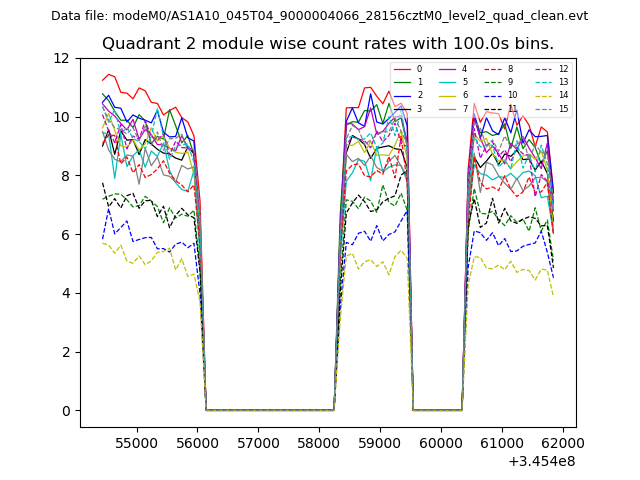
| Module-wise count rates for Quadrant B Data is divided into 100 sec bins |
 |
 |
| Module-wise count rates for Quadrant C Data is divided into 100 sec bins |
 |
 |
| Module-wise count rates for Quadrant D Data is divided into 100 sec bins |
 |
 |
| Parameter | Plot |
|---|---|
| CZT HV Monitor | 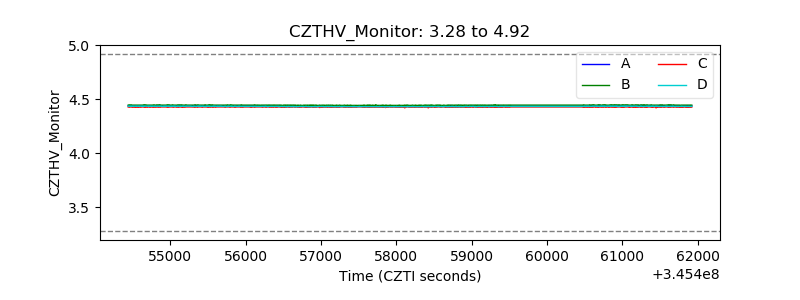 |
| D_VDD | 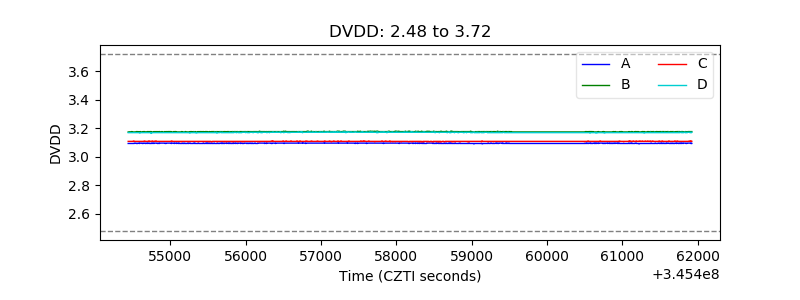 |
| Temperature 1 | 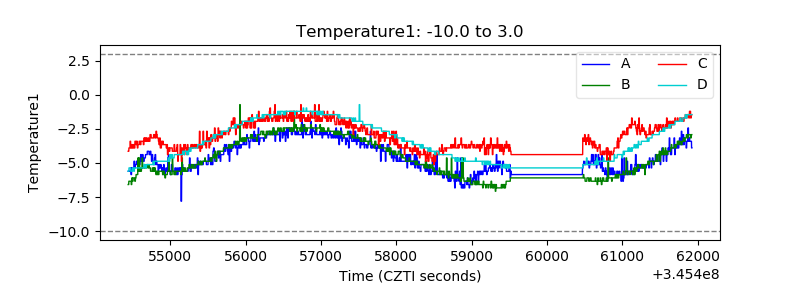 |
| Veto HV Monitor | 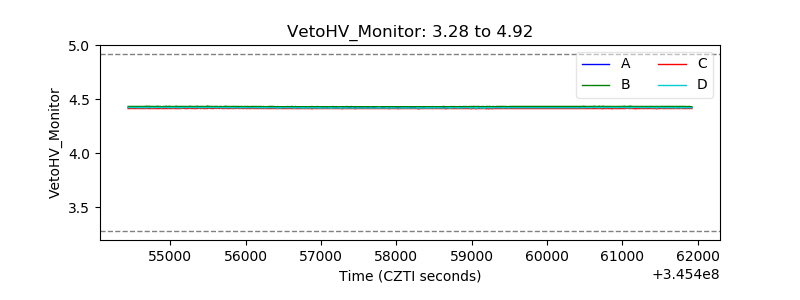 |
| Veto LLD | 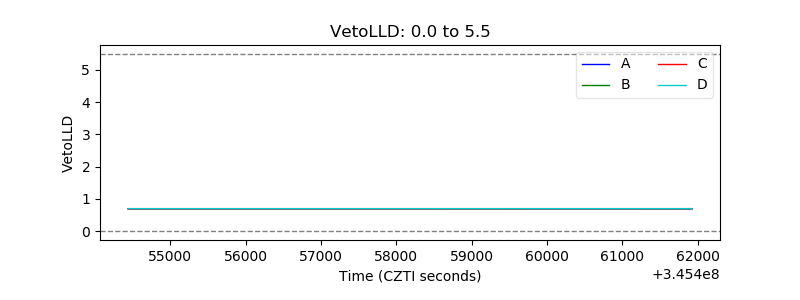 |
| Alpha Counter | 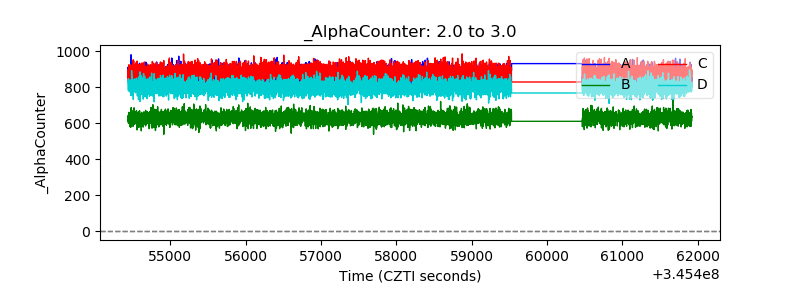 |
| _CPM_Rate | 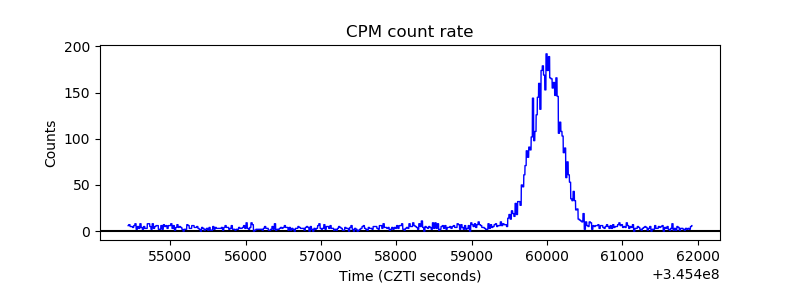 |
| CZT Counter | 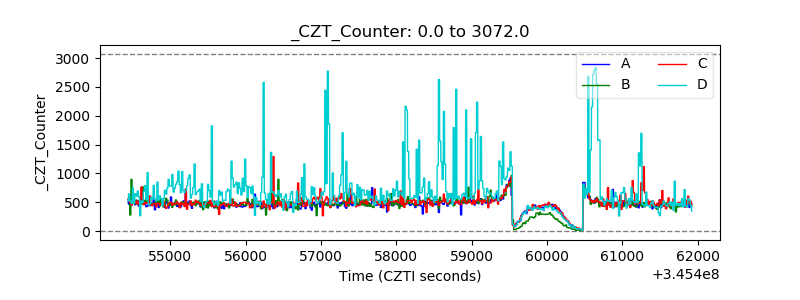 |
| +2.5 Volts monitor |  |
| +5 Volts monitor |  |
| _ROLL_ROT | 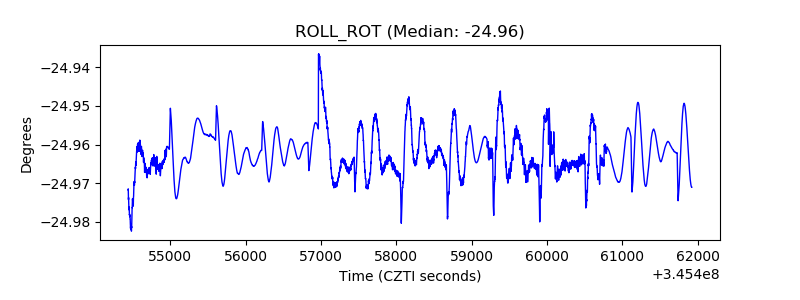 |
| _Roll_DEC | 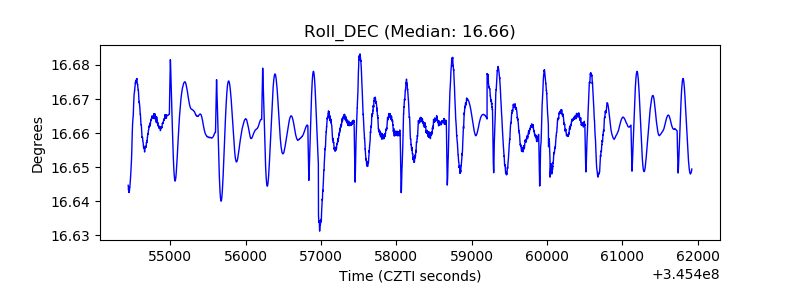 |
| _Roll_RA |  |
| Veto Counter | 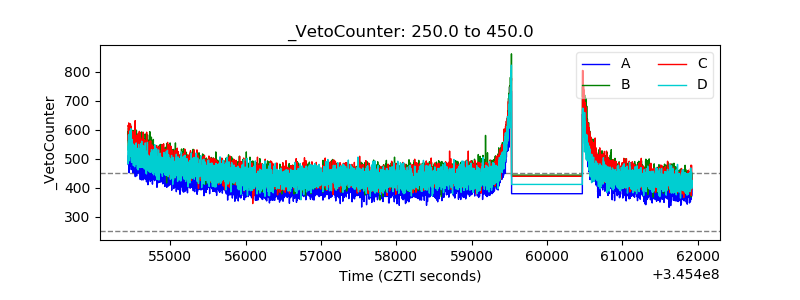 |