| Param | Original file | Final file |
|---|---|---|
| Filename | modeM0/AS1A10_045T04_9000004066_28157cztM0_level2.evt | modeM0/AS1A10_045T04_9000004066_28157cztM0_level2_quad_clean.evt |
| Size (bytes) | 542,306,880 | 86,077,440 |
| Size | 517.2 MB | 82.1 MB |
| Events in quadrant A | 3,226,595 | 547,539 |
| Events in quadrant B | 3,316,022 | 560,611 |
| Events in quadrant C | 3,519,089 | 531,541 |
| Events in quadrant D | 5,902,201 | 494,567 |
| Mode M0 | |||
|---|---|---|---|
| Quadrant | BADHDUFLAG | Total packets | Discarded packets |
| A | 0 | 13875 | 0 |
| B | 0 | 14034 | 0 |
| C | 0 | 14560 | 0 |
| D | 0 | 21975 | 0 |
| Mode M9 | |||
|---|---|---|---|
| Quadrant | BADHDUFLAG | Total packets | Discarded packets |
| A | 0 | 5 | 0 |
| B | 0 | 5 | 0 |
| C | 0 | 5 | 0 |
| D | 0 | 5 | 0 |
| Quadrant | Total seconds | Saturated seconds | Saturation percentage |
|---|---|---|---|
| A | 6780 | 113 | 1.666667% |
| B | 6780 | 125 | 1.843658% |
| C | 6780 | 174 | 2.566372% |
| D | 6779 | 882 | 13.010769% |
Noise dominated data is calculated using 1-second bins in cleaned event files. If a bin has >2000 counts, and if more than 50% of those come from <1% of pixels, then it is considered to be noise-dominated and hence unusable.
| Quadrant | # 1 sec bins | Bins with >0 counts | Bins with >2000 counts | High rate bins dominated by noise | Noise dominated (total time) | Noise dominated (detector-on time) | Marked lightcurve |
|---|---|---|---|---|---|---|---|
| A | 7275 | 6780 | 0 | 0 | 0.00% | 0.00% | 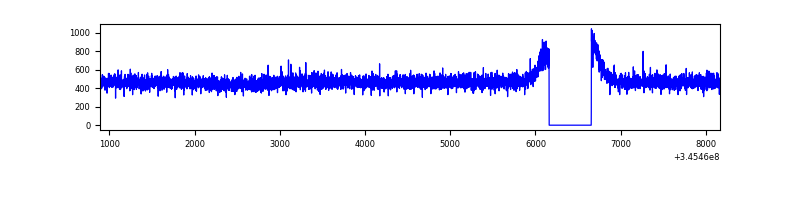 |
| B | 7275 | 6780 | 1 | 1 | 0.01% | 0.01% | 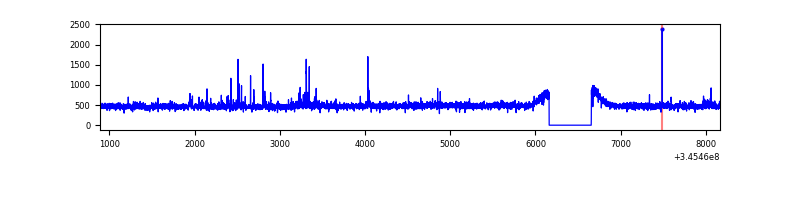 |
| C | 7275 | 6780 | 12 | 12 | 0.16% | 0.18% | 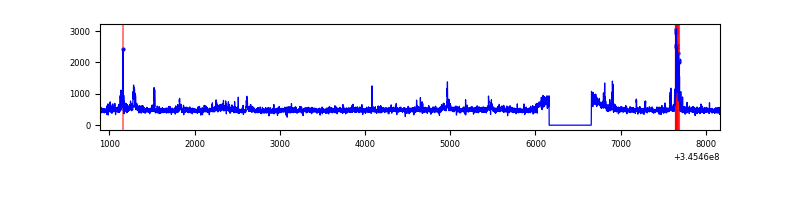 |
| D | 7273 | 6778 | 733 | 733 | 10.08% | 10.81% | 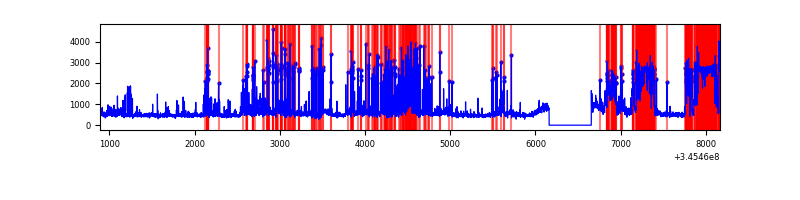 |
Top three noisy pixels from each quadrant. If the there are fewer than three noisy pixels in the level2.evt file, extra rows are filled as -1
| Pixel properties | Quadrant properties | ||||||
|---|---|---|---|---|---|---|---|
| Quadrant | DetID | PixID | Counts | Sigma | Mean | Median | Sigma |
| A | 13 | 254 | 10838 | 59.03 | 836 | 817 | 169.8 |
| A | 3 | 137 | 8068 | 42.71 | 836 | 817 | 169.8 |
| A | 0 | 226 | 7149 | 37.3 | 836 | 817 | 169.8 |
| B | 12 | 111 | 20341 | 121.3 | 827 | 805 | 161.1 |
| B | 10 | 245 | 19305 | 114.87 | 827 | 805 | 161.1 |
| B | 11 | 111 | 18355 | 108.97 | 827 | 805 | 161.1 |
| C | 3 | 233 | 166633 | 875.59 | 802 | 807 | 189.4 |
| C | 14 | 238 | 129131 | 677.57 | 802 | 807 | 189.4 |
| C | 2 | 16 | 96872 | 507.24 | 802 | 807 | 189.4 |
| D | 13 | 104 | 1484535 | 8056.66 | 765 | 745 | 184.2 |
| D | 1 | 52 | 521509 | 2827.64 | 765 | 745 | 184.2 |
| D | 8 | 195 | 365806 | 1982.2 | 765 | 745 | 184.2 |
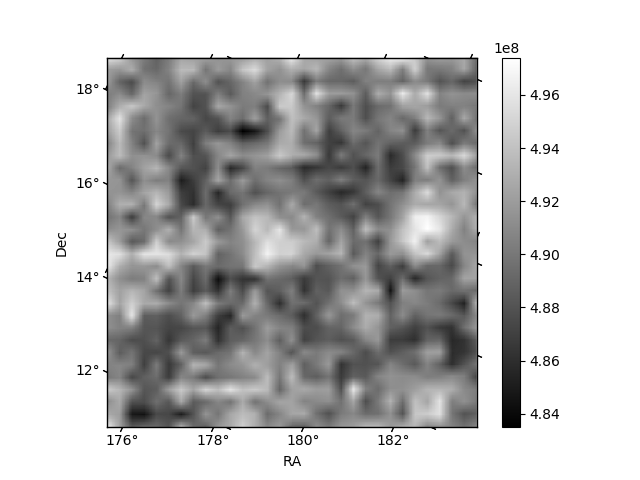
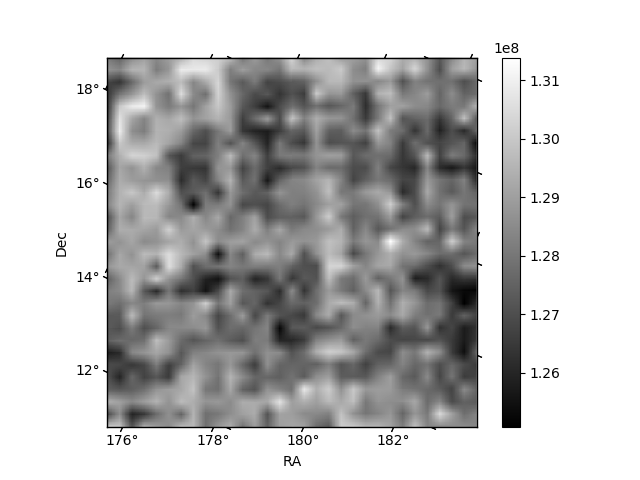
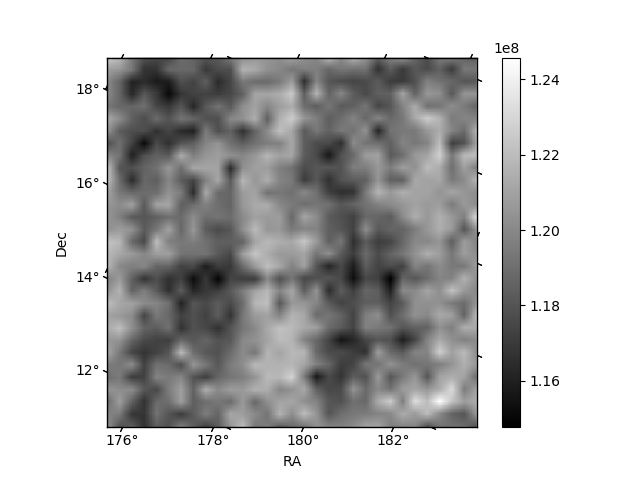
Histogram calculated using DETX and DETY for each event in the final _common_clean file
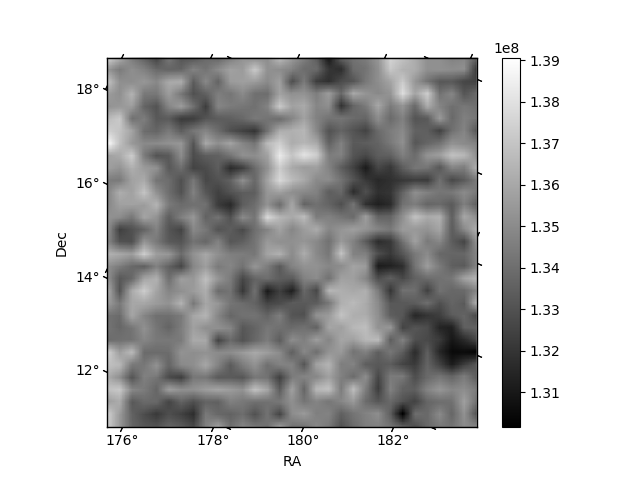
| Quadrant A | 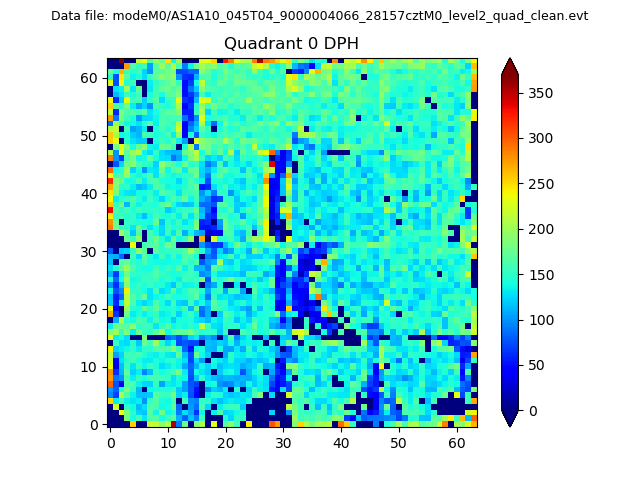 |
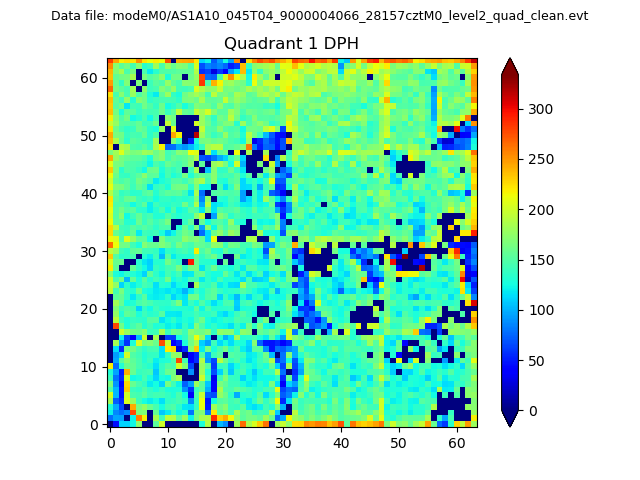 |
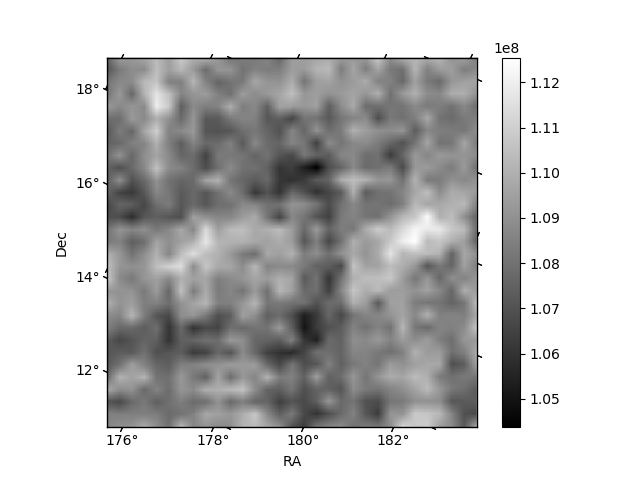
Quadrant B |
|---|---|---|---|
| Quadrant D | 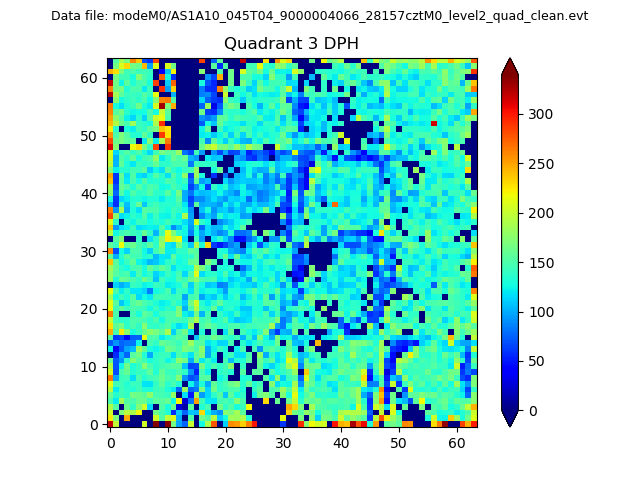 |
 |
Quadrant C |
| Plot type | Count rate plots | Images |
|---|---|---|
| Comparison with Poisson distribution Blue bars denote a histogram of data divided into 1 sec bins. Red curve is a Poisson curve with rate = median count rate of data. |
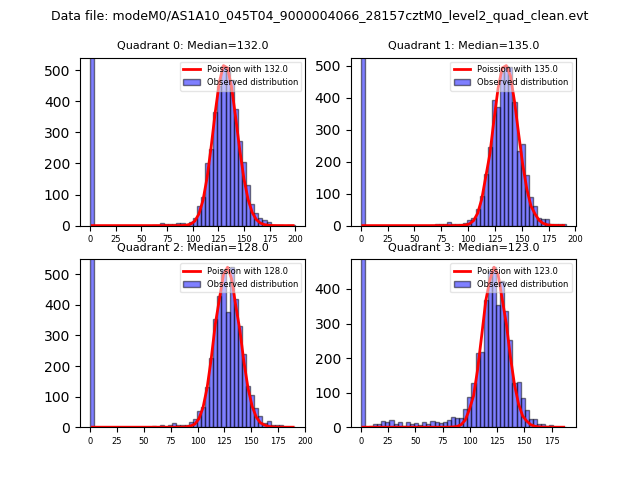 |
 |
| Quadrant-wise count rates Data is divided into 100 sec bins |
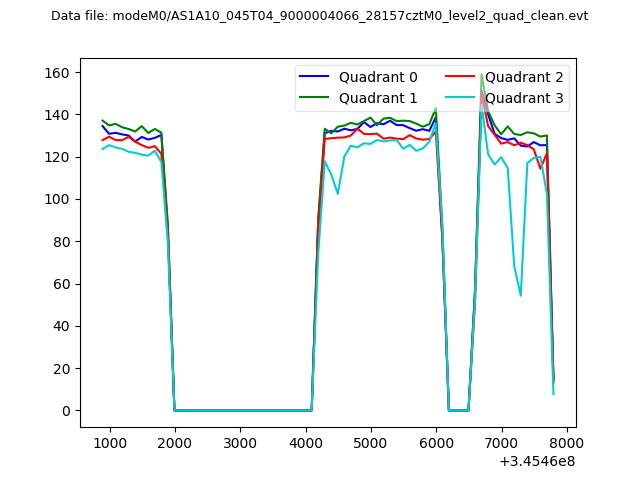 |
|
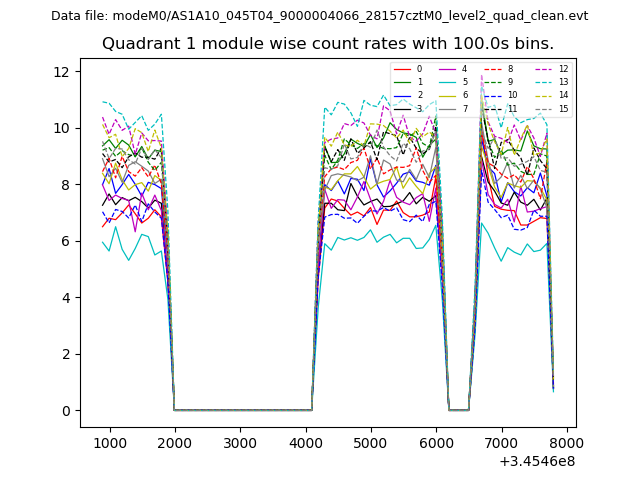
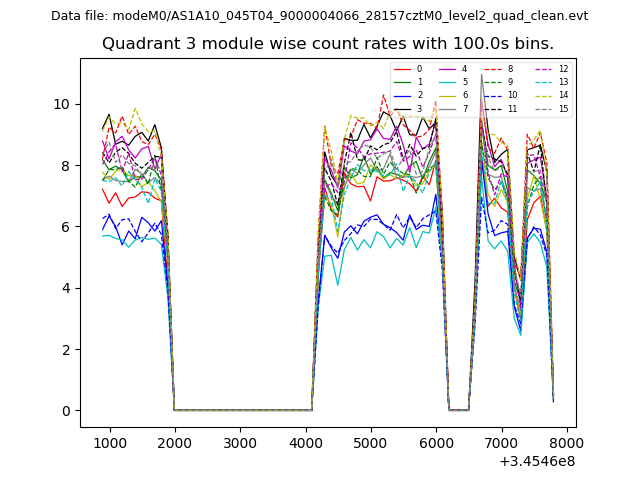
| Module-wise count rates for Quadrant A Data is divided into 100 sec bins |
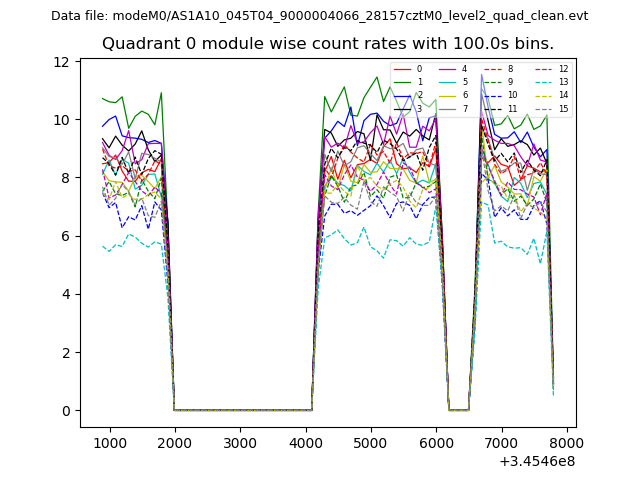 |
 |
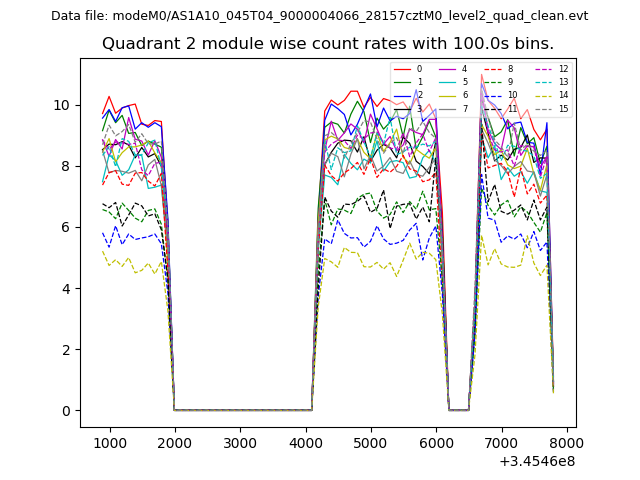
| Module-wise count rates for Quadrant B Data is divided into 100 sec bins |
 |
 |
| Module-wise count rates for Quadrant C Data is divided into 100 sec bins |
 |
 |
| Module-wise count rates for Quadrant D Data is divided into 100 sec bins |
 |
 |
| Parameter | Plot |
|---|---|
| CZT HV Monitor | 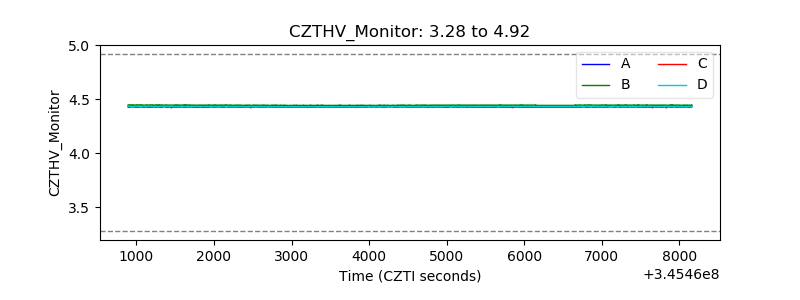 |
| D_VDD | 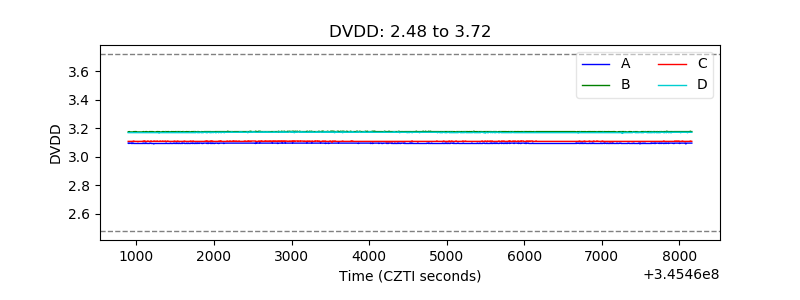 |
| Temperature 1 | 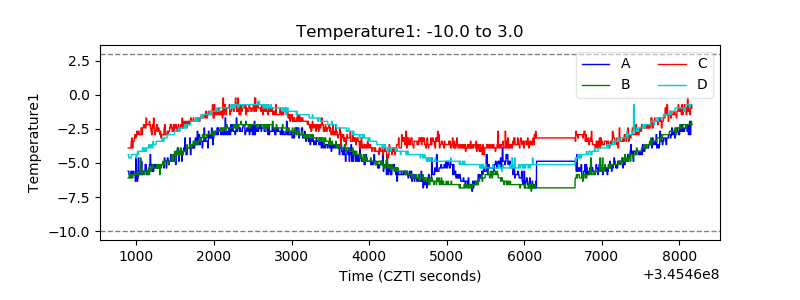 |
| Veto HV Monitor | 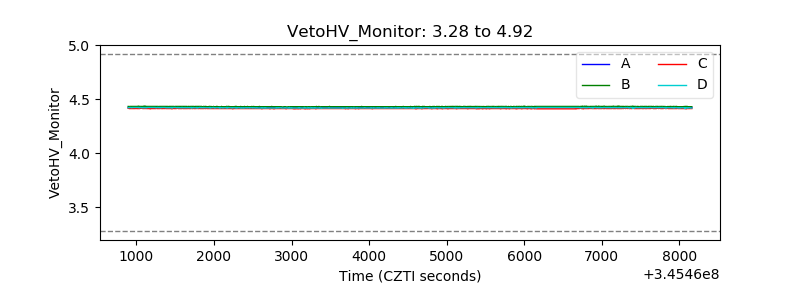 |
| Veto LLD | 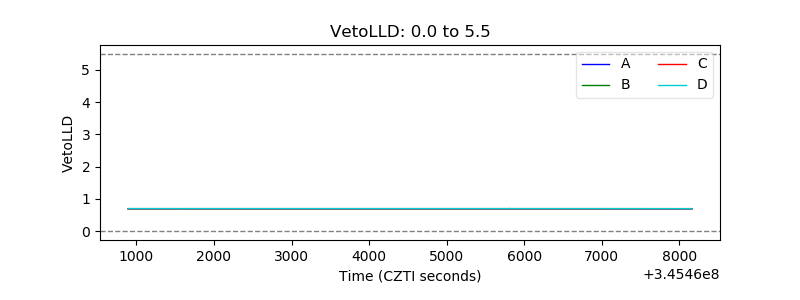 |
| Alpha Counter | 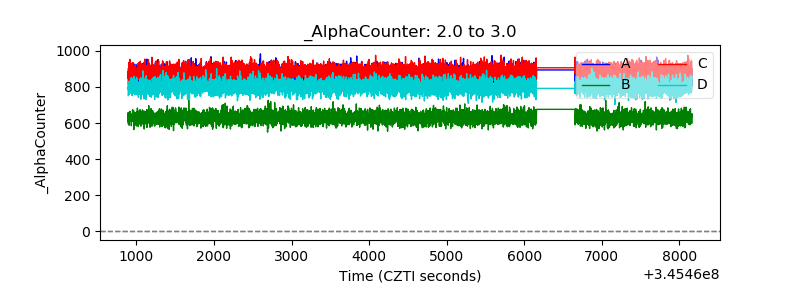 |
| _CPM_Rate | 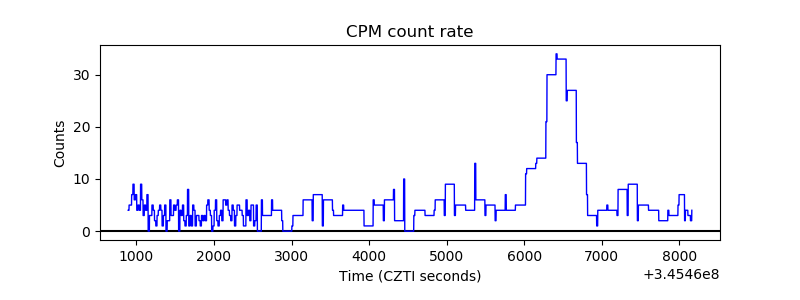 |
| CZT Counter | 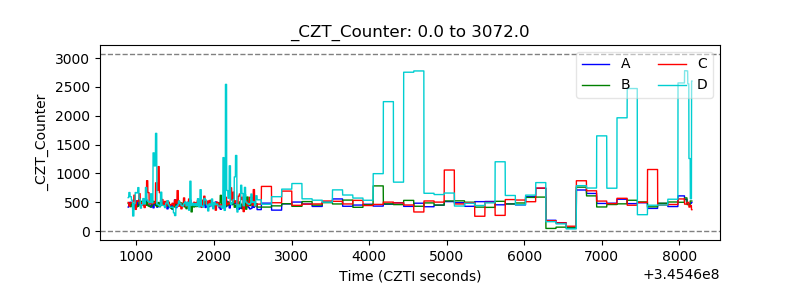 |
| +2.5 Volts monitor |  |
| +5 Volts monitor | 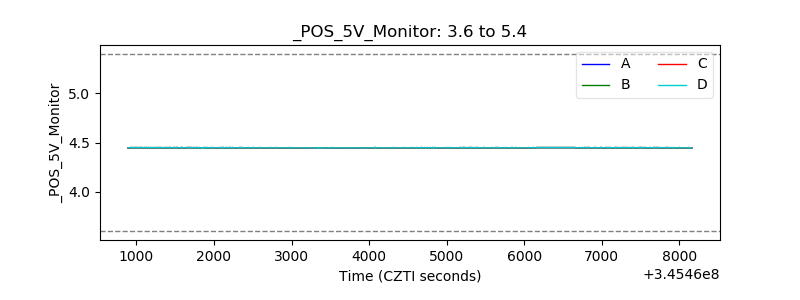 |
| _ROLL_ROT | 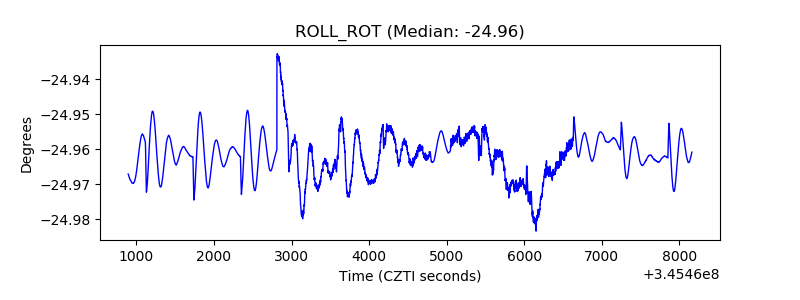 |
| _Roll_DEC | 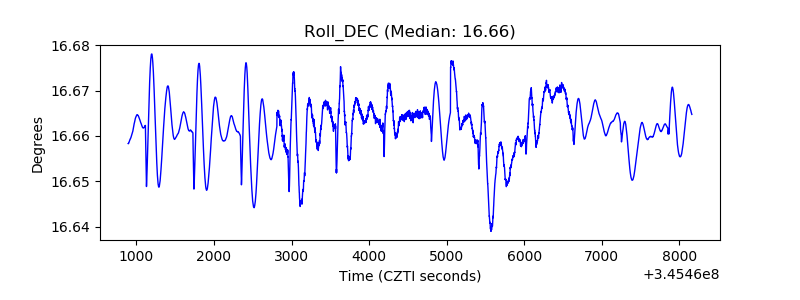 |
| _Roll_RA | 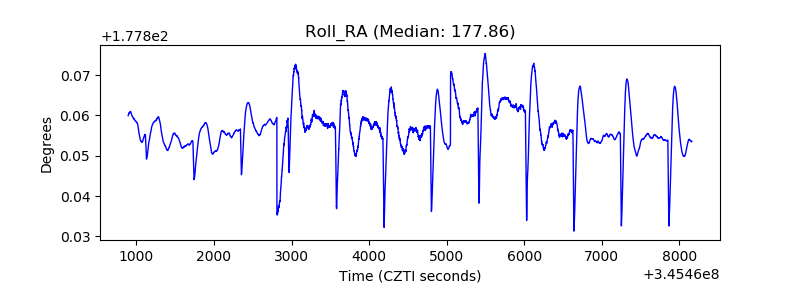 |
| Veto Counter | 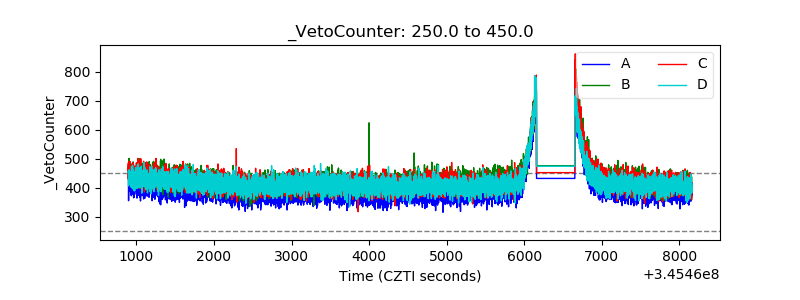 |