| Param | Original file | Final file |
|---|---|---|
| Filename | modeM0/AS1A10_045T04_9000004066_28158cztM0_level2.evt | modeM0/AS1A10_045T04_9000004066_28158cztM0_level2_quad_clean.evt |
| Size (bytes) | 724,403,520 | 75,072,960 |
| Size | 690.8 MB | 71.6 MB |
| Events in quadrant A | 3,353,218 | 502,281 |
| Events in quadrant B | 3,572,189 | 513,090 |
| Events in quadrant C | 3,844,196 | 485,908 |
| Events in quadrant D | 10,695,112 | 283,363 |
| Mode M0 | |||
|---|---|---|---|
| Quadrant | BADHDUFLAG | Total packets | Discarded packets |
| A | 0 | 14461 | 0 |
| B | 0 | 14961 | 0 |
| C | 0 | 15783 | 0 |
| D | 0 | 36350 | 0 |
| Mode M9 | |||
|---|---|---|---|
| Quadrant | BADHDUFLAG | Total packets | Discarded packets |
| A | 0 | 2 | 0 |
| B | 0 | 2 | 0 |
| C | 0 | 2 | 0 |
| D | 0 | 2 | 0 |
| Quadrant | Total seconds | Saturated seconds | Saturation percentage |
|---|---|---|---|
| A | 6991 | 172 | 2.460306% |
| B | 6991 | 203 | 2.903733% |
| C | 6991 | 320 | 4.577314% |
| D | 6991 | 3075 | 43.985124% |
Noise dominated data is calculated using 1-second bins in cleaned event files. If a bin has >2000 counts, and if more than 50% of those come from <1% of pixels, then it is considered to be noise-dominated and hence unusable.
| Quadrant | # 1 sec bins | Bins with >0 counts | Bins with >2000 counts | High rate bins dominated by noise | Noise dominated (total time) | Noise dominated (detector-on time) | Marked lightcurve |
|---|---|---|---|---|---|---|---|
| A | 7171 | 6991 | 0 | 0 | 0.00% | 0.00% | 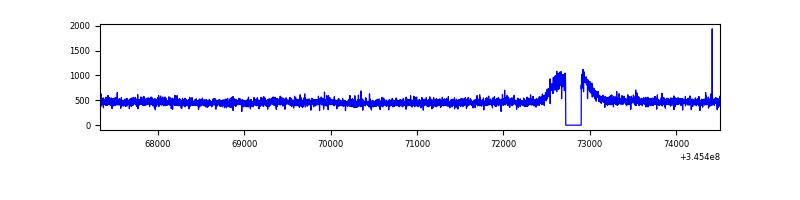 |
| B | 7171 | 6991 | 9 | 9 | 0.13% | 0.13% | 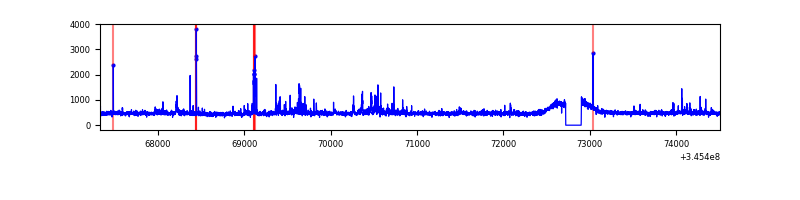 |
| C | 7171 | 6991 | 71 | 71 | 0.99% | 1.02% | 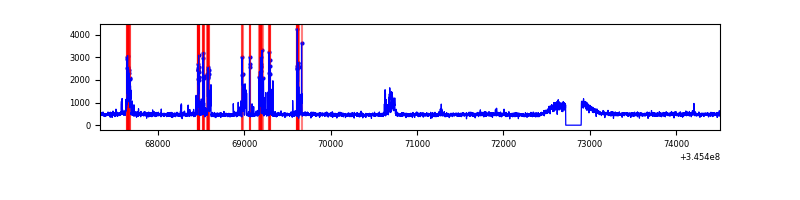 |
| D | 7171 | 6991 | 2726 | 2726 | 38.01% | 38.99% | 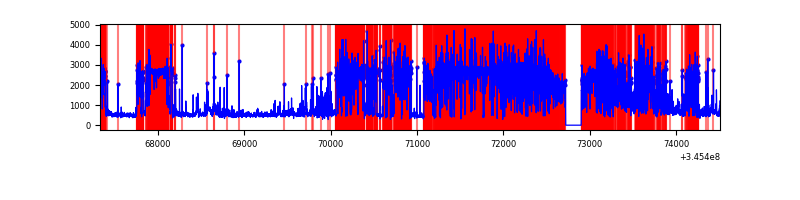 |
Top three noisy pixels from each quadrant. If the there are fewer than three noisy pixels in the level2.evt file, extra rows are filled as -1
| Pixel properties | Quadrant properties | ||||||
|---|---|---|---|---|---|---|---|
| Quadrant | DetID | PixID | Counts | Sigma | Mean | Median | Sigma |
| A | 13 | 254 | 10873 | 56.8 | 868 | 849 | 176.5 |
| A | 3 | 137 | 8881 | 45.51 | 868 | 849 | 176.5 |
| A | 0 | 226 | 7482 | 37.59 | 868 | 849 | 176.5 |
| B | 10 | 246 | 72759 | 427.59 | 857 | 835 | 168.2 |
| B | 10 | 245 | 68833 | 404.25 | 857 | 835 | 168.2 |
| B | 12 | 18 | 25576 | 147.09 | 857 | 835 | 168.2 |
| C | 3 | 233 | 468624 | 2351.82 | 830 | 835 | 198.9 |
| C | 14 | 238 | 132029 | 659.58 | 830 | 835 | 198.9 |
| C | 13 | 61 | 5763 | 24.78 | 830 | 835 | 198.9 |
| D | 1 | 52 | 6589709 | 42510.87 | 641 | 622 | 155.0 |
| D | 13 | 104 | 913510 | 5889.69 | 641 | 622 | 155.0 |
| D | 7 | 223 | 333821 | 2149.7 | 641 | 622 | 155.0 |
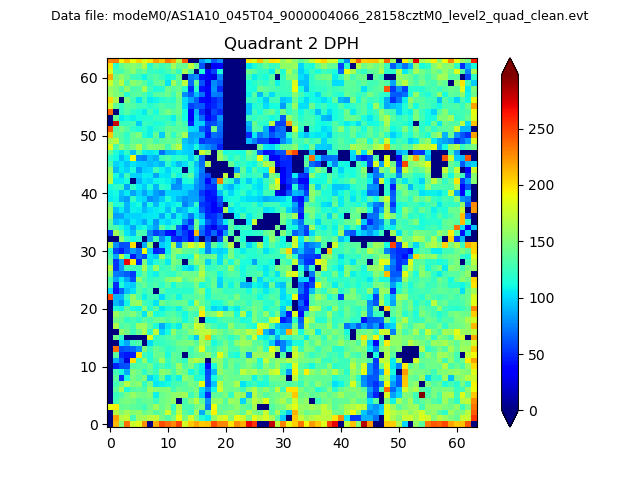
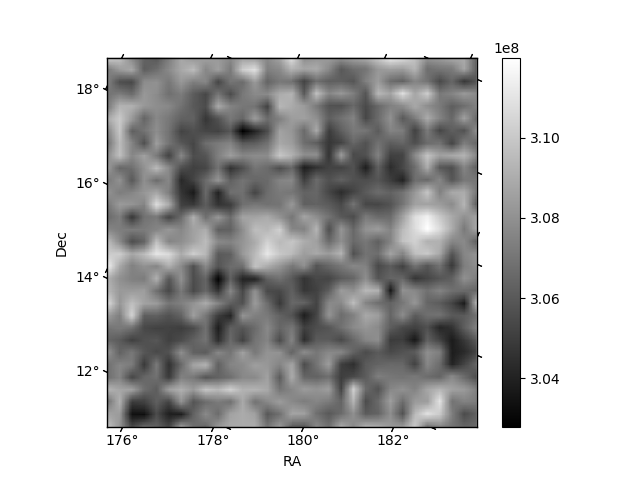
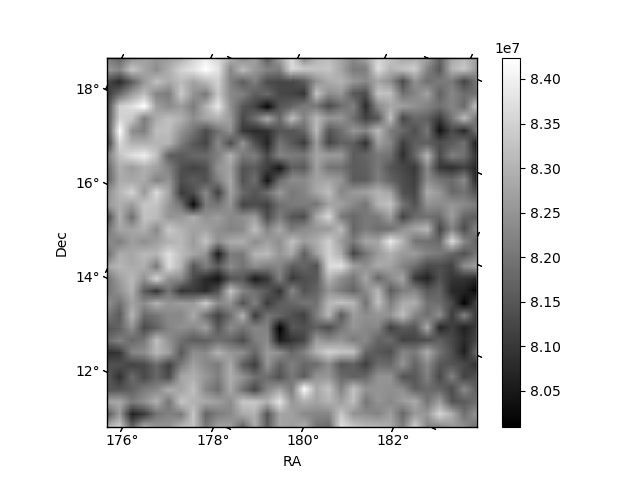
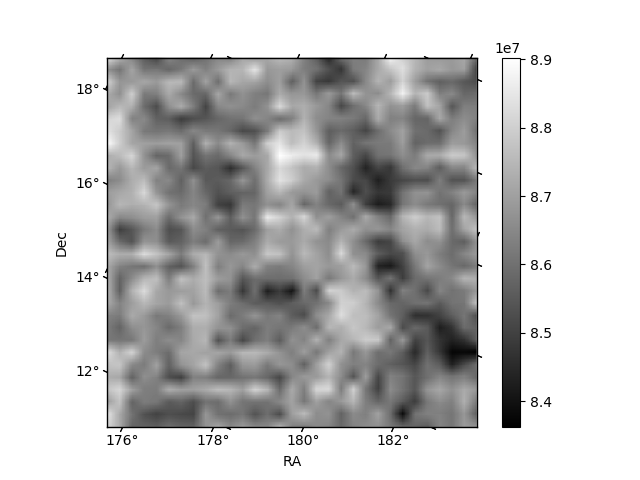
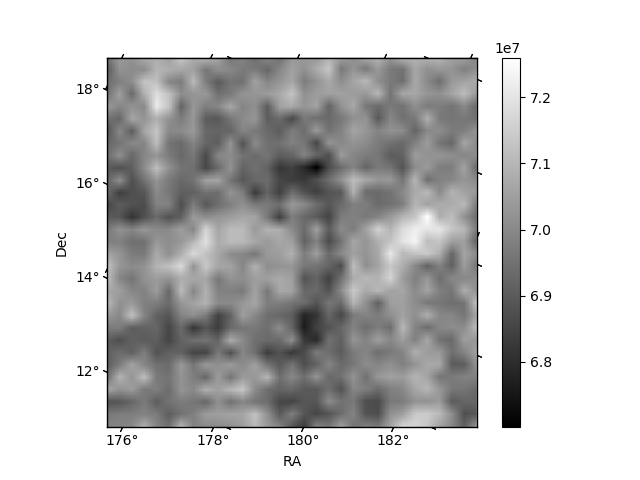
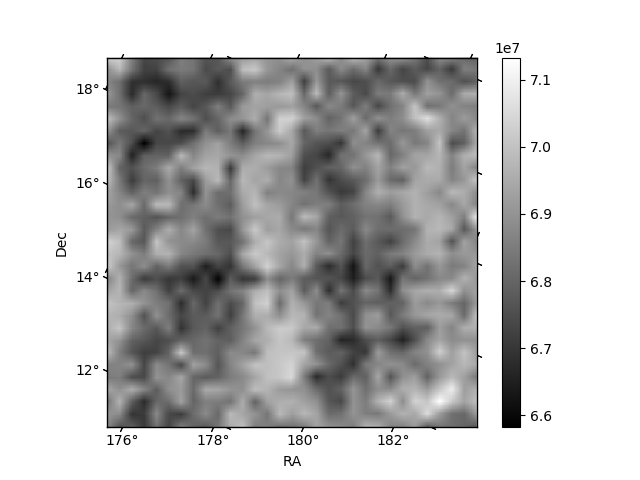
Histogram calculated using DETX and DETY for each event in the final _common_clean file
| Quadrant A | 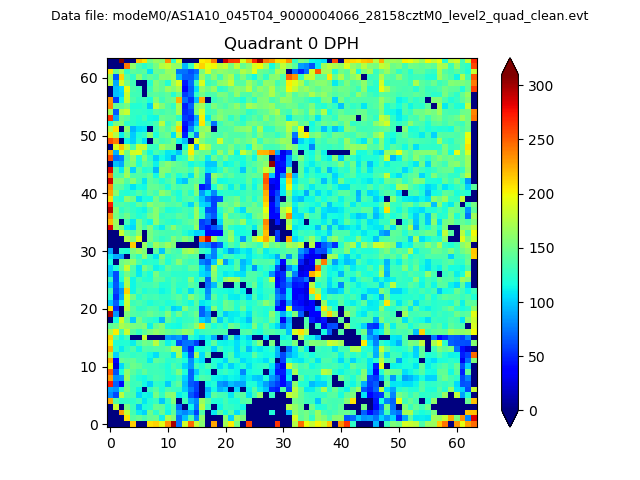 |
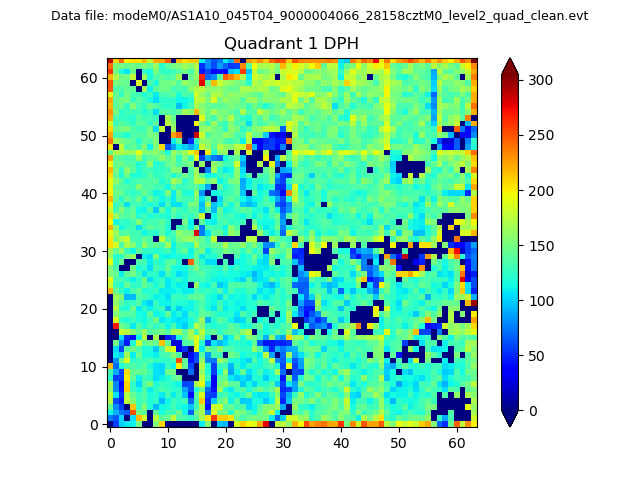 |
Quadrant B |
|---|---|---|---|
| Quadrant D | 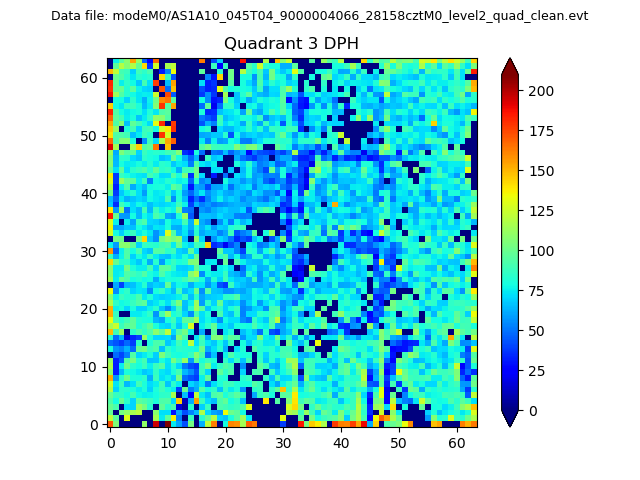 |
 |
Quadrant C |
| Plot type | Count rate plots | Images |
|---|---|---|
| Comparison with Poisson distribution Blue bars denote a histogram of data divided into 1 sec bins. Red curve is a Poisson curve with rate = median count rate of data. |
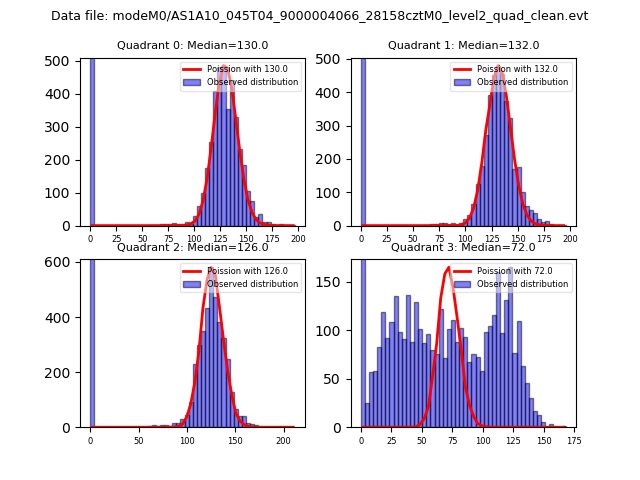 |
 |
| Quadrant-wise count rates Data is divided into 100 sec bins |
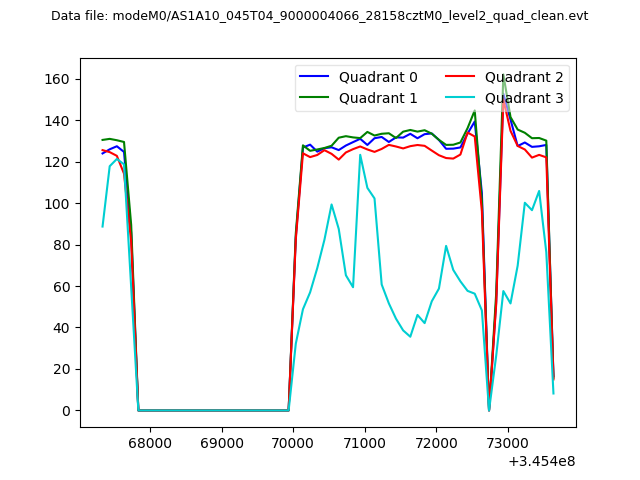 |
|
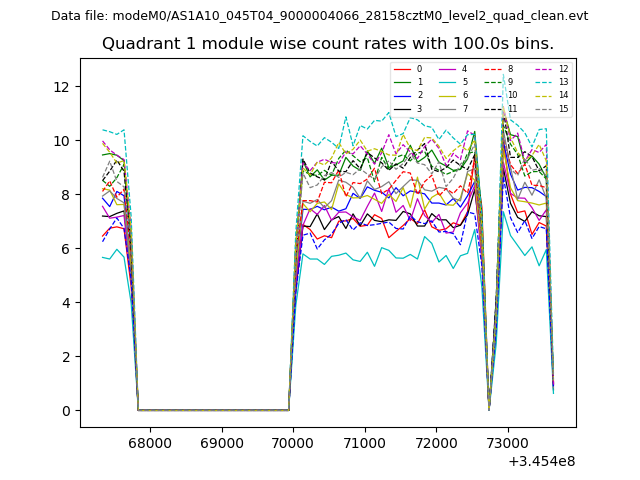
| Module-wise count rates for Quadrant A Data is divided into 100 sec bins |
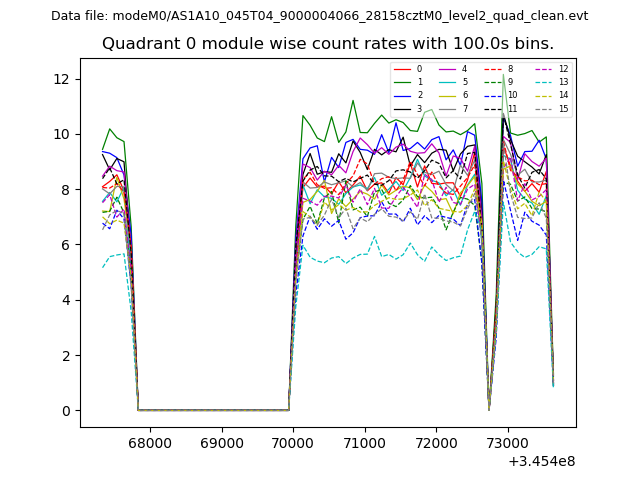 |
 |
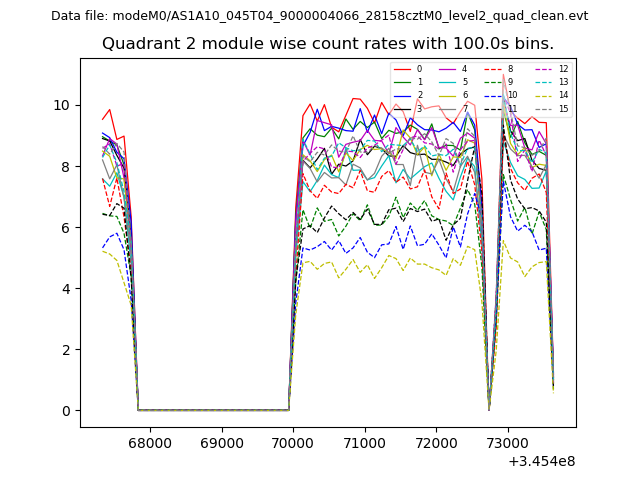
| Module-wise count rates for Quadrant B Data is divided into 100 sec bins |
 |
 |
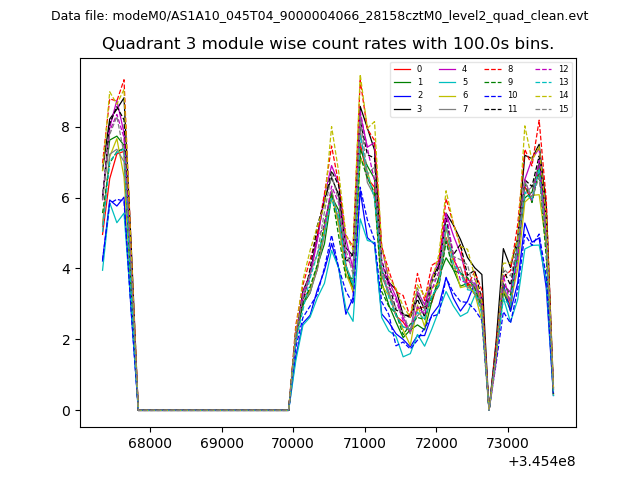
| Module-wise count rates for Quadrant C Data is divided into 100 sec bins |
 |
 |
| Module-wise count rates for Quadrant D Data is divided into 100 sec bins |
 |
 |
| Parameter | Plot |
|---|---|
| CZT HV Monitor | 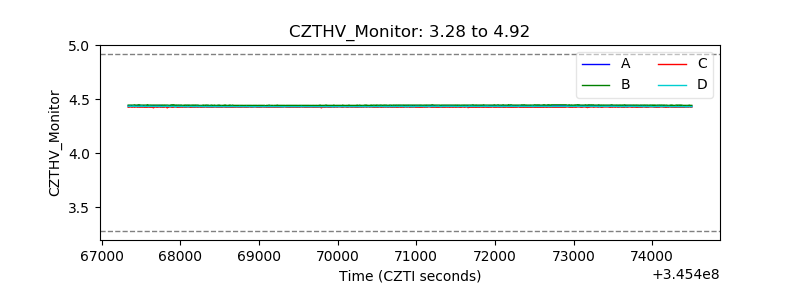 |
| D_VDD | 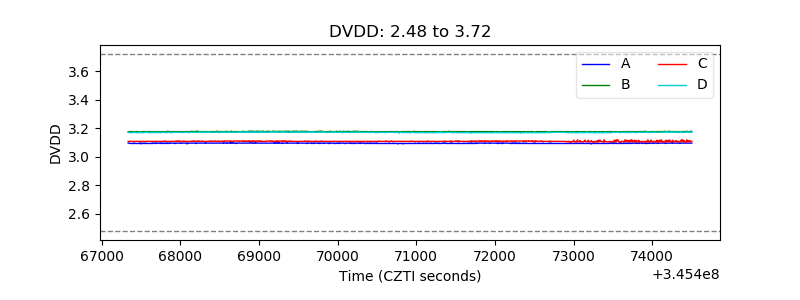 |
| Temperature 1 | 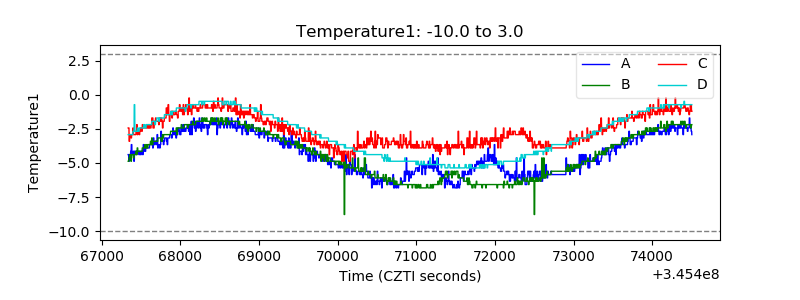 |
| Veto HV Monitor | 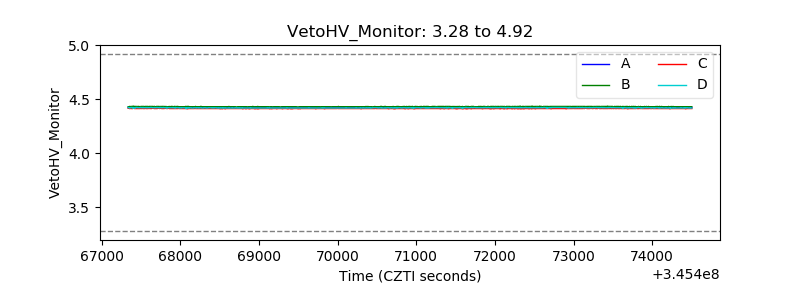 |
| Veto LLD | 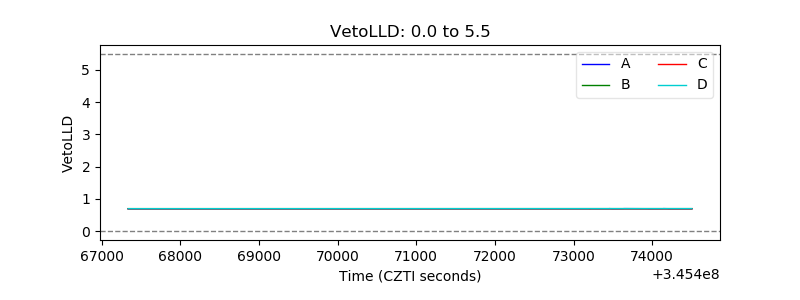 |
| Alpha Counter | 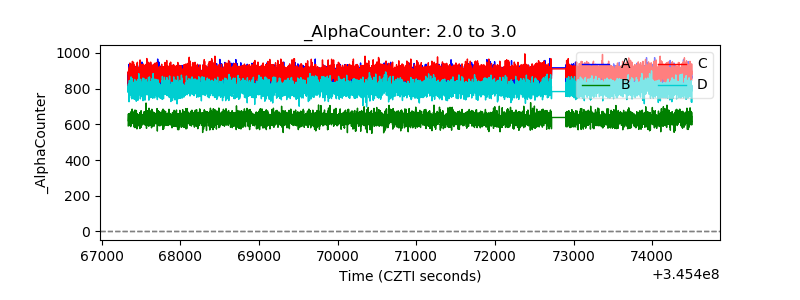 |
| _CPM_Rate | 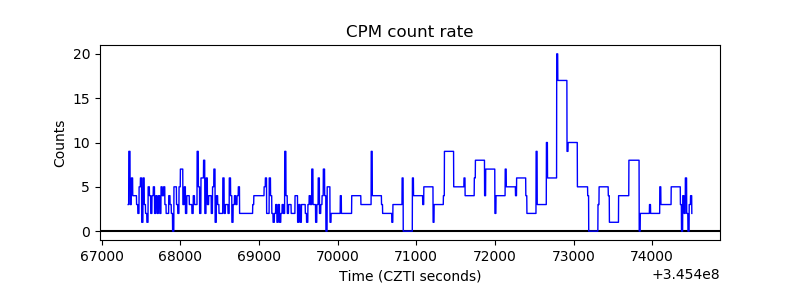 |
| CZT Counter | 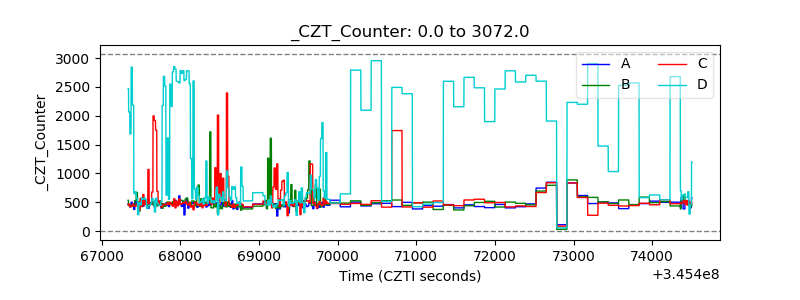 |
| +2.5 Volts monitor | 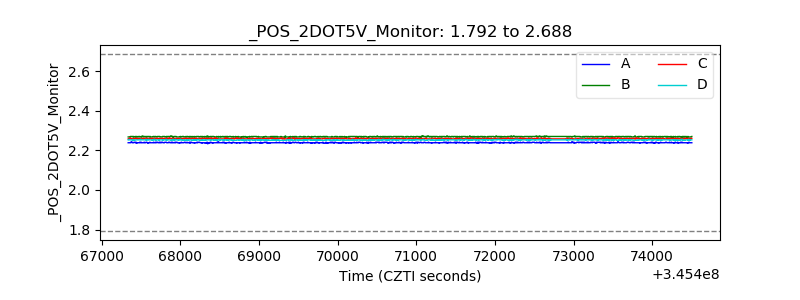 |
| +5 Volts monitor |  |
| _ROLL_ROT | 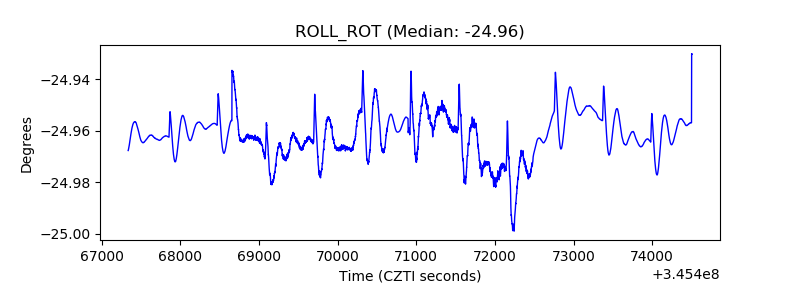 |
| _Roll_DEC | 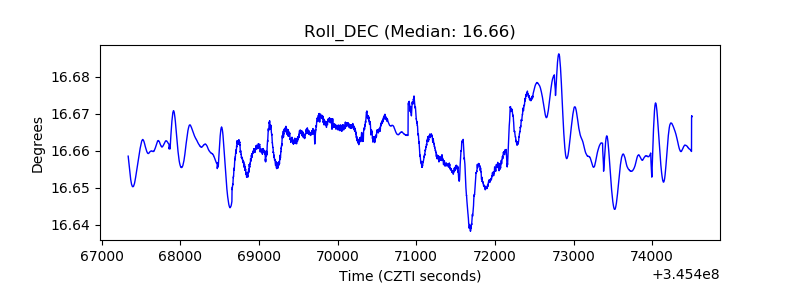 |
| _Roll_RA | 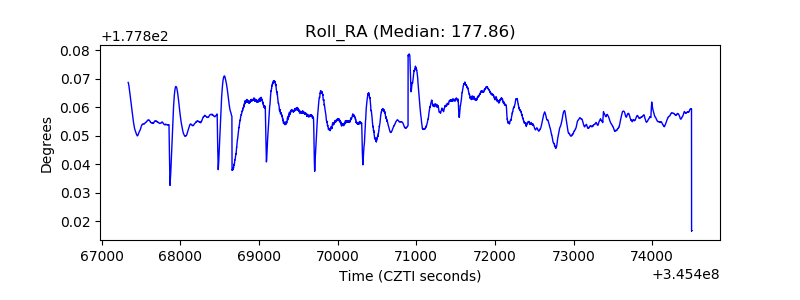 |
| Veto Counter | 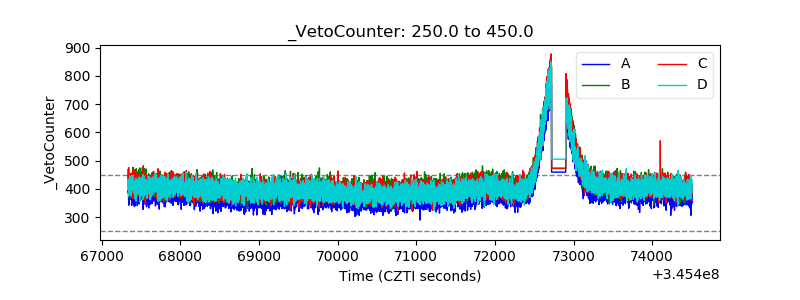 |