| Param | Original file | Final file |
|---|---|---|
| Filename | modeM0/AS1A10_045T04_9000004066_28162cztM0_level2.evt | modeM0/AS1A10_045T04_9000004066_28162cztM0_level2_quad_clean.evt |
| Size (bytes) | 1,314,380,160 | 158,941,440 |
| Size | 1.2 GB | 151.6 MB |
| Events in quadrant A | 6,543,097 | 1,006,060 |
| Events in quadrant B | 7,738,994 | 1,003,608 |
| Events in quadrant C | 7,107,130 | 975,015 |
| Events in quadrant D | 17,478,450 | 867,442 |
| Mode M0 | |||
|---|---|---|---|
| Quadrant | BADHDUFLAG | Total packets | Discarded packets |
| A | 0 | 28494 | 0 |
| B | 0 | 31882 | 0 |
| C | 0 | 29751 | 0 |
| D | 0 | 61636 | 0 |
| Mode M9 | |||
|---|---|---|---|
| Quadrant | BADHDUFLAG | Total packets | Discarded packets |
| A | 0 | 12 | 0 |
| B | 0 | 13 | 0 |
| C | 0 | 13 | 0 |
| D | 0 | 13 | 0 |
| Quadrant | Total seconds | Saturated seconds | Saturation percentage |
|---|---|---|---|
| A | 13911 | 99 | 0.711667% |
| B | 13911 | 375 | 2.695708% |
| C | 13911 | 249 | 1.789950% |
| D | 13911 | 3784 | 27.201495% |
Noise dominated data is calculated using 1-second bins in cleaned event files. If a bin has >2000 counts, and if more than 50% of those come from <1% of pixels, then it is considered to be noise-dominated and hence unusable.
| Quadrant | # 1 sec bins | Bins with >0 counts | Bins with >2000 counts | High rate bins dominated by noise | Noise dominated (total time) | Noise dominated (detector-on time) | Marked lightcurve |
|---|---|---|---|---|---|---|---|
| A | 15046 | 13912 | 0 | 0 | 0.00% | 0.00% | 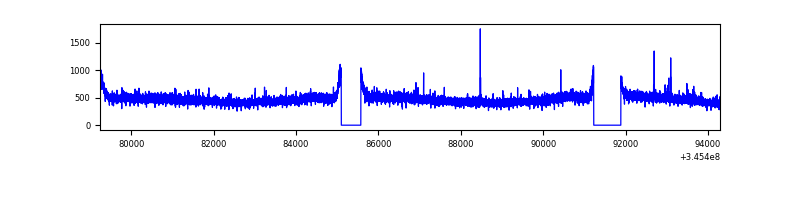 |
| B | 15046 | 13911 | 165 | 165 | 1.10% | 1.19% | 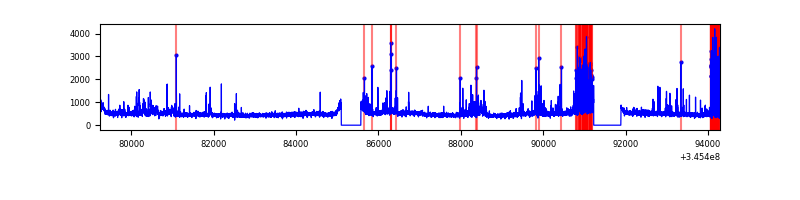 |
| C | 15046 | 13912 | 13 | 13 | 0.09% | 0.09% | 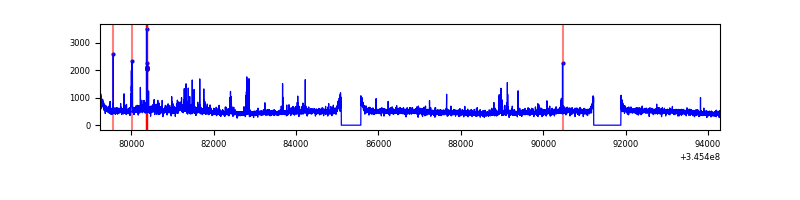 |
| D | 15046 | 13912 | 3304 | 3304 | 21.96% | 23.75% | 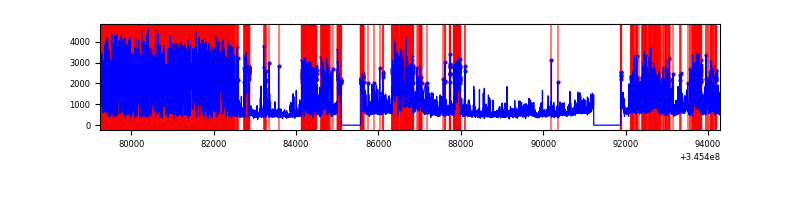 |
Top three noisy pixels from each quadrant. If the there are fewer than three noisy pixels in the level2.evt file, extra rows are filled as -1
| Pixel properties | Quadrant properties | ||||||
|---|---|---|---|---|---|---|---|
| Quadrant | DetID | PixID | Counts | Sigma | Mean | Median | Sigma |
| A | 13 | 254 | 22898 | 62.73 | 1689 | 1652 | 338.7 |
| A | 12 | 16 | 17432 | 46.59 | 1689 | 1652 | 338.7 |
| A | 3 | 137 | 16916 | 45.07 | 1689 | 1652 | 338.7 |
| B | 10 | 245 | 961691 | 2984.79 | 1660 | 1614 | 321.7 |
| B | 15 | 32 | 157826 | 485.65 | 1660 | 1614 | 321.7 |
| B | 10 | 246 | 50231 | 151.14 | 1660 | 1614 | 321.7 |
| C | 3 | 233 | 513738 | 1345.44 | 1617 | 1628 | 380.6 |
| C | 14 | 238 | 258367 | 674.52 | 1617 | 1628 | 380.6 |
| C | 2 | 16 | 32624 | 81.43 | 1617 | 1628 | 380.6 |
| D | 1 | 52 | 8736793 | 25530.48 | 1432 | 1395 | 342.2 |
| D | 7 | 223 | 1597234 | 4664.07 | 1432 | 1395 | 342.2 |
| D | 2 | 250 | 860500 | 2510.86 | 1432 | 1395 | 342.2 |
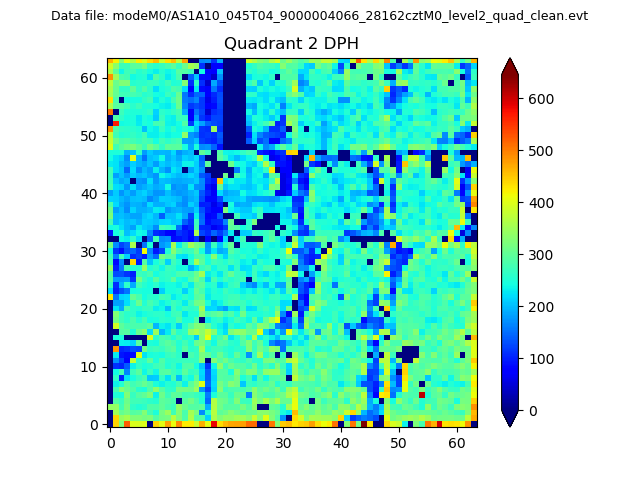
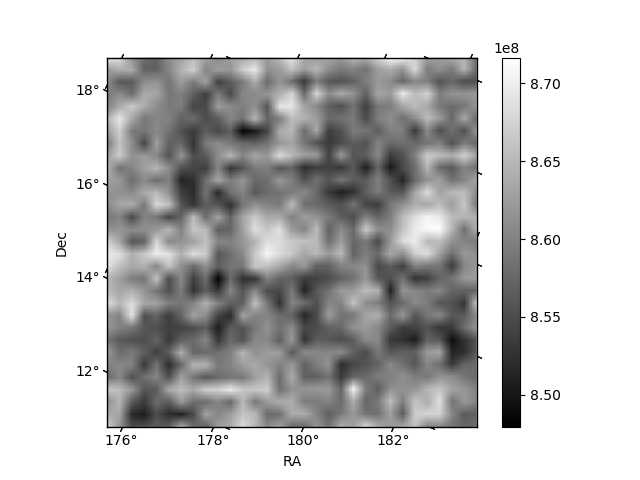
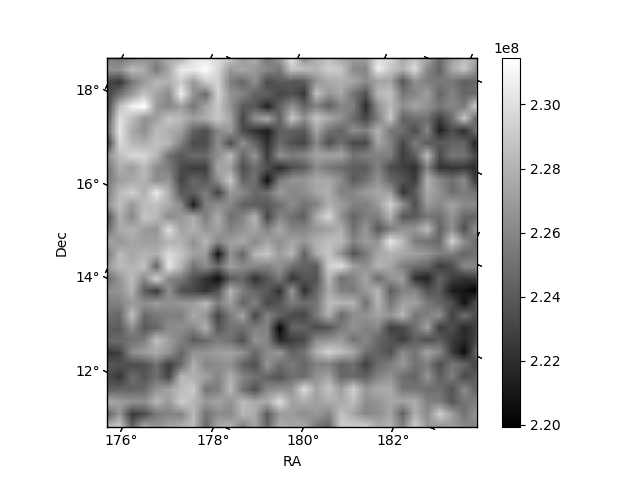
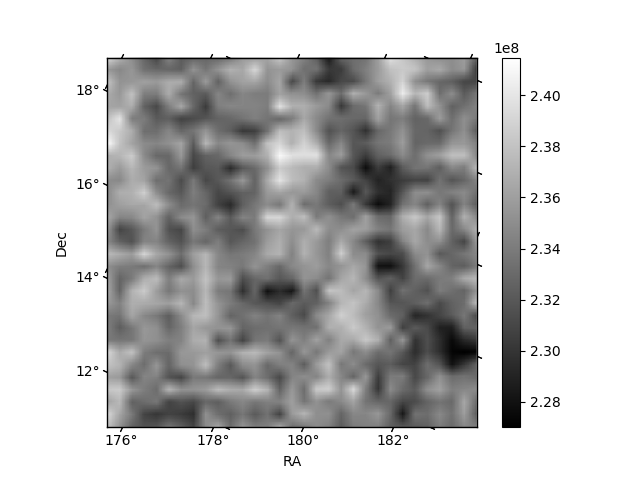
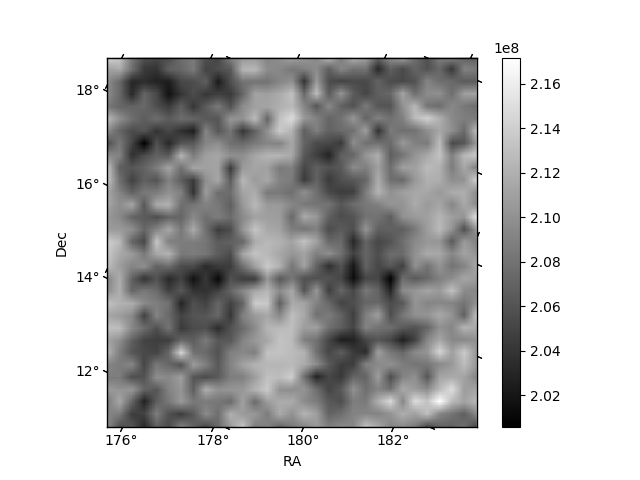
Histogram calculated using DETX and DETY for each event in the final _common_clean file
| Quadrant A | 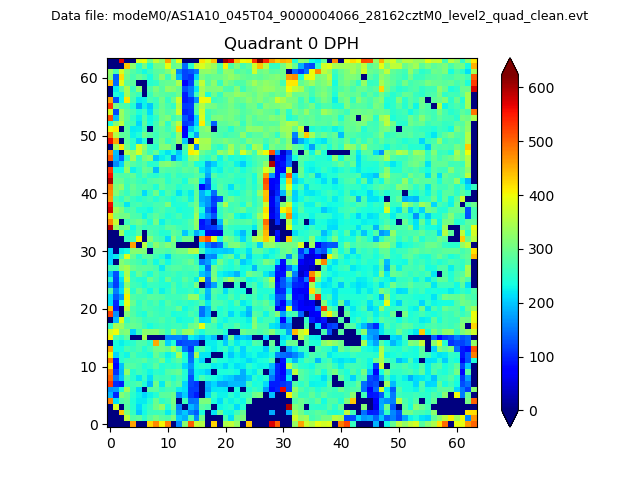 |
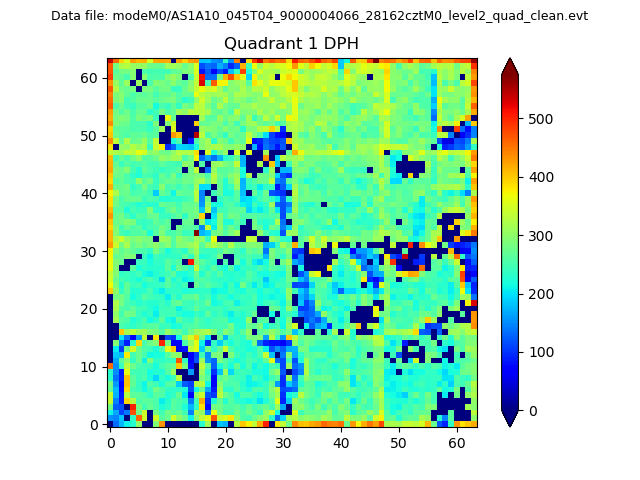 |
Quadrant B |
|---|---|---|---|
| Quadrant D | 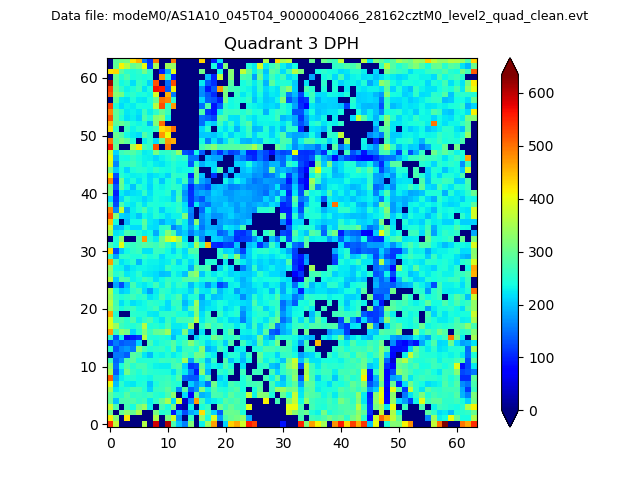 |
 |
Quadrant C |
| Plot type | Count rate plots | Images |
|---|---|---|
| Comparison with Poisson distribution Blue bars denote a histogram of data divided into 1 sec bins. Red curve is a Poisson curve with rate = median count rate of data. |
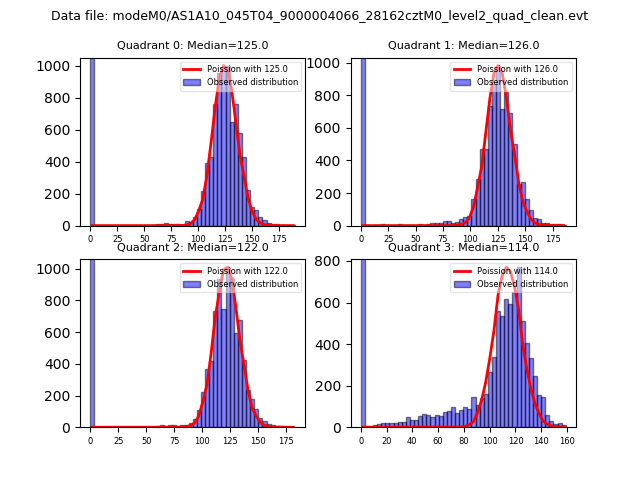 |
 |
| Quadrant-wise count rates Data is divided into 100 sec bins |
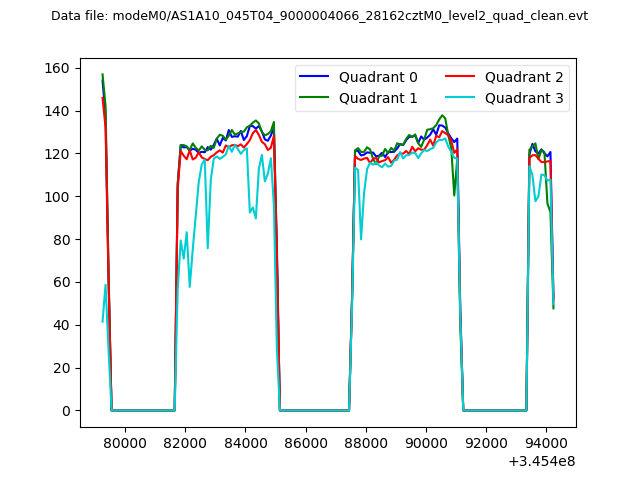 |
|
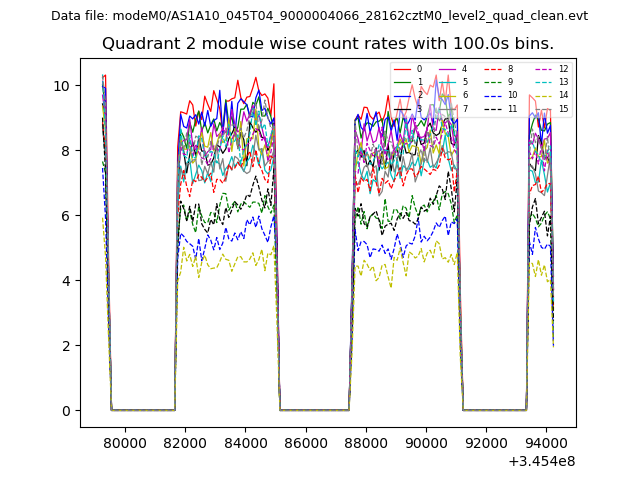
| Module-wise count rates for Quadrant A Data is divided into 100 sec bins |
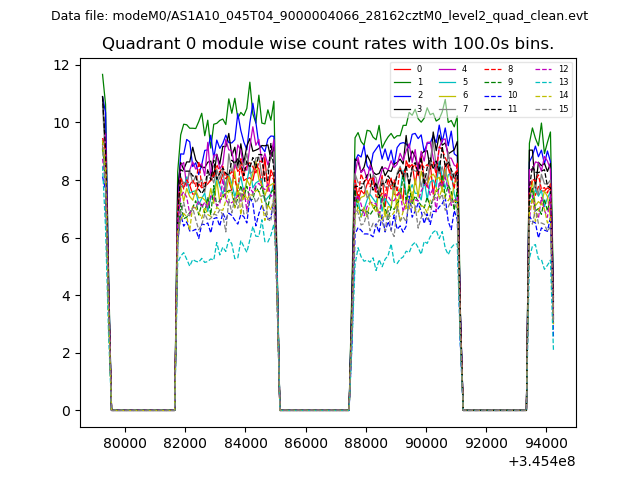 |
 |
| Module-wise count rates for Quadrant B Data is divided into 100 sec bins |
 |
 |
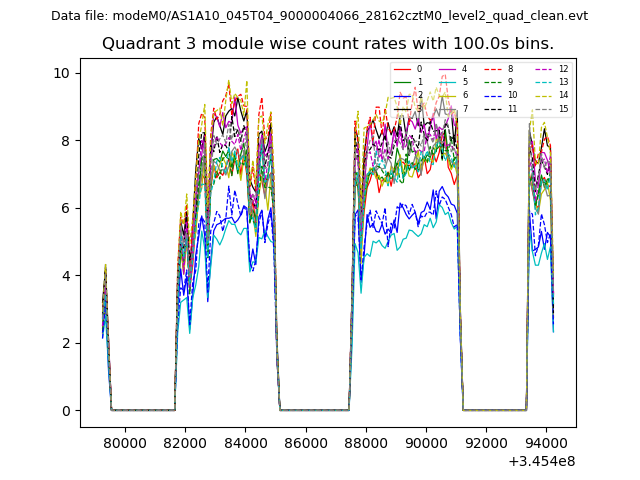
| Module-wise count rates for Quadrant C Data is divided into 100 sec bins |
 |
 |
| Module-wise count rates for Quadrant D Data is divided into 100 sec bins |
 |
 |
| Parameter | Plot |
|---|---|
| CZT HV Monitor | 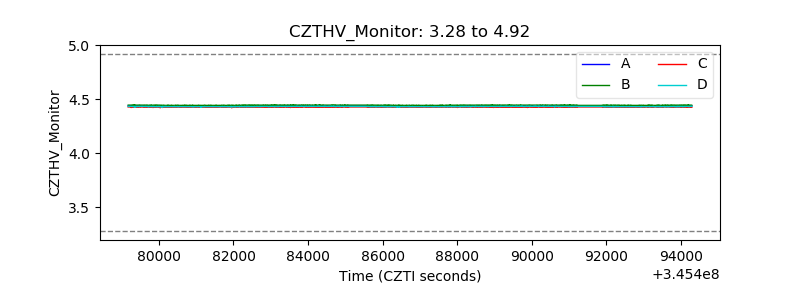 |
| D_VDD | 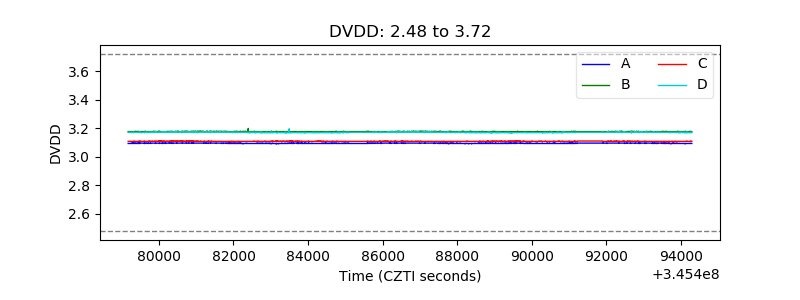 |
| Temperature 1 |  |
| Veto HV Monitor |  |
| Veto LLD | 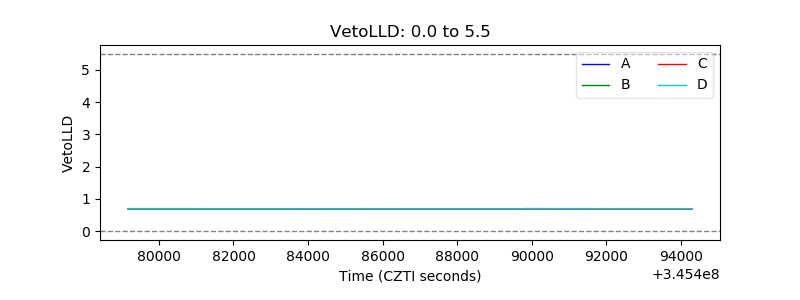 |
| Alpha Counter | 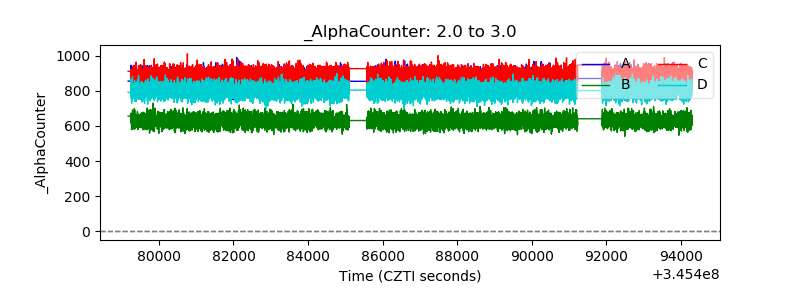 |
| _CPM_Rate | 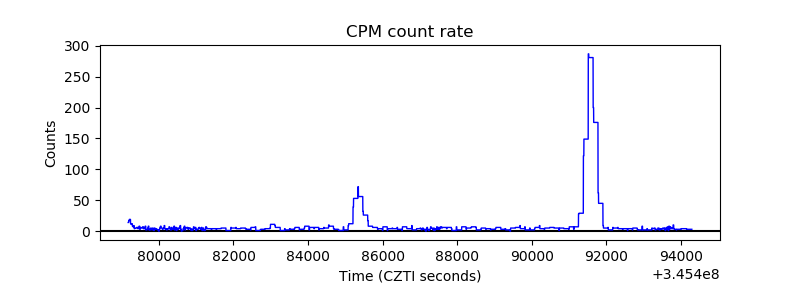 |
| CZT Counter | 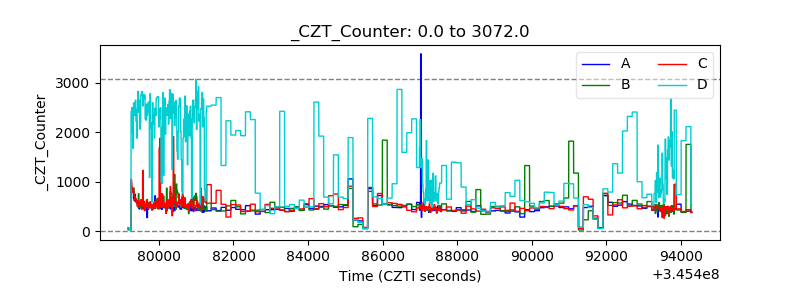 |
| +2.5 Volts monitor |  |
| +5 Volts monitor |  |
| _ROLL_ROT | 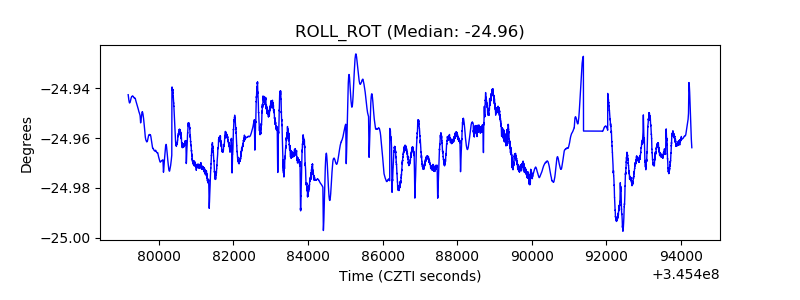 |
| _Roll_DEC |  |
| _Roll_RA | 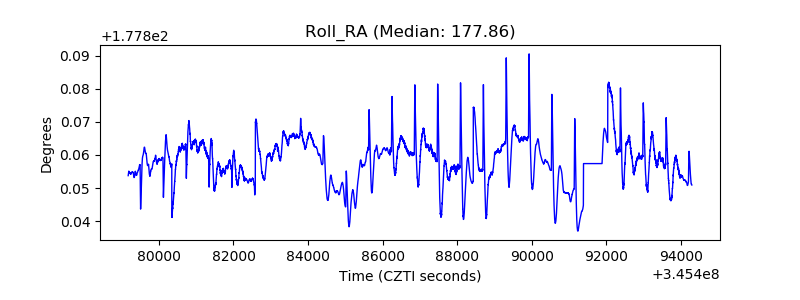 |
| Veto Counter | 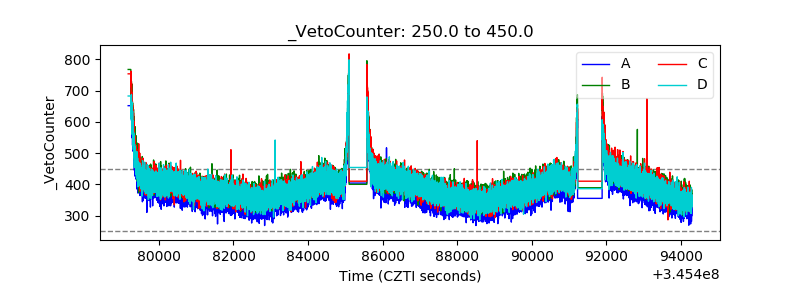 |